


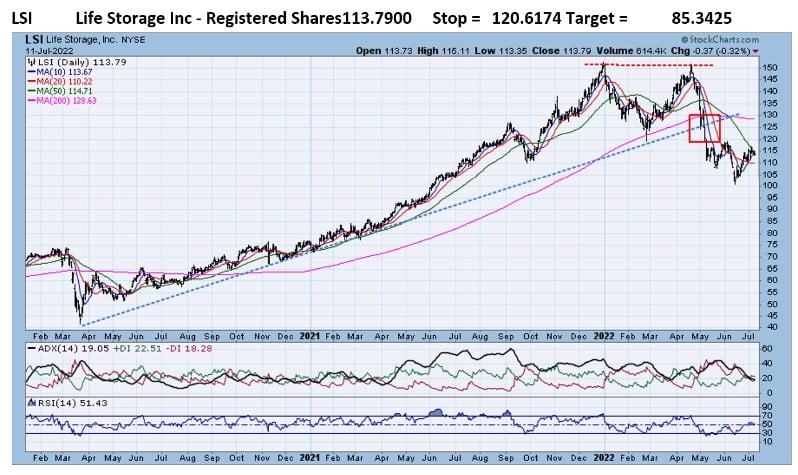
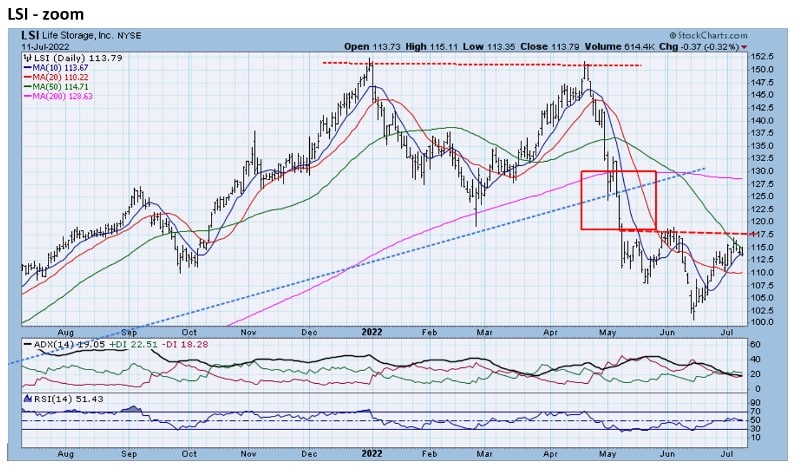
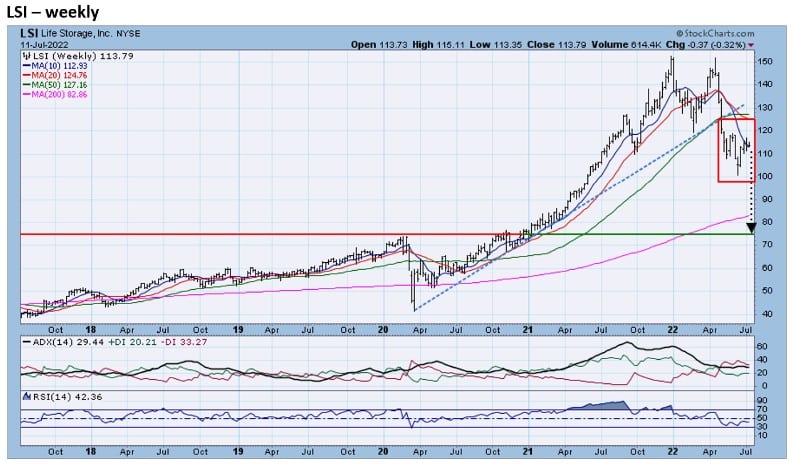
- LSI double-topped in December and April after a rally of more than 270%. In May, LSI fell below its steep and steady 2-year uptrend line, leaving it vulnerable to further declines. The zoom chart shows that a recent rally puts LSI back at resistance from its breakpoint. The weekly chart reveals that long-term support is still 30% lower; near the 2021 breakout level.
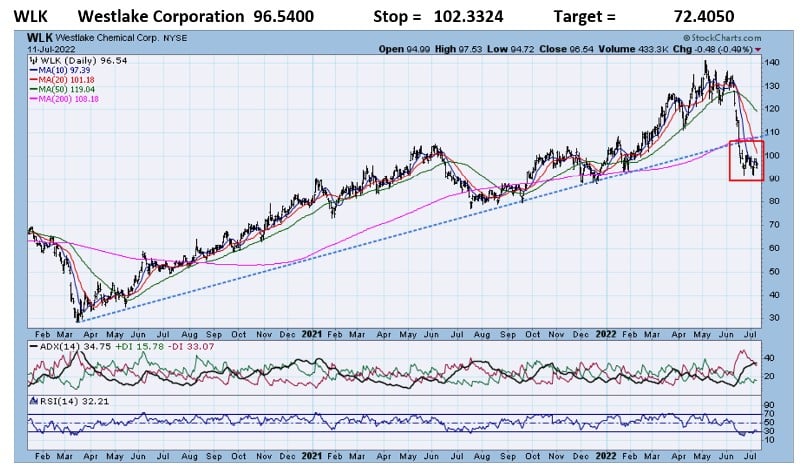
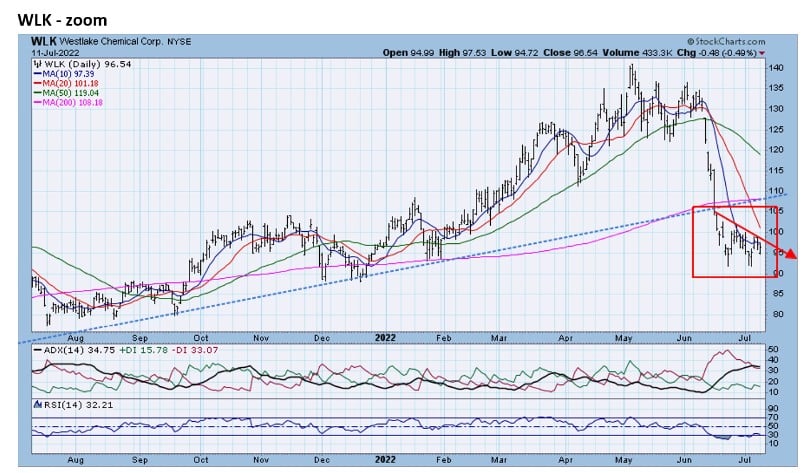
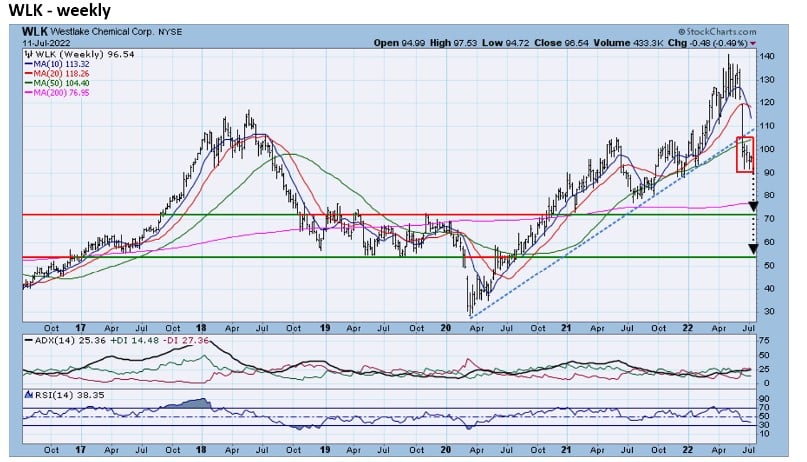
- WLK fell below the 26-month line. WLK rallied over 360% from the March 2020 lows to the May 2022 highs; leaving it vulnerable to significant pullbacks. The zoom chart reveals a pattern of lower highs=downtrend. Long-term support is either 25% or 40% lower depending on which level holds (weekly chart).


Jeff Marcus founded Turning Point Analytics (TPA) in 2009 after 25 years on trading desks and 13 years as a head trader to provide strategic and technical research to institutional clients. Turning Point Analytics (TPA) provides a unique strategy that works as an overlay to clients’ good fundamental analysis. After 10 years of serving only large institutions, TPA now offers its research services to mid and small managers, RIA’s, and wealthy sophisticated individuals looking for a way to increase their returns and outperform their peers.
Subscribe 2 Week Trial
Customer Relationship Summary (Form CRS)