


We have read a few articles expressing concern that the free cash flow for many of the Magnificent (Mag) 7 companies that are heavily involved in AI development and/or data center construction has leveled off. Furthermore, the hyperscalers, including Amazon, Microsoft, Google, and Oracle, issued over $120 billion in debt last year. Additionally, Google just issued $32 billion of debt in 2026. The recent financial concerns are blamed for the Mag 7s poor relative performance recently. The Mag 7 narrative is shifting from cash generation to capital consumption.
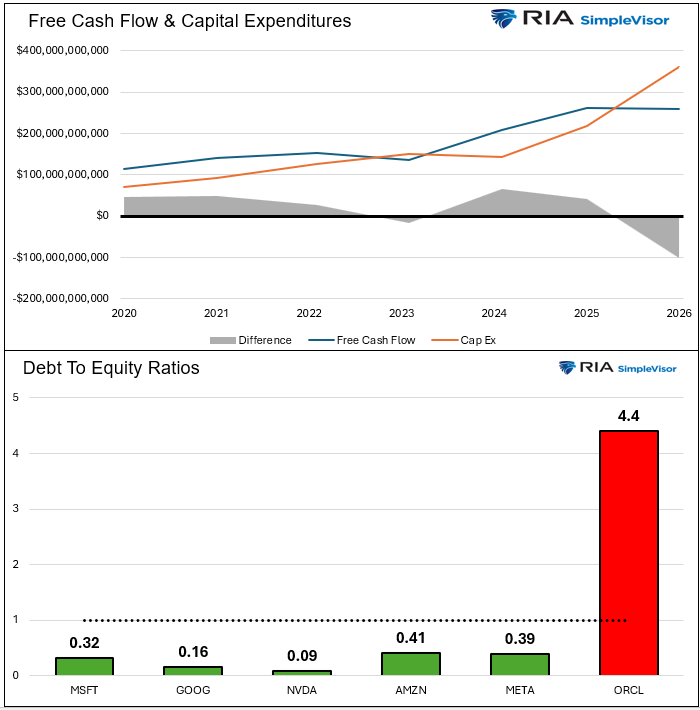
The graphs below help us better assess the new narrative driving the AI-intensive Mag 7 companies. The top graph shows the aggregate free cash flows and capital expenditures for Google, Meta, Nvidia, Microsoft, and Amazon. Free cash flow has stopped growing, while capital expenditures continue to rise. Moreover, the difference between the two is now negative. While the current dynamics have changed, we should expect these companies to invest heavily in AI. And they are. As we see, free cash flow is no longer enough to fully fund capital expenditures.
As a result, debt is supplementing free cash flow. Oracle is making headlines about excessive debt, and concerns are spreading, rightly or wrongly, across the industry. Oracle has a debt-to-equity ratio of 4.40 and has spent $21 billion in Cap Ex last year, resulting in negative cash flow. However, Oracle’s debt burden differs significantly from that of the Mag 7 stocks, as shown in the second graph.
Bottom line: expect AI companies to increase the use of debt to fund AI Cap Ex. But bear in mind, this investment has significant profit potential. Furthermore, the Mag 7 companies have very low debt-to-equity ratios, allowing them ample room to fund AI beyond cash flow.
What To Watch Today
Earnings
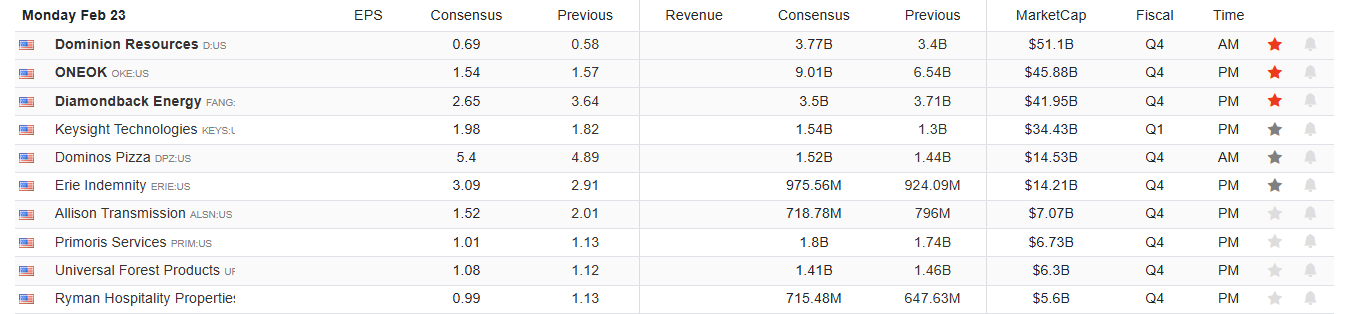
Economy

Market Trading Update
On Friday, we discussed opportunities in the SaaS sector. Heading into this week, the market will look past last week’s weak GDP number, a temporary hit due to the government shutdown, and focus on Nvidia’s earnings report. However, let’s look at the trading setup as we start the final week of February.
The S&P 500 closed Friday at 6,909, and from a pure trend perspective, the market remains bullish within an ongoing consolidation. Currently, the market is wrestling with overhead resistance defined by the 20- and 50-day moving averages. Notably, every pullback to support levels, the most recent being the 100-day moving average, continues to attract retail buyers. While money flows have improved, which is constructive, the more important issue is whether the market can break out of the recent consolidation to the upside.
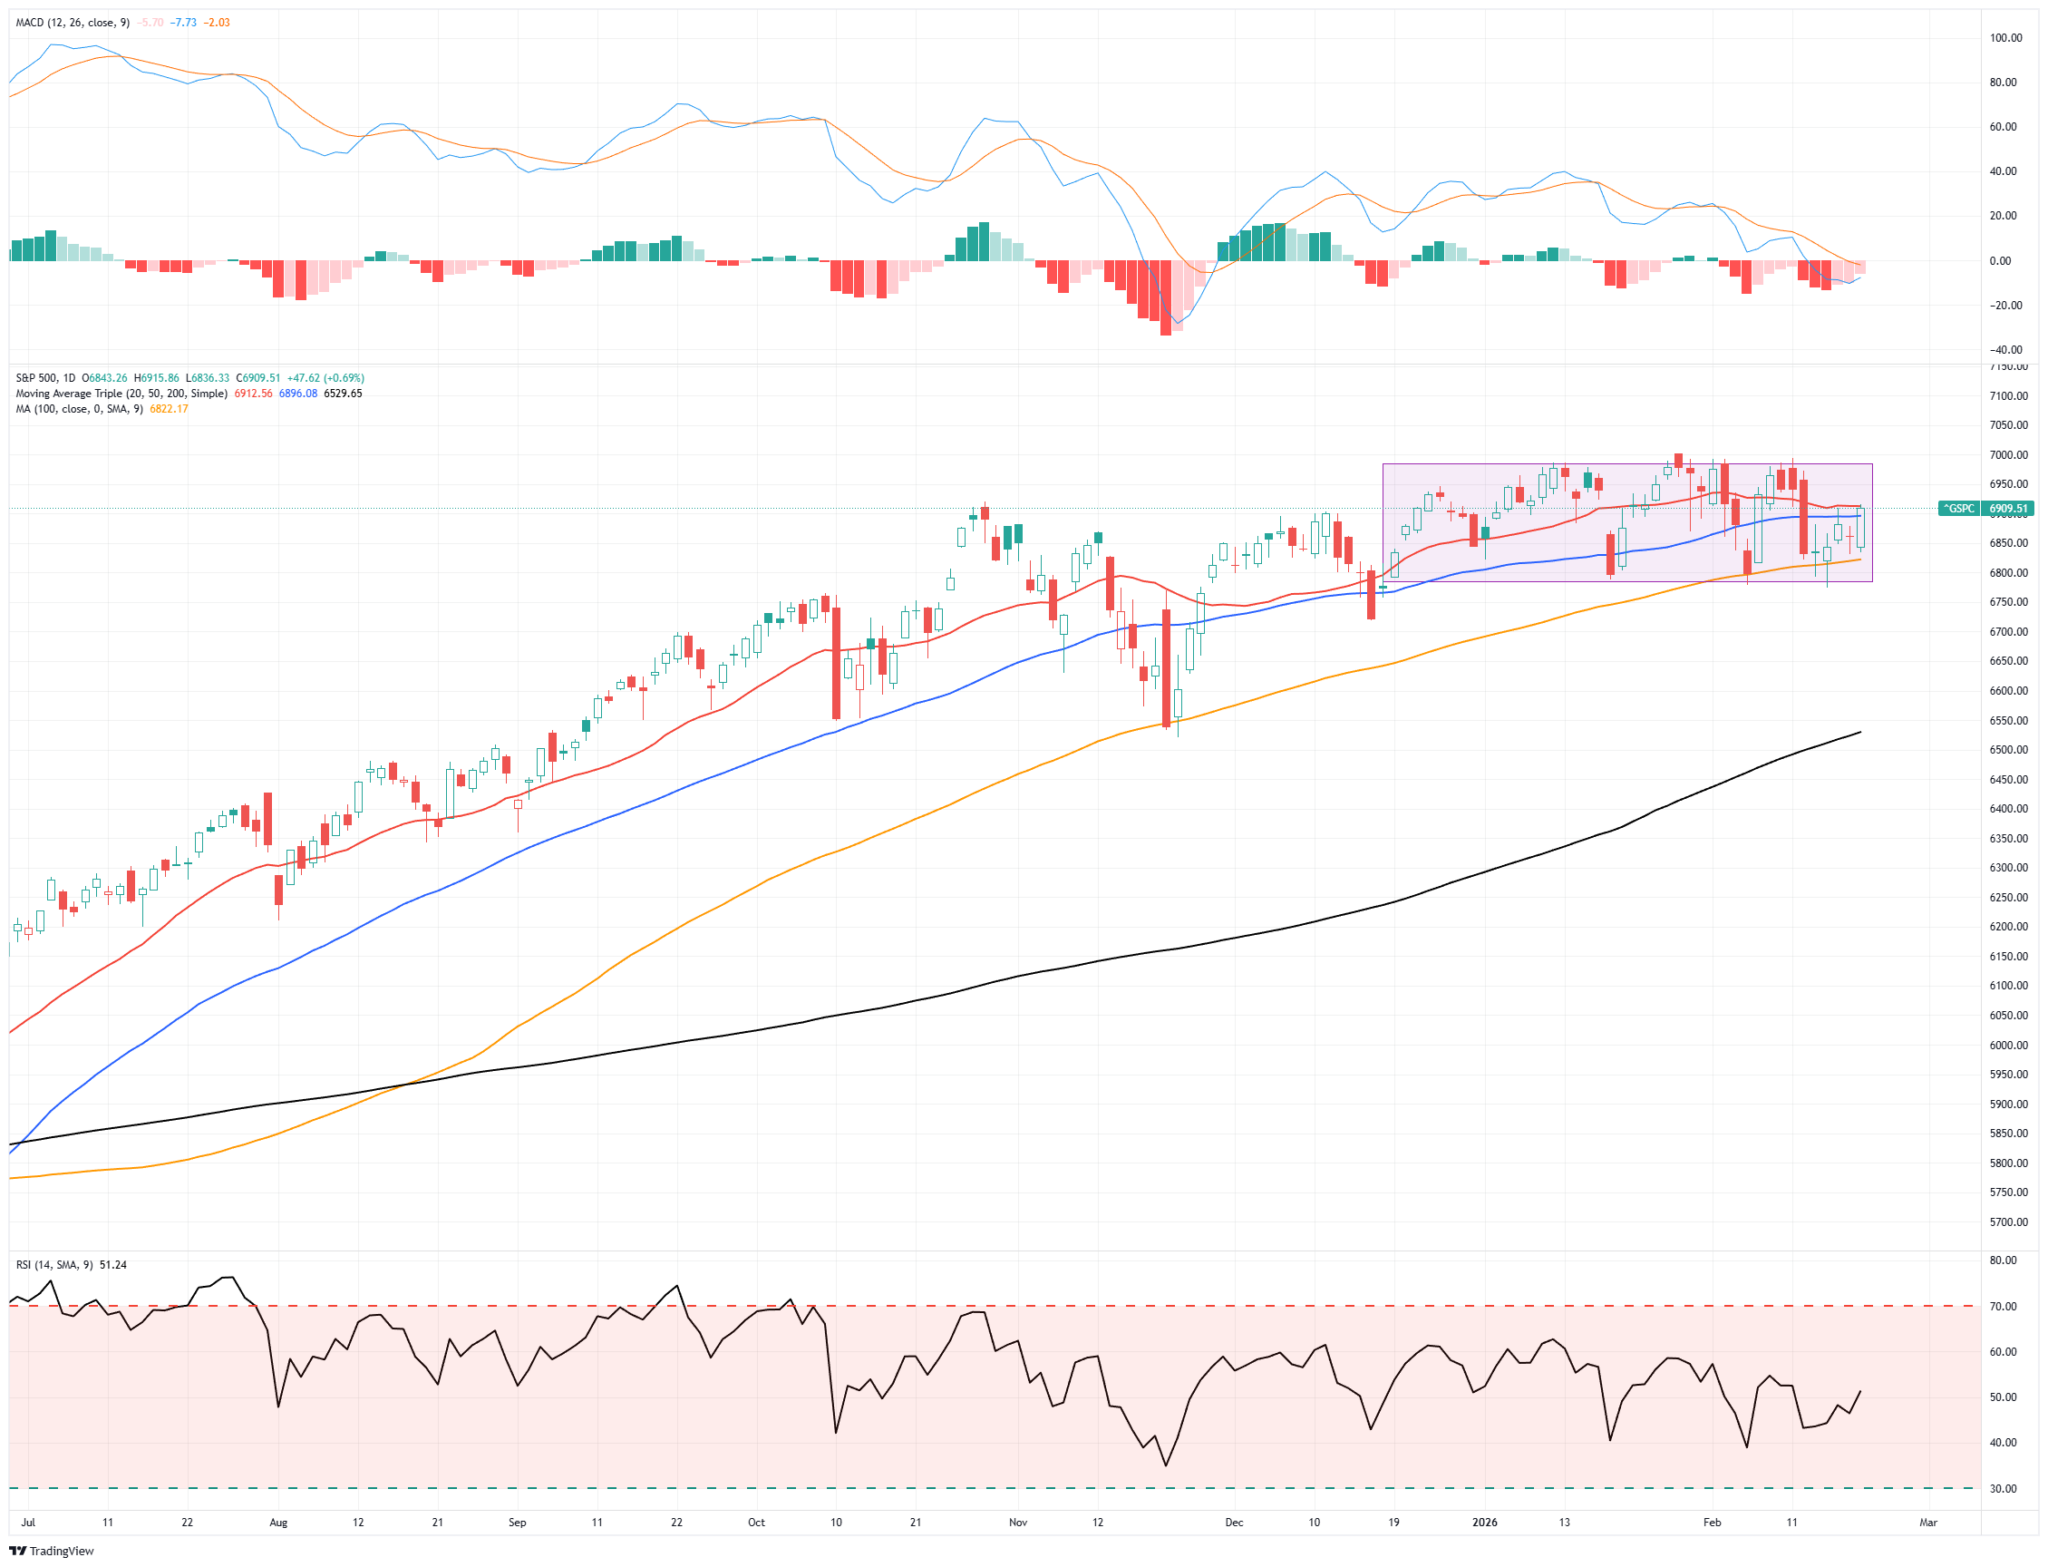
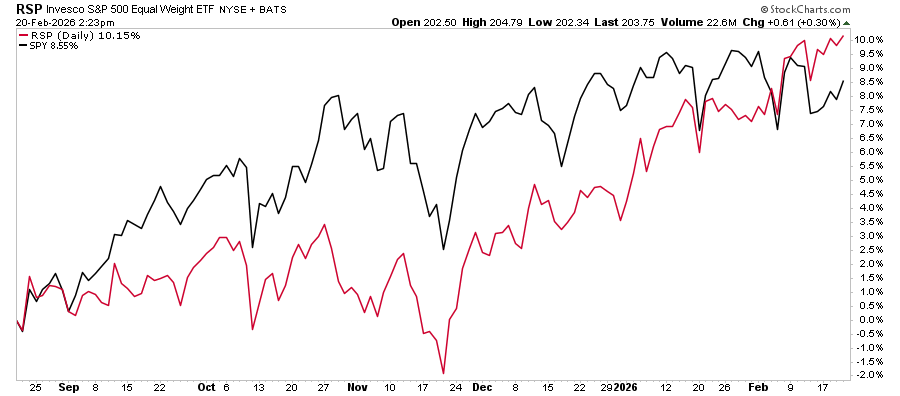
Notably, as discussed last Monday, the current “bifurcation” in the market is becoming more pronounced, as shown by the performance gap between the equal-weighted and market-cap-weighted indices. As we discuss in more detail below, those market sectors make up a relatively small portion of the overall index and suggest that their recent outperformance has more than offset the weakness in the Technology sector.
Conversely, technology, finance, communications, and healthcare are either neutral or oversold. That bifurcation between sectors sets the market up for a rather vicious rotation and only needs a catalyst. However, for the broad market index, momentum indicators are also reversing and pushing to levels supportive of a move higher. However, that move higher won’t occur until the major market sectors begin to see inflows. Lastly, volatility has been on the rise, which poses a risk of a reflexive setup: systematic strategies have added exposure amid low realized volatility, but even a modest volatility spike could trigger mechanical de-risking.
Bottom line: The bull trend is intact, but the “easy money” phase appears mature. This is a time to rebalance oversized winners, define risk levels, avoid chasing strength, and don’t fight the trend, but to protect gains if volatility inevitably returns.
| Level Type | Price Zone | Technical Significance |
|---|---|---|
| Immediate Resistance | 6,950 – 7,000 | Psychological round-number resistance. Repeated failures in this range of previous rallies. |
| Secondary Resistance | 7,100 | First extension target if the market breaks above the current range. |
| Initial Resistance | 6,912 | 20-Day Moving Average (DMA) |
| Intermediate Support | 6,896 | 50-DMA |
| Major Support | 6,750-6,800 | Bottom of the consolidation range. |

The Week Ahead & PCE Prices and GDP
NVIDIA earnings on Wednesday may drive the market this week. NVIDIA has been range-bound, while many other tech stocks have been under pressure. Will strong earnings from Nvidia force the market to rotate back toward AI stocks and growth stocks over value?
The economic calendar is quiet, with PPI as the only significant data point. There are plenty of Fed speakers this week, of which we expect to hear hawkish and dovish views. Given the wide range of opinions, we doubt the market will make much of any one speech.
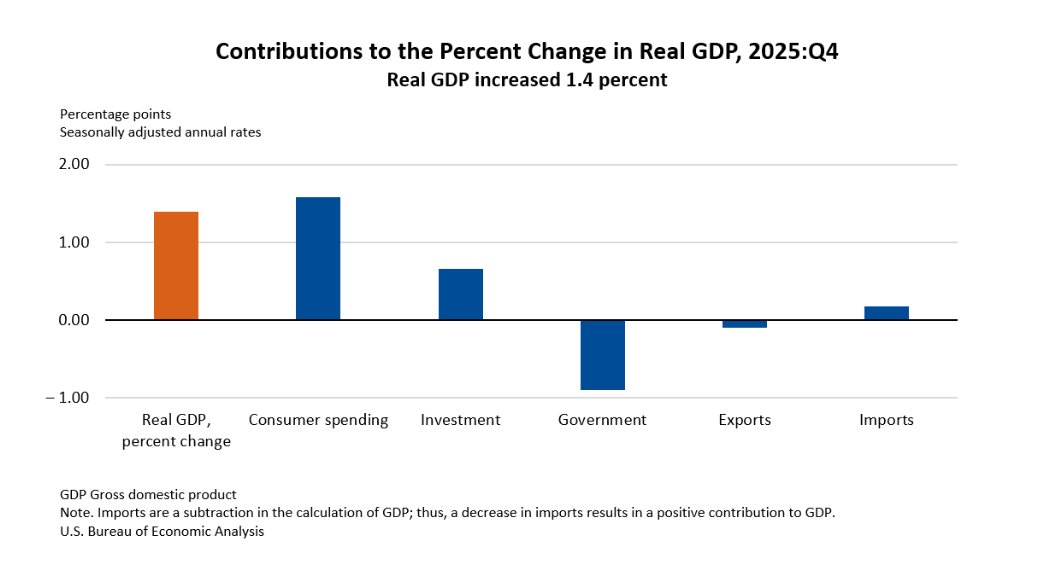
The US economy grew well below the expected 3.0% rate at 1.4%. As shown below, consumer spending and business investment in AI were strong, but the government shutdown negatively impacted growth. PCE prices, both core and headline, were 0.1% higher than estimates. While that is concerning, the data was for December. As we have noted, Truflation shows a sharp decline in inflation starting in 2026. Per their estimate, real-time PCE is currently at 1.55%, almost half of the just-reported December PCE annual rate.
Money: The Ten Immutable Laws Of Building Wealth
Money – everybody wants it, but few actually have it. As shown in recent financial statistics, the “wealth gap” in America continues to grow between the “haves” and the “have-nots.” That gap has led to a bombardment of narratives explaining why younger generations are financially oppressed. As shown, the top 10% of income earners own roughly 68% of all assets. However, the bottom 50% own just 2.5%. Why is that?
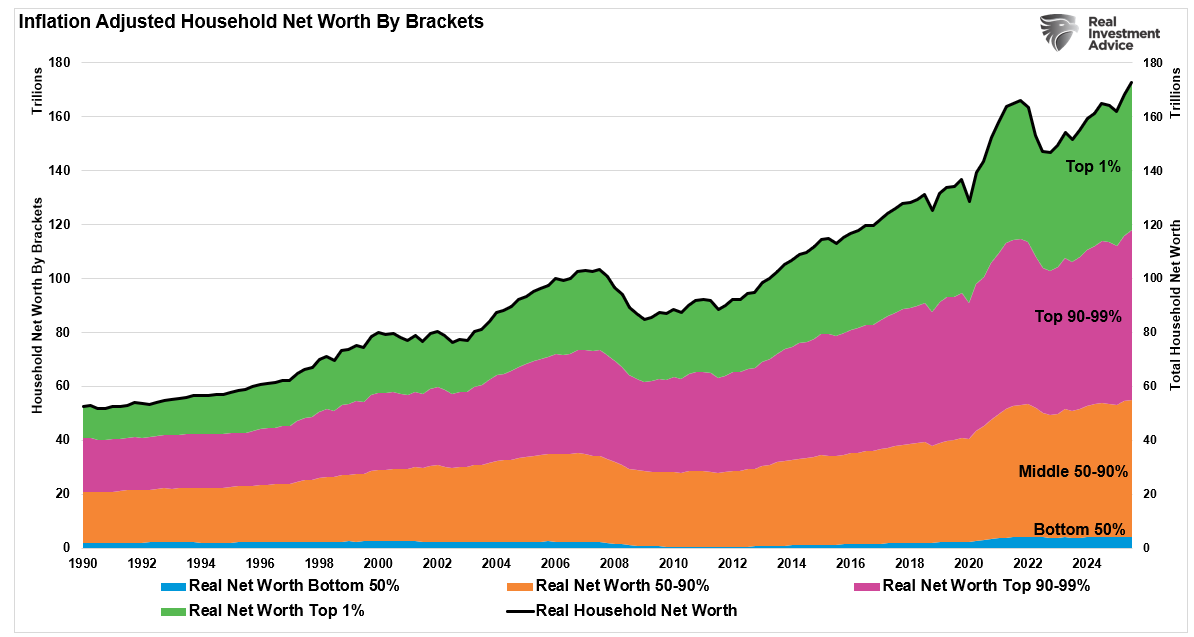
When you see the data, it is easy to understand the frustration. Some call it “corporatism,” others call it “Financial Nihilism.” Then there are those who point fingers and blame inflation, stagnating wages, student debt, or political policies. Yes, these forces matter.
However, those are just excuses, not the “root cause” of personal financial failure. As individuals, we can choose to remain a “victim” and blame others for our failures. Or, we can take control of our financial future. The hard truth is that wealth accumulates only through time‑tested financial principles:
- Spend less than you earn.
- Save consistently.
- Invest intelligently.
These principles are not new. They worked before the internet, before credit cards, and before retail investors discovered the stock market. Most crucial, those principles still work today, regardless of your employment, education, age, race, or gender. Wealth is not a random event or a meme trend. It is a process.
Tweet of the Day
“Want to achieve better long-term success in managing your portfolio? Here are our 15-trading rules for managing market risks.”
Please subscribe to the daily commentary to receive these updates every morning before the opening bell.
If you found this blog useful, please send it to someone else, share it on social media, or contact us to set up a meeting.