


Inside This Weeks Bull Bear Report
- Market Sell-Off As Jackson Hole Leans Hawkish
- Breadth and Earnings
- How We Are Trading It
- Research Report – Is The Bear Market Over?
- Stock Of The Week
- Daily Commentary Bits
- Market Statistics
- Stock Screens
- Portfolio Trades This Week
Market Sell-Off As Jackson Hole Leans Hawkish
The market sell-off this week was a failure at the 200-dma resistance. We previously noted:
For investors, the market is now back to highly overbought conditions. The market is not only testing resistance at the 200-dma but is also well deviated above the 50-dma with the Relative Strength Index (RSI) back to more extreme overbought levels. The market sell-off on Friday was expected, but we will have to wait and see if it is a one-day dip or a more sizeable retracement. We suspect we may see the latter with the MACD close to a sell signal.“
As shown below, the market sell-off quickly reversed that overbought condition into oversold. The swiftness of that reversal of overbought conditions was interesting, given only a one-week decline in the market. Nonetheless, in Thursday’s Daily Market Commentary:
“With respect to the 50-dma, that moving average has turned from a negative to positive trend slope, which is historically bullish. The market has reached very slight oversold conditions, so a rally today will not be surprising.”
That rally was feeble on Wednesday, but the market surged on Thursday in hopes that Jerome Powell’s Jackson Hole Summit speech would confirm the market’s expectations of a more “doveish” tilt.
Unfortunately, the market was wrong.
On Friday, Jerome Powell delivered a much more hawkish message than expected, stating the need to continue to hike rates to combat inflation. To wit:
“Restoring price stability will take some time and requires using our tools forcefully to bring demand and supply into better balance. Reducing inflation is likely to require a sustained period of below-trend growth. Moreover, there will very likely be some softening of labor market conditions. While higher interest rates, slower growth, and softer labor market conditions will bring down inflation, they will also bring some pain to households and businesses. These are the unfortunate costs of reducing inflation. But a failure to restore price stability would mean far greater pain.” – Jerome Powell
That message was not the “pivot” the market was looking for and consequently fueled a sharp market sell-off on Friday. The break of the 100-dma also sets the market up for a retest of the 50-dma next week. Given the sharp market sell-off on Friday, some follow-through selling on Monday would be of no surprise.
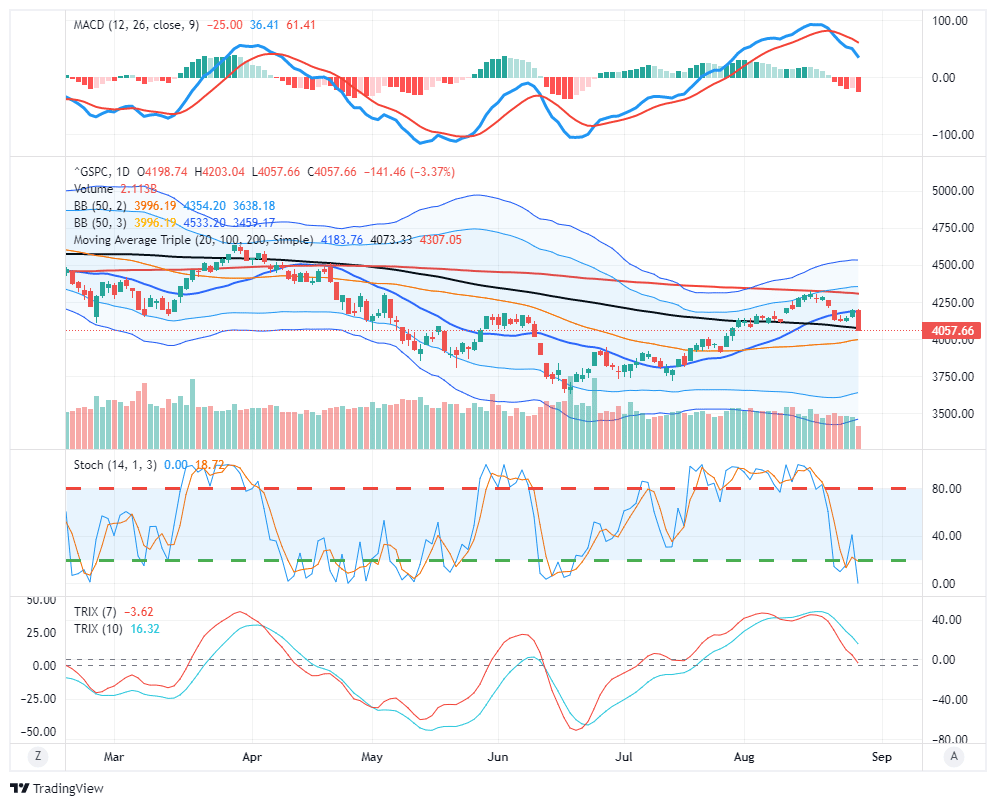
However, with the markets once again deeply oversold, a reflexive bounce is likely. With the market failing a test of resistance at 4160ish, and with the MACD still on a “sell signal,” we continue to suggest selling any rallies for the time being.
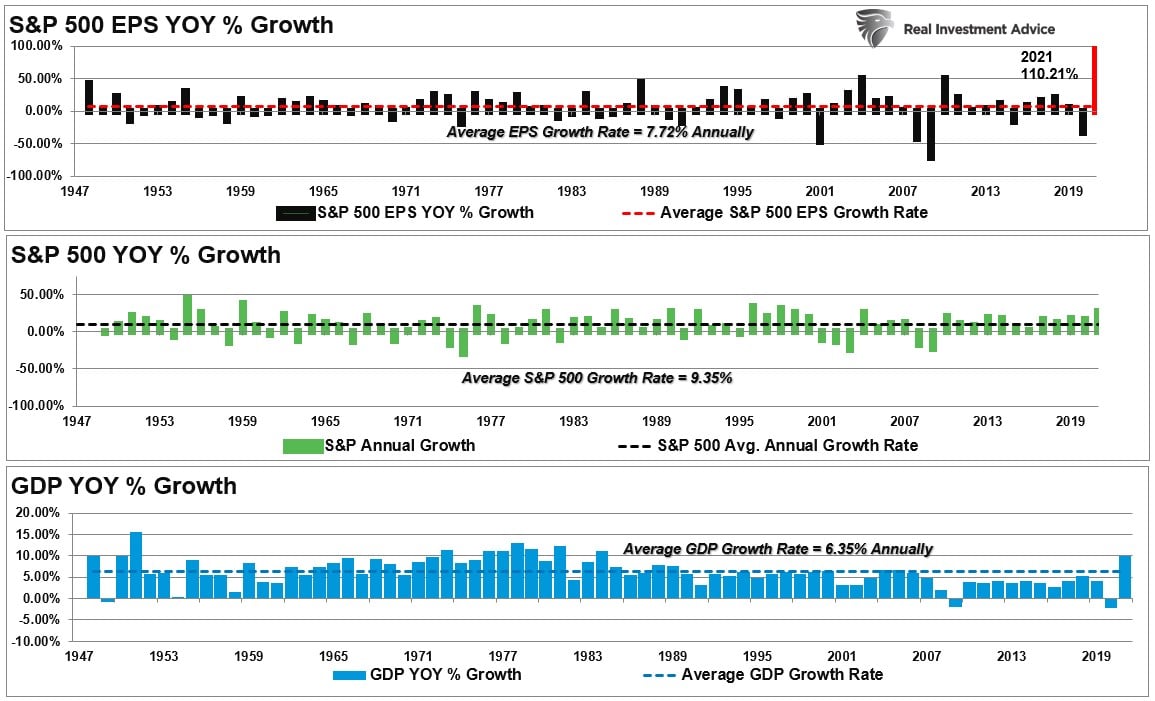
One of the issues that remains problematic for investors over the next several months is the “breadth” of the market and earnings growth.
The S&P Breadth Problem
As noted last week, the S&P has a breadth problem.
“The average S&P gain in 43 bear market rallies since 1929 was 17.2%, with an average duration of 39 trading days. The current rally was 17.4% in 41 days, or as Hartnett puts it, textbook. Furthermore, bear-market rallies are always “narrow.” The recent rally was also narrow 30% of the entire gain in the S&P 500 coming from just 4 stocks: AAPL, MSFT, AMZN, and TSLA.
It was a point reiterated by Yahoo Finance this past week:
“As these trades lose steam and culprits like the strengthening dollar again make their presence known, this recent rally appears more troubled than a few weak sessions might otherwise indicate.
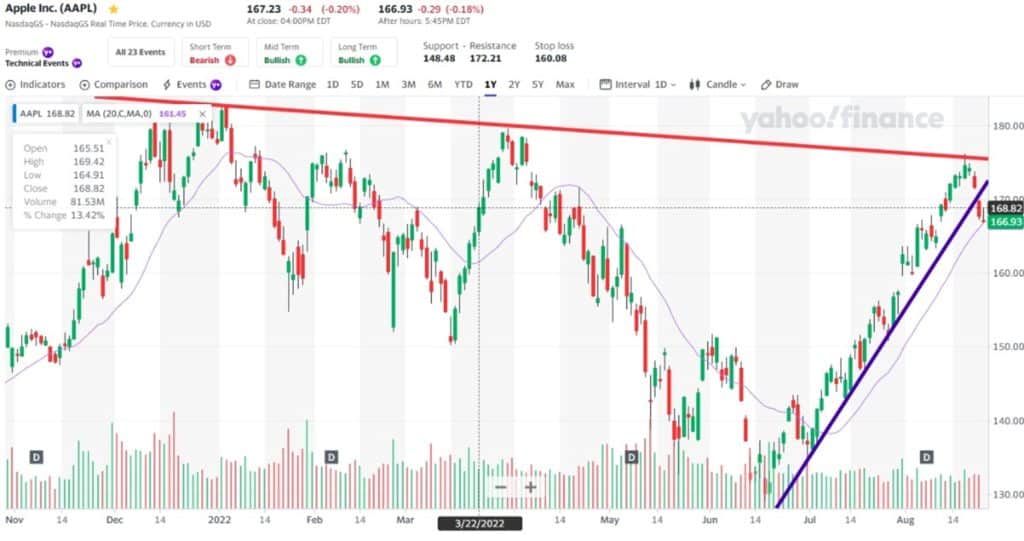
Apple, arguably the most important bellwether stock on Earth, suffered its worst two-day plunge in two months on Friday and Monday after hitting key trend line resistance. That drop saw the stock break a separate and steep trend line to the downside; the stock now sits on its 20-day moving average.
Through the summer, Apple climbed within 4% of its record high. Such is an impressive rebound for a stock that fell about 30% from late March through mid-June. This quick reversal, however, has Apple shares on shaky footing.”
We recently saw similar action in the other mega-cap stocks, with MSFT, TSLA, and AMZN gaining ground. Such, as noted previously, is a function of the “passive indexing” effect distorting the market.
“Therefore, as investors buy shares of a passive ETF, the shares of all the underlying companies must get purchased. Given the massive inflows into ETFs over the last year and subsequent inflows into the top-10 stocks, the mirage of market stability is not surprising.”
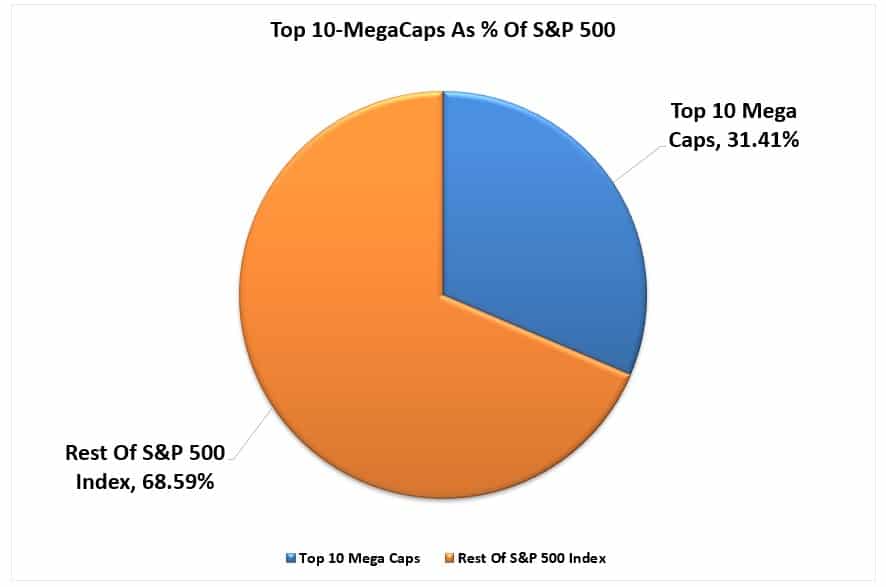
The Top-10 mega-capitalization stocks comprise 33% of the entire S&P 500 index, meaning that more than 31% of every dollar invested into passive ETFs flows into the top-10 stocks. The other 69% of each dollar gets divided between the remaining 490 companies. Given the enormous flows into passive ETFs over the last few years, the resiliency in the top-10 holdings should not be surprising.
However, this support provided by “passive ETFs” is also problematic in evaluating the strength or weakness of the overall market.
As noted over the last two weeks, some technical measures of the market are flashing more bullish signals. The percent of S&P 500 components trading above their 50-day moving averages, 50% retracements of declines, and others have previously denoted market bottoms.
However, key leaders and industry groups, such as the high yield bond market and semiconductor industry, continue to underperform and quickly reverse. The massive short-covering in recent weeks can only take a market so far.
The problem for the “bulls” will come down to fundamentals. While hopes of a “Powell Pivot” drove the bulk of the rally from the July lows, there is little indication, as witnessed by Friday’s market sell-off, that the Federal Reserve will reverse its policy course soon. Such will eventually lead investors to return their focus to fundamentals, which remain mainly at risk.
Earnings Estimates Are Coming Down
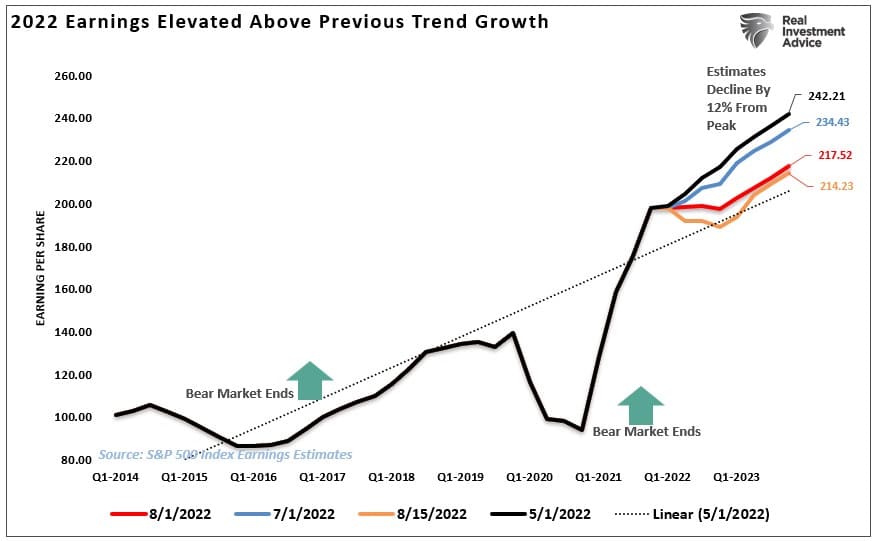
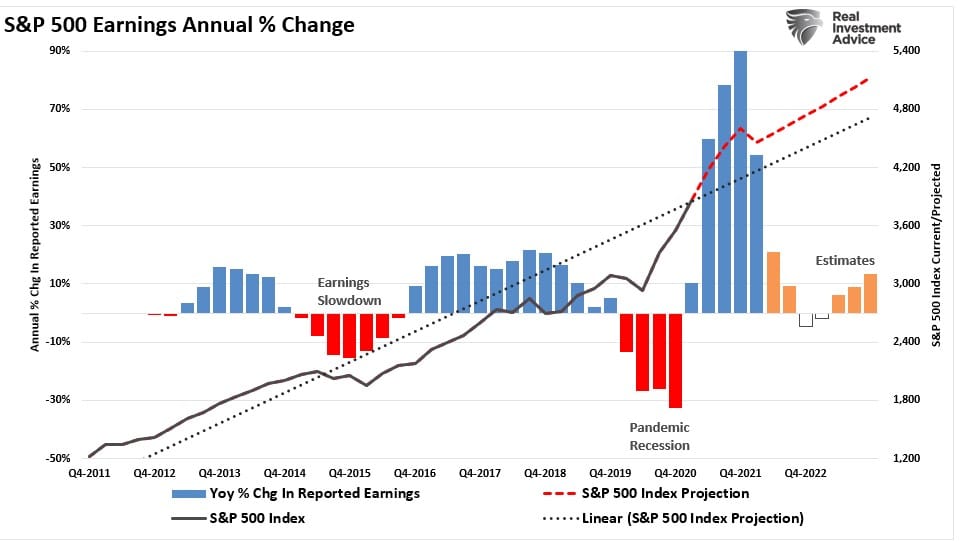
Starting last year, we discussed on numerous occasions that earnings estimates were overly optimistic and would need to come down to align with economic realities. That process has now begun. In the last two months, estimates for Q4-2023 have dropped by roughly 12%. Such would be considered normal for an economic slowdown. However, if the economy slips into a recession, a decline of 50% in the estimates would be in line.
The decline should not be surprising, given that economic growth and earnings have a long-term historical correlation. Such would seem logical, given that economic activity generates revenues for companies. Therefore, while it is possible for earnings to grow faster than the economy at times, i.e., post-recession, they can not outgrow the economy indefinitely. The earnings surge in 2021 is something never witnessed previously and must eventually revert to norms.
Despite weakening economic growth as inflation increases, the reduction of liquidity, and profit margins under pressure, analysts continue to keep estimates elevated. Currently, estimates for Q4-2023 are $214.23/share according to S&P. This is a downward revision from $242.21 in May, suggesting only an 8% increase in earnings over two years. Hardly something supportive of strongly rising asset prices.
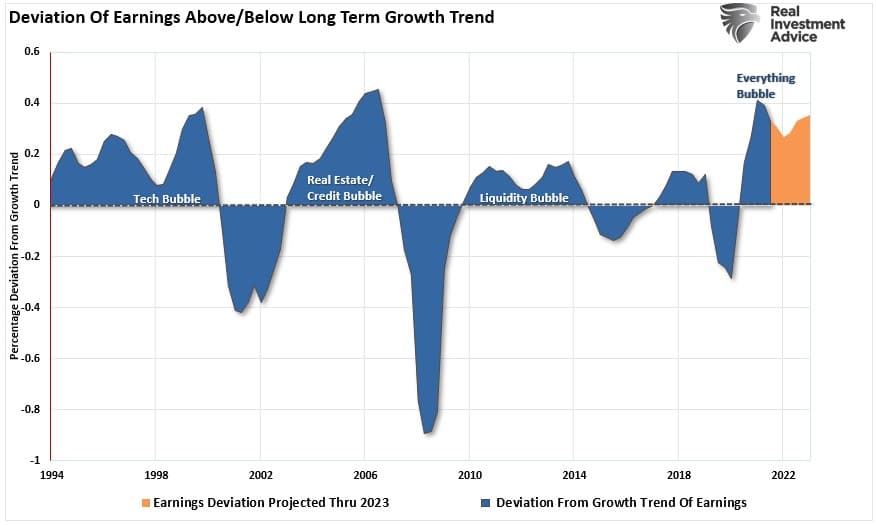
More importantly, despite the recent downward revisions, the current estimates still exceed the historical 6% exponential growth trend, which contained earnings growth since 1950, by one of the most significant deviations ever.
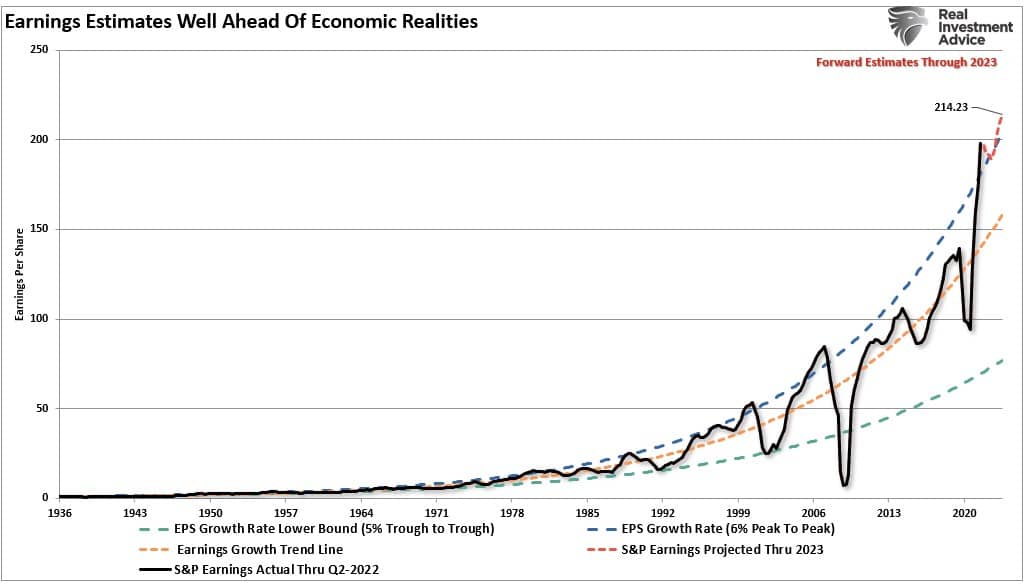
The only two previous periods with similar deviations are the “Financial Crisis” and the “Dot.com” bubble.
Lots Of Headwinds To Challenge Fundamentals
While many have become increasingly bullish on the market, suggesting the “bottom” for stocks is made, I would caution otherwise.
The market risk remains fundamentals against a backdrop of the reversal of monetary accommodation. The most significant bottom-line earnings drivers remain accounting gimmicks, share repurchases, and lower tax rates. However, as we advance, there are numerous risks to earnings.
- Changes to tax code or rates (aka the 15% minimum corporate income tax.)
- Increased borrowing costs from higher rates.
- Increased wage costs
- Inflationary pressures
- Decreased demand
- Slower economic growth
- A reversal of share buybacks either through choice or legislation (aka the 1% tax on share buybacks.)
However, regardless of those potential impacts, the annual rate of change in earnings will slow markedly as year-over-year comparisons become more challenging.
While the bulls remain optimistic, the deviation between prices and fundamental realities suggests risks that investors should not quickly dismiss.
Not Getting The Bull Bear Report Each Week In Your Mailbox? Subscribe Here For Free.
3-Minutes On The FOMC Minutes
Subscribe To Our Youtube Channel To Get Notified Of All Our Videos
How We Are Trading It
As noted above, Powell’s Jackson Hole Summit speech failed to deliver the “dovish” message expected, leading to a sharp market sell-off on Friday. What the market may be starting to realize is what we have said repeatedly in recent months, which is the Fed is continuing to tighten monetary policy. Tighter monetary policy will ultimately impact both economic growth and earnings.
We currently remain underweight in technology, even after recently adding some exposure to semiconductors, and are overweight in energy due to oversold oil prices. We are now actively looking to increase our exposure to the “growth” side of the portfolio which should perform better as disinflationary pressures become more prevalent later this year.
Looking at our Relative Sector Analysis in SimpleVisor.com, we see two things: 1) the Technology Sector is slightly oversold relative to the S&P 500 index, and 2) several companies are now oversold relative to their counterparts in the sector. (Example: CRM, INTC, ADBE, V, and NVDA are all oversold compared to CSCO.)
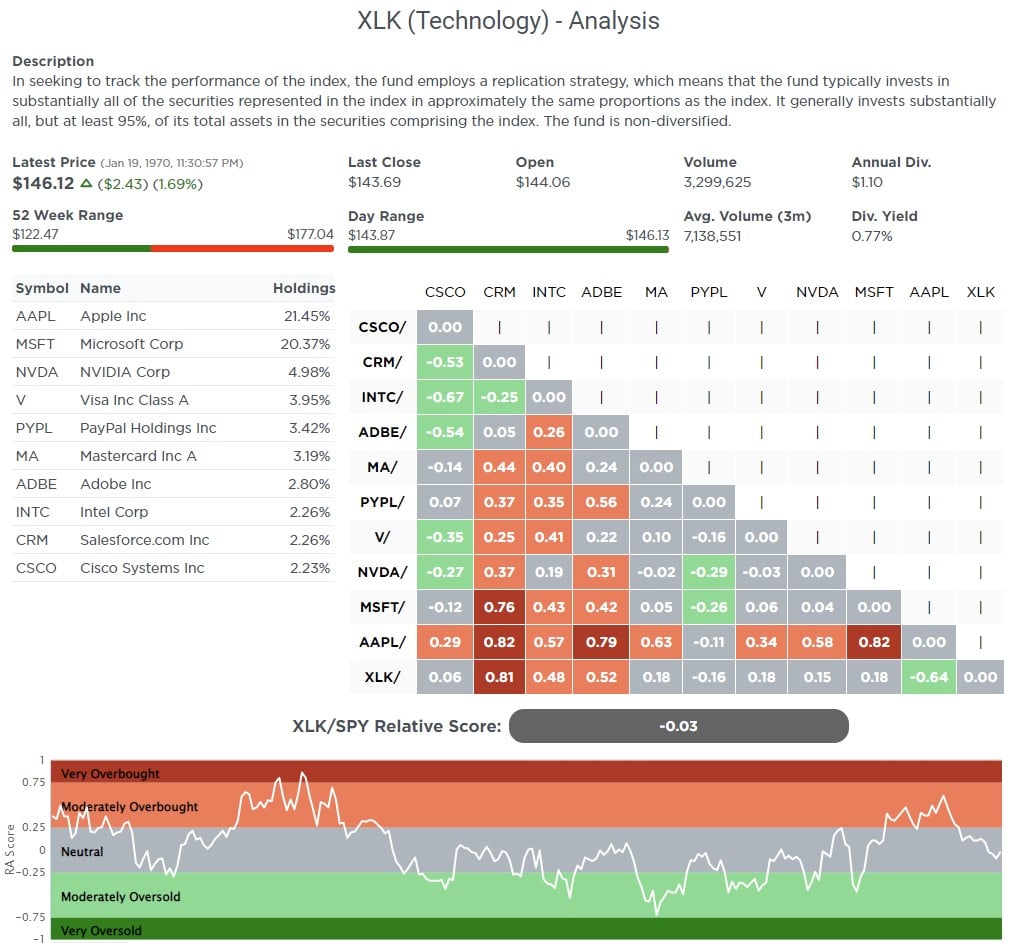
That analysis now provides us with some areas to start digging on the fundamental side to find some “growth” candidates. In theory, once the market sell-off is over, these stocks could outperform the market and sector constituents.
We again rebalanced our energy holdings in the portfolio last week as oil broke above its downtrend channel. (Trades are listed at the bottom of the post.) Such slightly increased our equity allocations from the previous week.
With Jackson Hole now behind us and only the September FOMC meeting ahead, we continue taking some action now with markets on a MACD sell signal.
- Sell losers and laggards.
- Trim winners back to portfolio weights
- Rebalance allocations
- Hold cash for opportunities
Once that sell signal reverses, we can look to more aggressively increase equity allocations.
Need Help With Your Investing Strategy?
Are you looking for complete financial, insurance, and estate planning? Need a risk-managed portfolio management strategy to grow and protect your savings? Whatever your needs are, we are here to help.

Research Report

Stock Of The Week In Review – Factors For Success
In the Bull Bear Report, we will post one of the stocks from our research at SimpleVisor to find stocks worth taking a deeper look at. The 5-For-Friday report is published each week in full for SimpleVisor.com subscribers.
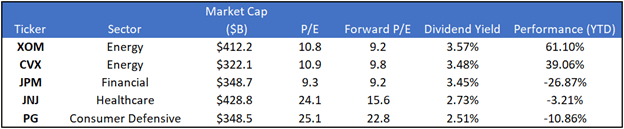
We chose the top five holdings from our proxy ETF, VYM, as our five stocks this week. As the top holdings in the factor ETF, they should benefit from passive-investing inflows into the ETF. All five are well-known large-cap stocks, and three are trading comfortably in value territory. On average, they carry a higher dividend yield than VYM.
Unlike some other screens, we like the five stocks as a package. We understand that two stocks (JPM and PG) were down in the year’s first half. While they may decline further if the market takes another leg lower, the diversification and industry risk mitigation they offer to make this package of five stocks likely to outperform the broader markets in a down market.
Login to Simplevisor.com to read the full 5-For-Friday report.
Daily Commentary Bits
Baron’s Says Brace for a Bad September
The opening paragraph in September is Usually a Bad Month for Stocks. This One Could be Ugly is as follows:
The stock market’s worst month—September—is approaching. This one could be particularly bad.
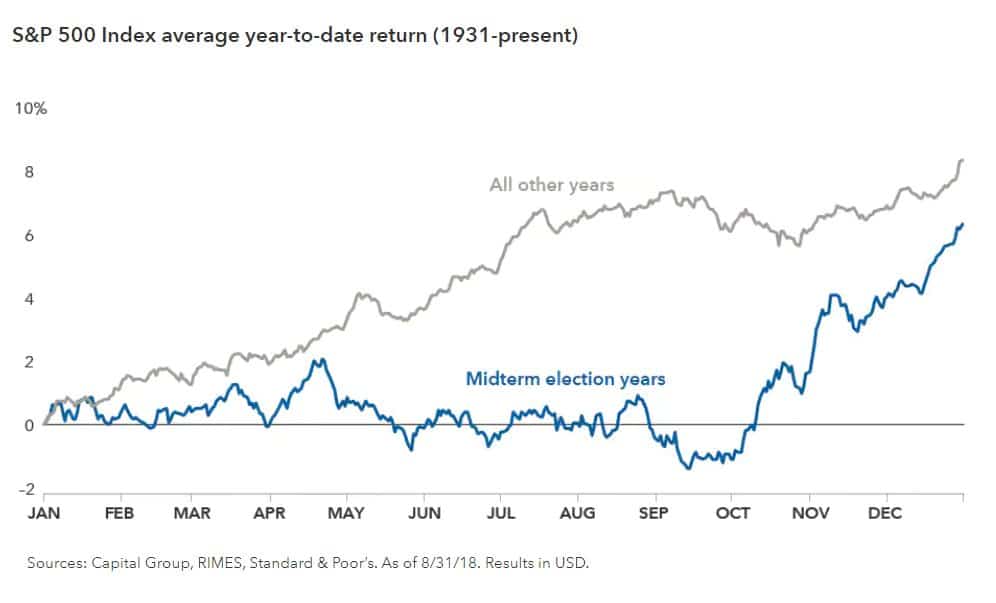
Despite the fearful headline, the following paragraph states that the S&P has only averaged a 1% loss in September going back to 1928. The graph below also shows that September tends to be challenging but not “ugly.” To help justify using the word “ugly,” the author offers the following reasons to be concerned:
- “The stock market has already ripped higher recently, with both indexes up double digits in percentage terms since their lowest levels of the year in mid-June.”
- The probably of the Fed hiking by .75% at its September meeting
- Bond yields moving higher
- Oil prices perking back up
Despite the author’s concerns, the chart below shows that the market’s behavior in midterm election years is very different than in non-midterm election years. Based on the average for midterm years, we should expect a weak start to September and a strong run higher for the remainder of the year.
Click Here To Read The Latest Daily Market Commentary (Subscribe For Pre-Market Email)
Bull Bear Report Market Statistics & Screens
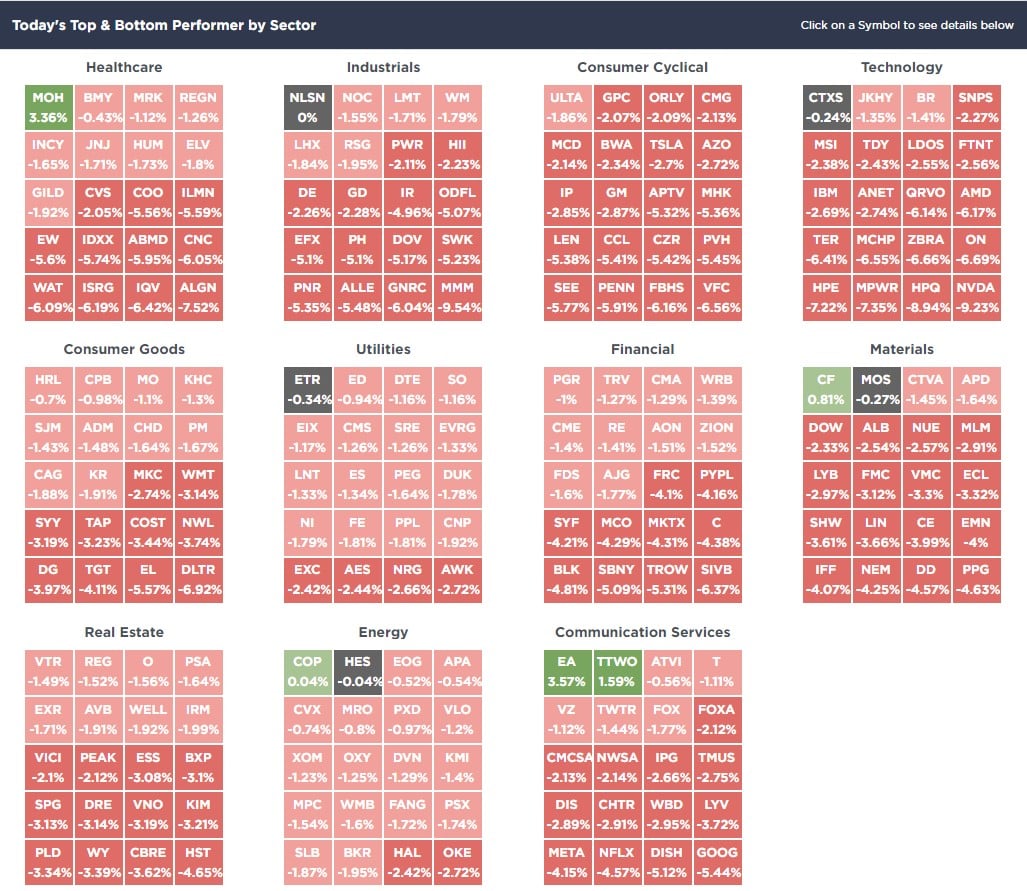
SimpleVisor Top & Bottom Performers By Sector
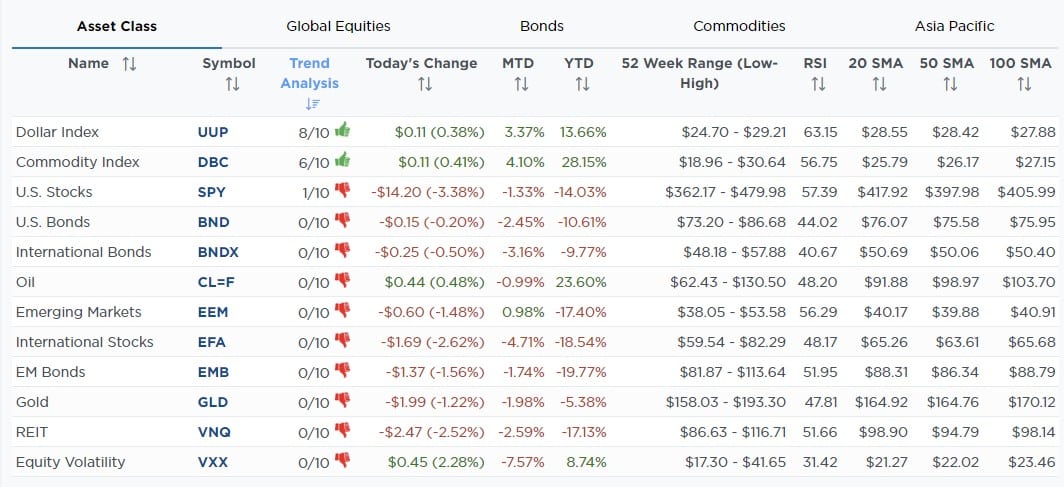
SimpleVisor Asset Class Trend Analysis
Relative Performance Analysis
That didn’t take long. We noted two weeks ago:
“The market surge pushed EVERY MARKET and SECTOR into extreme overbought territory. As is usually the case, this analysis indicates the market has likely extracted the majority of the rally, so taking profits remains a profitable strategy.“
That analysis was very timely as the markets sold off sharply this past week. Price deviations from the 50-dma (middle right panel) remain very extended, suggesting this correction may have more work to do. However, most sectors and markets are now extremely OVERSOLD, providing a decent possibility of a reflexive rally next week. Use rallies to reduce risk.
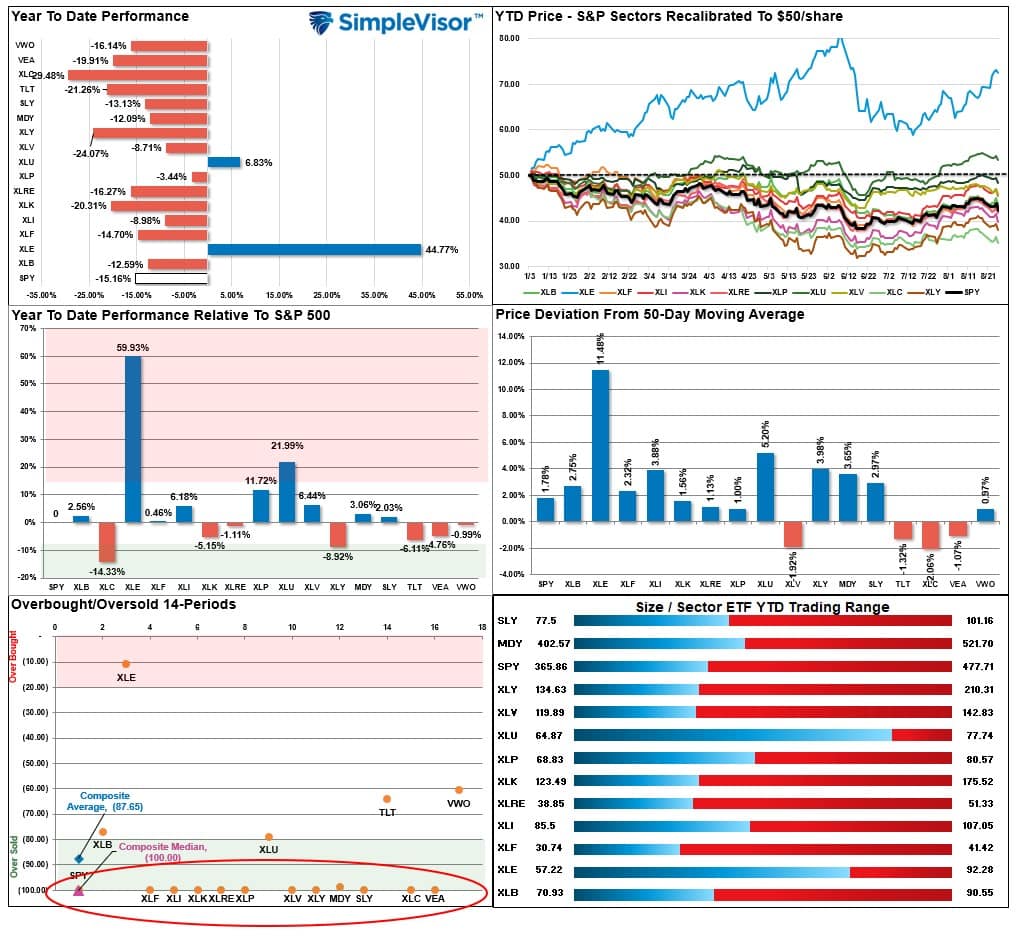
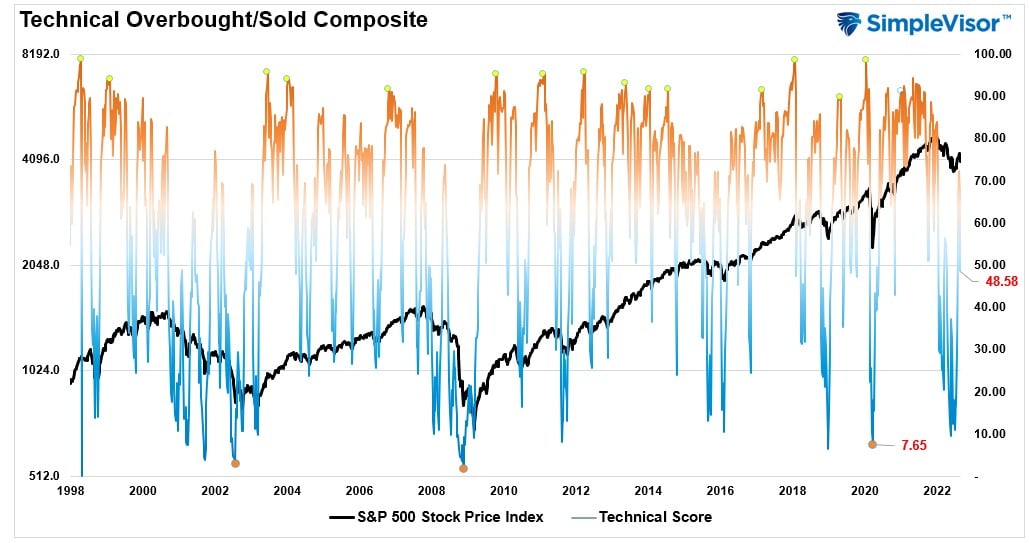
Technical Composite
The technical overbought/sold gauge comprises several price indicators (RSI, Williams %R, etc.), measured using “weekly” closing price data. Readings above “80” are considered overbought, and below “20” are oversold. Markets tend to peak when readings are at 80 or above, which suggests profit taking and risk management are prudent. The best buying opportunities exist when readings are 20 or below.
The current reading is 48.58 out of a possible 100 and rising. Remain long equities for now.
Portfolio Positioning “Fear / Greed” Gauge
The “Fear/Greed” gauge is how individual and professional investors are “positioning” themselves in the market based on their equity exposure. From a contrarian position, the higher the allocation to equities, to more likely the market is closer to a correction than not. The gauge uses weekly closing data.
NOTE: The Fear/Greed Index measures risk from 0 to 100. It is a rarity that it reaches levels above 90. The current reading is 56.68 out of a possible 100.

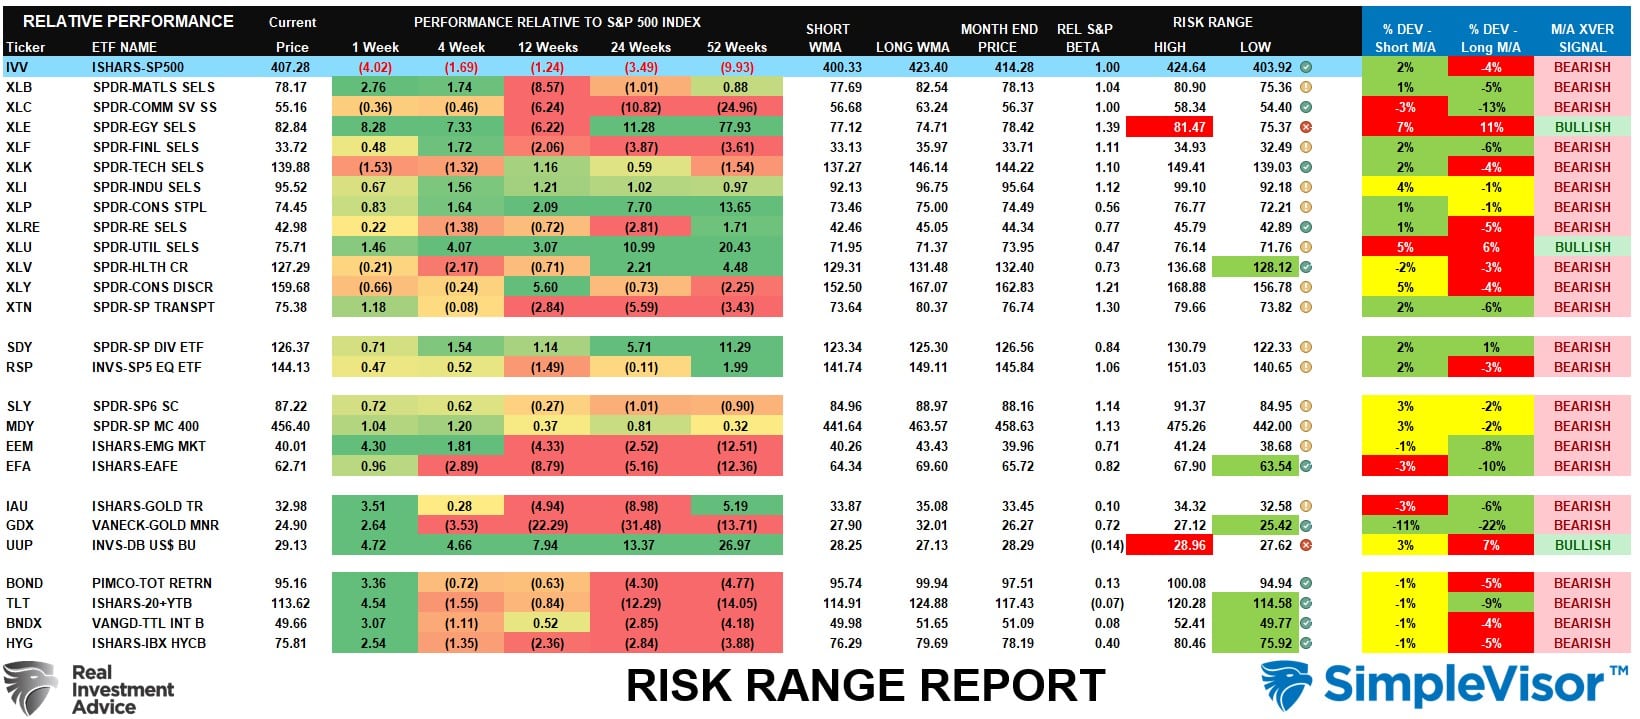
Sector Model Analysis & Risk Ranges
How To Read This Table
- The table compares the relative performance of each sector and market to the S&P 500 index.
- “M/A XVER” is determined by whether the short-term weekly moving average crosses positively or negatively with the long-term weekly moving average.
- The risk range is a function of the month-end closing price and the “beta” of the sector or market. (Ranges reset on the 1st of each month)
- The table shows the price deviation above and below the weekly moving averages.
The week before last, we stated that with “just two weeks into the month, many markets and sectors are trading well above their historical monthly trading ranges. Such usually is not sustainable.” We suggested a pullback was likely this week from that analysis. It is worth noting that Communications, Gold Miners, and Bonds (TLT) are trading at double-digit percentage deviations from the long-term weekly means. Historically, such has provided excellent long-term entry points into assets, although it may take some time for the thesis to play out.
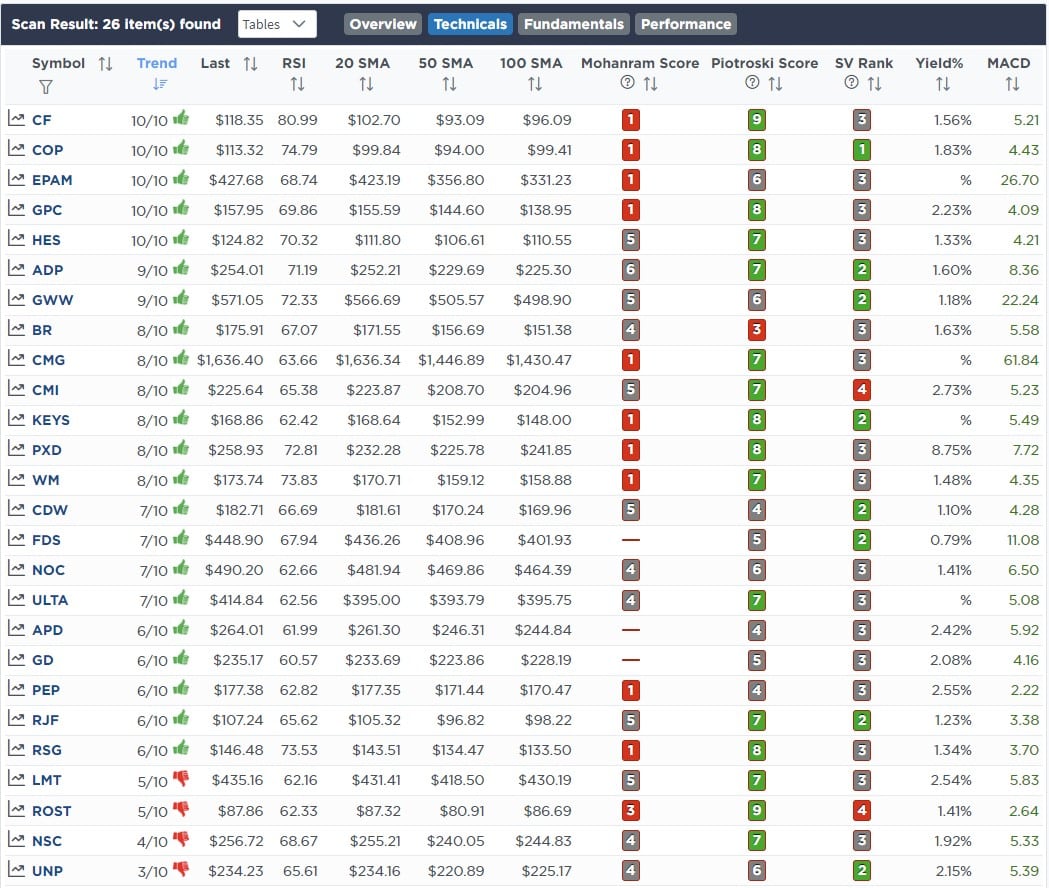
Weekly SimpleVisor Stock Screens
Each week we will provide three different stock screens generated from SimpleVisor: (RIAPro.net subscribers use your current credentials to log in.)
This week we are scanning for the Top 20:
- Relative Strength Stocks
- Momentum Stocks
- Technically Strong With Strong Fundamentals
These screens generate portfolio ideas and serve as the starting point for further research.
(Click Images To Enlarge)
RSI Screen
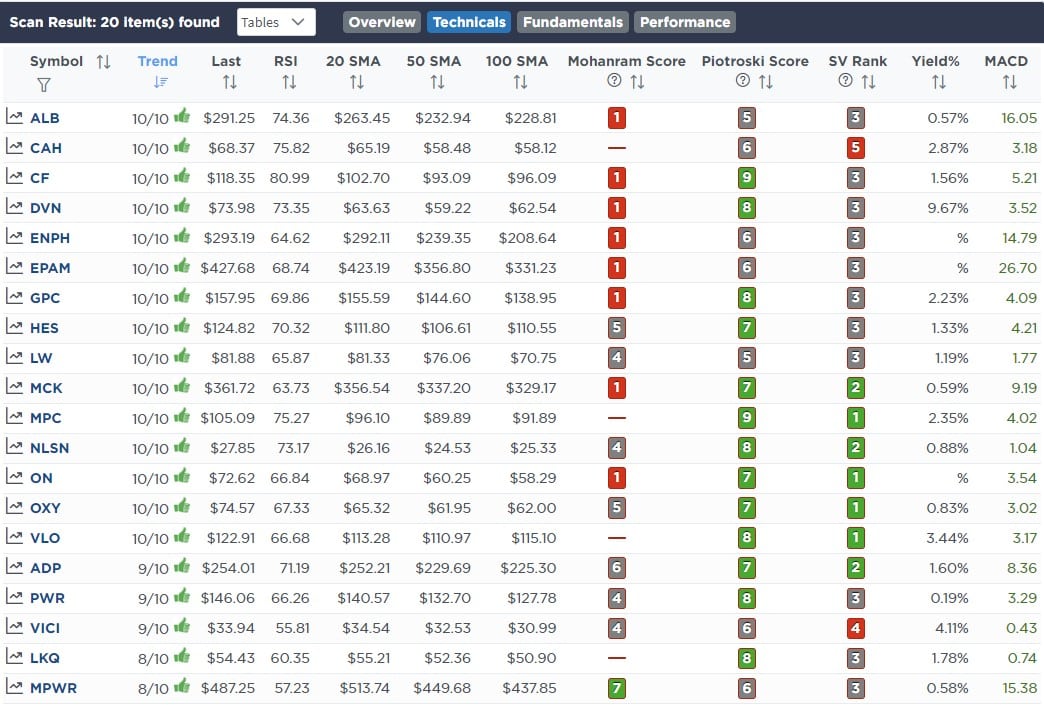
Momentum Screen

Technical & Fundamental Strength Screen
SimpleVisor Portfolio Changes
We post all of our portfolio changes as they occur at SimpleVisor:
Aug 23rd
“This morning we added to our energy position in both models. After selling energy stocks when crude was north of $120, we started adding back a month ago and are adding more today as the price looks to rebound.
Further supporting our view, OPEC has started chirping about low prices, and rumors are floating that they may start discussing production cuts.
“Extreme volatility and lack of liquidity mean the futures market is increasingly disconnected from fundamentals and OPEC+ may be forced to cut production. The paper and physical markets have become increasingly more disconnected,” – Saudi Arabia’s Energy Minister Prince Abdulaziz bin Salman
Working against higher energy prices is the steady release of oil from the strategic reserves.”
Equity Model
- Increased XOM to 2.5% of the portfolio.
- Increased DVN to 3% of the portfolio.
ETF Model
- Sold 100% and took profits in XOP
- Increased XLE to 5% of the portfolio.

Lance Roberts, CIO
Have a great week!


Lance Roberts is a Chief Portfolio Strategist/Economist for RIA Advisors. He is also the host of “The Lance Roberts Podcast” and Chief Editor of the “Real Investment Advice” website and author of “Real Investment Daily” blog and “Real Investment Report“. Follow Lance on Facebook, Twitter, Linked-In and YouTube
Customer Relationship Summary (Form CRS)