


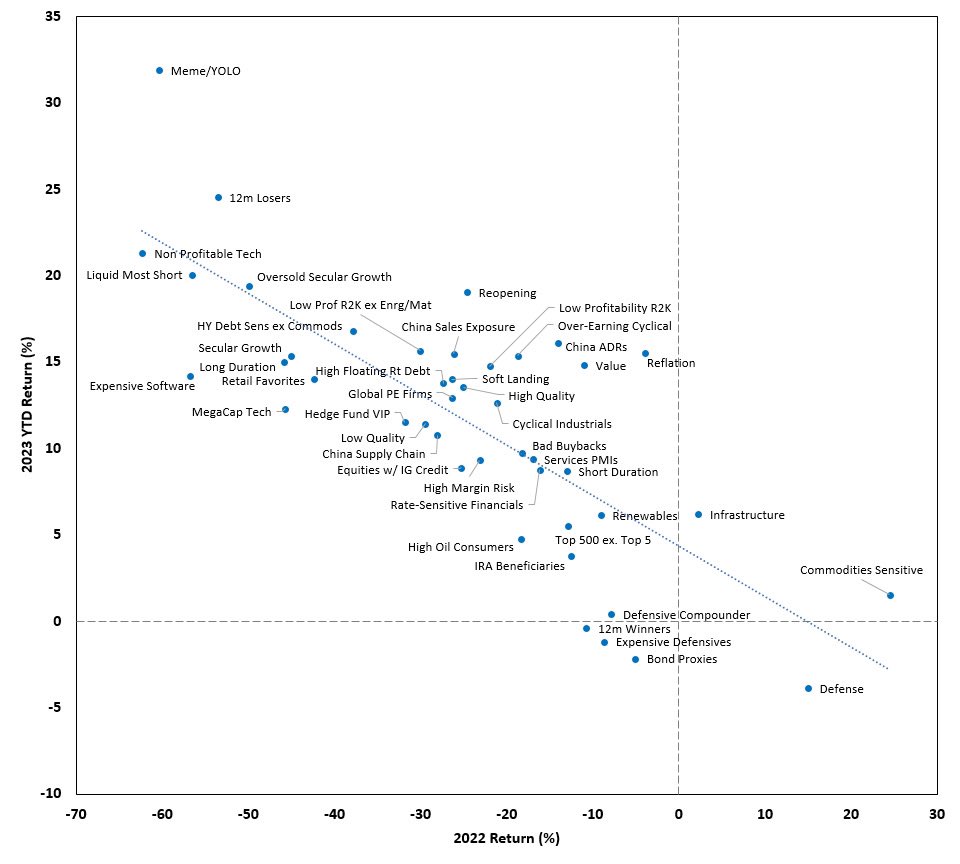
The scatter plot below compares various stock factor returns for 2022 and 2023, year to date. The winner this year by a long shot is last year’s loser, Meme stocks. In 2022, Meme stocks were the second worst performing factor, giving up approximately 60%. Meme stocks and last year’s other worst performing stocks are predominantely poor quality companies with negative earnings. In some cases, they do offer tremendous growth potential, but in many instances, they are just popular on stock trading chat rooms like Reddit. For example, the most widely followed Meme stocks include: Game Stop (GME), Bed Bath & Beyond (BBBY), and AMC Entertainement (AMC). After posting significant price gains in the first few weeks, all three stocks have fallen rapidly over the last week.
The bottom right of the graph shows last year’s winners, like conservative, lower-beta “defense” companies and commodity stocks, are this year’s losers. Looking ahead, the plot below may likely provide a road map for investors. If the recent bullish run continues, Meme stocks and other high growth, poor quality stocks may lead the way. Conversely, if a recession occurs and stocks head toward last year’s lows, the stable, defensive sectors may likely be the right place to seek shelter.
What To Watch Today
Economy
- 6:00 a.m. ET: NFIB Small Business Optimism, January (91.0 expected, 89.9 prior)
- 8:30 a.m. ET: Consumer Price Index, month-over-month, January (0.5% expected, -0.1% prior)
- 8:30 a.m. ET: CPI Excluding Food and Energy, month-over-month, January (0.4% expected, 0.3% prior)
- 8:30 a.m. ET: Consumer Price Index, year-over-year, January (6.2% expected, 6.5% prior)
- 8:30 a.m. ET: CPI Excluding Food and Energy, year-over-year, January (5.5% expected, 5.7% prior)
- 8:30 a.m. ET: Real Average Hourly Earnings, year-over-year, January (-1.7% prior, revised to -1.5%)
- 8:30 a.m. ET: Real Average Weekly Earnings, year-over-year, January (-3.1% prior, revised to -2.6%)
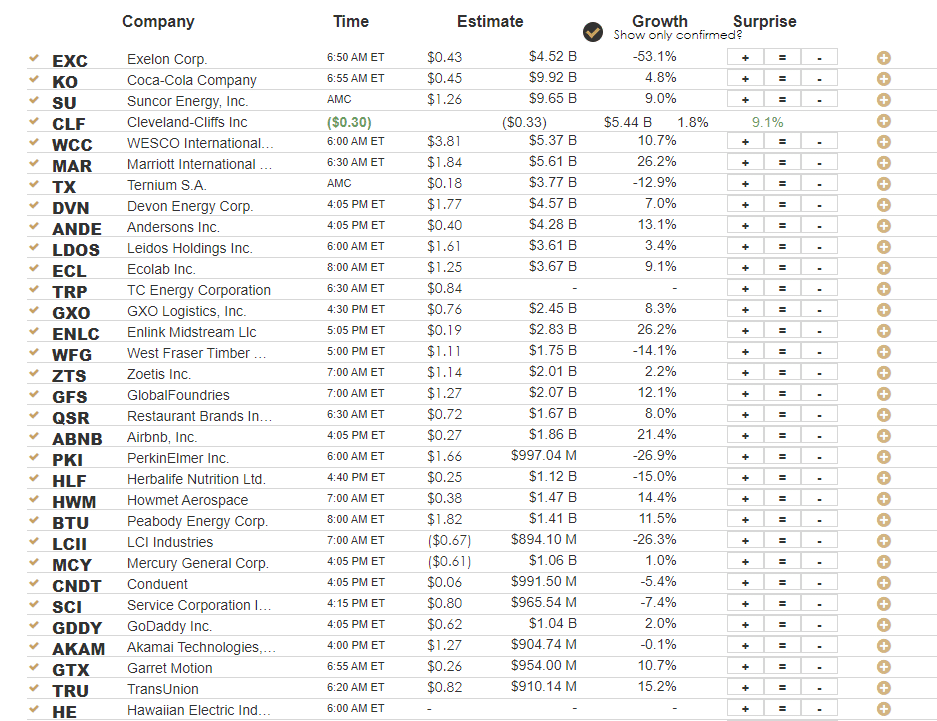
Earnings
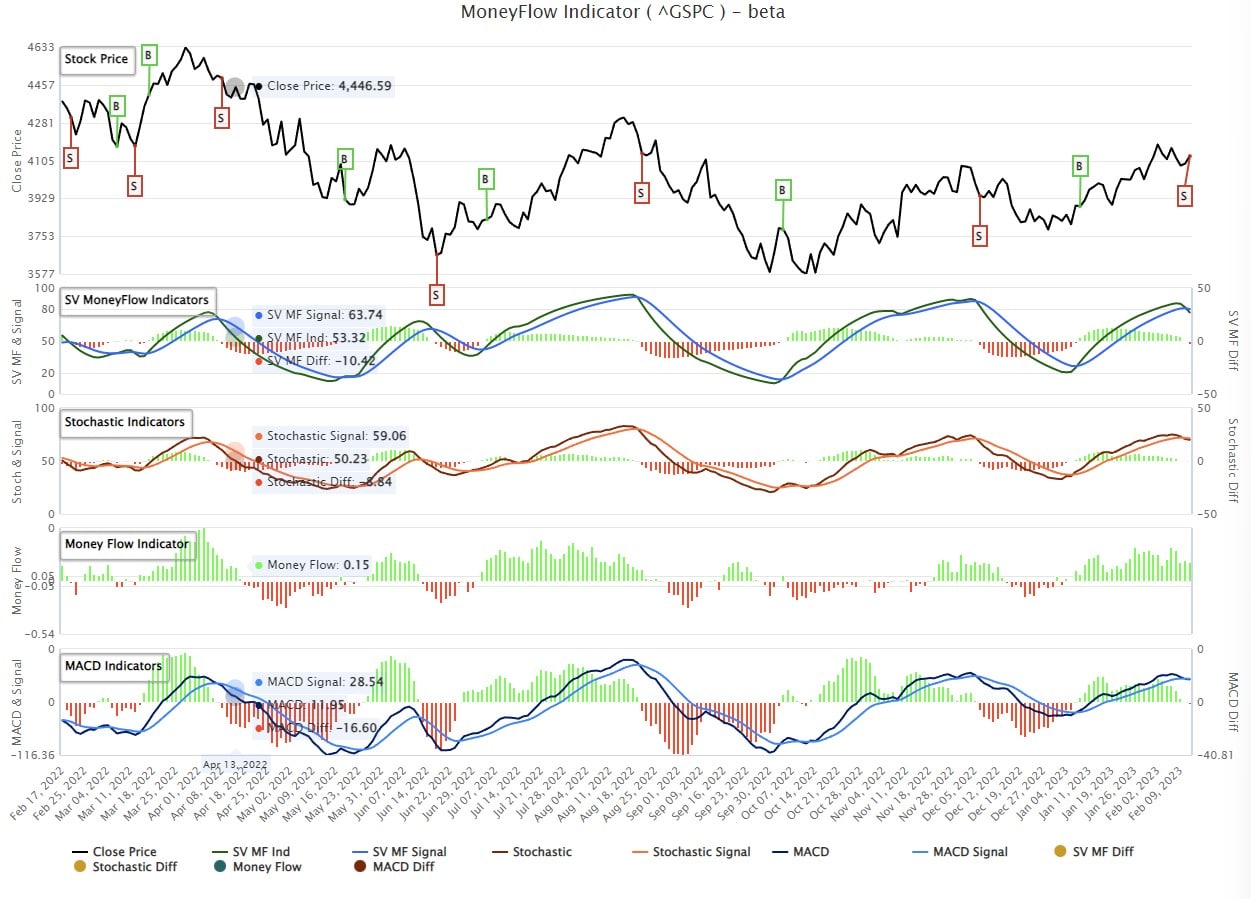
Market Trading Update
Despite yesterday’s rally ahead of inflation print, our money-flow “sell signal” triggered yesterday, suggesting that asset prices will trade somewhat lower over the next couple of weeks. While a sharp market rally could reverse the signal temporarily, it is at a very high level and will need to decline before the next strong buying opportunity is available.
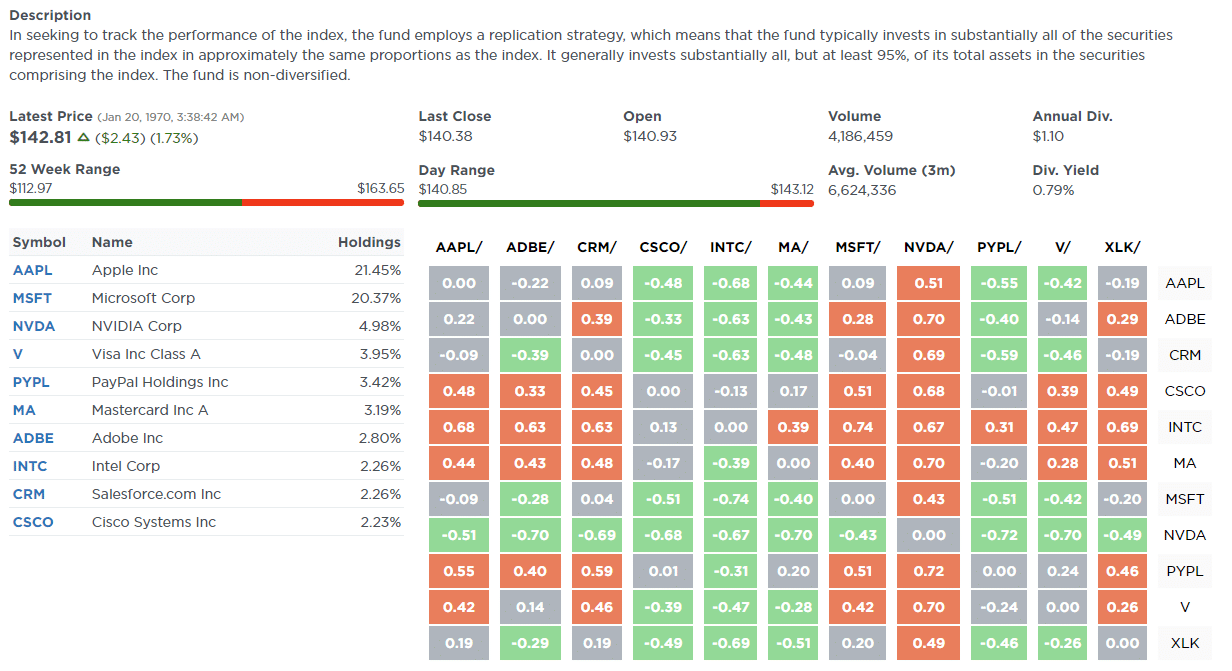
As such, we recommend taking profits in overbought areas of the market and potentially adding to oversold for a defensive rotation. Those sectors can be seen on our Relative Analysis page on SimpleVisor.
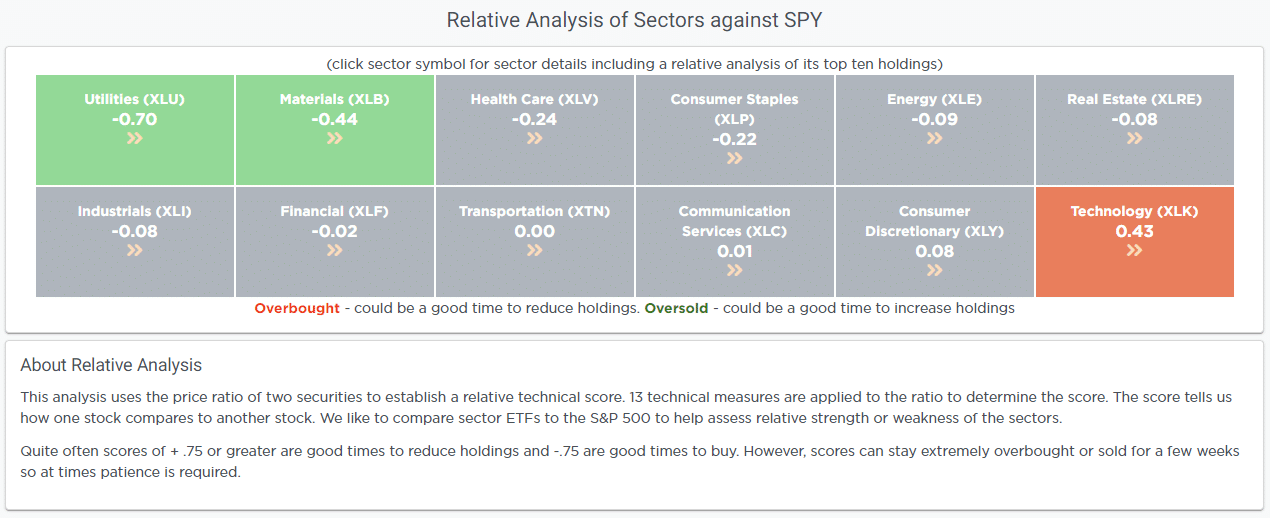
Clicking on one of the boxes will display the relative analysis of the top 10 holdings of the sector. For example, Technology is overbought, and Utilities and Materials are oversold. Therefore, it may be a good opportunity to trim companies like Nvidia (NVDA), which is extremely overbought relative to the market and most of its peers.
While in the short-term, there is momentum behind the market, there is also a limited amount of upside for now.
Consumer’s Financial Situation
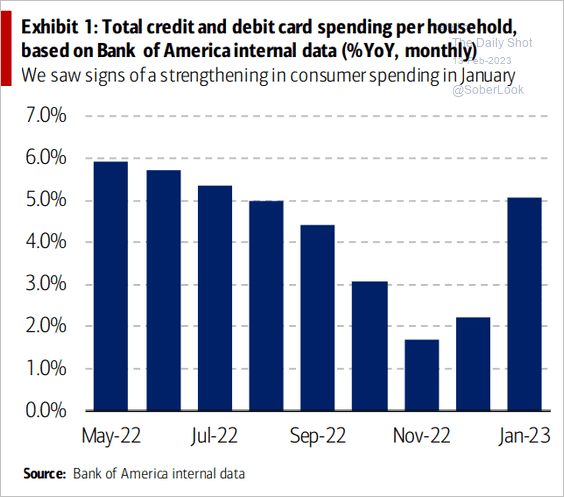
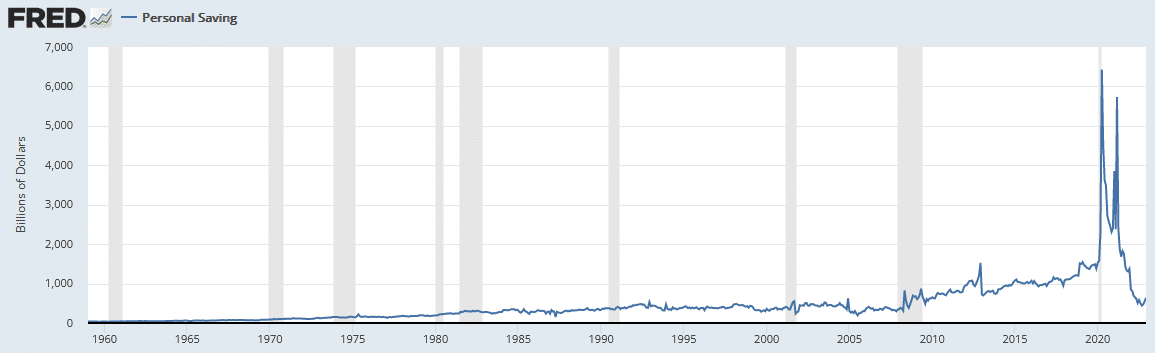
Using their internal credit card data, Bank America shows that household credit card spending rose sharply in January after a few weaker months. Heavy usage of credit card debt can be viewed in different lights. From a glass-half-full perspective, consumers must feel good about their financial prospects, given they increased their spending in January. The glass-half-empty crowd counters that many consumers struggle to keep up with inflation. As such, they rely on credit card debt to stay afloat. Keep in mind the amount of personal savings is now at a ten-year low. Many consumers have no more savings and must increasingly rely on credit cards.
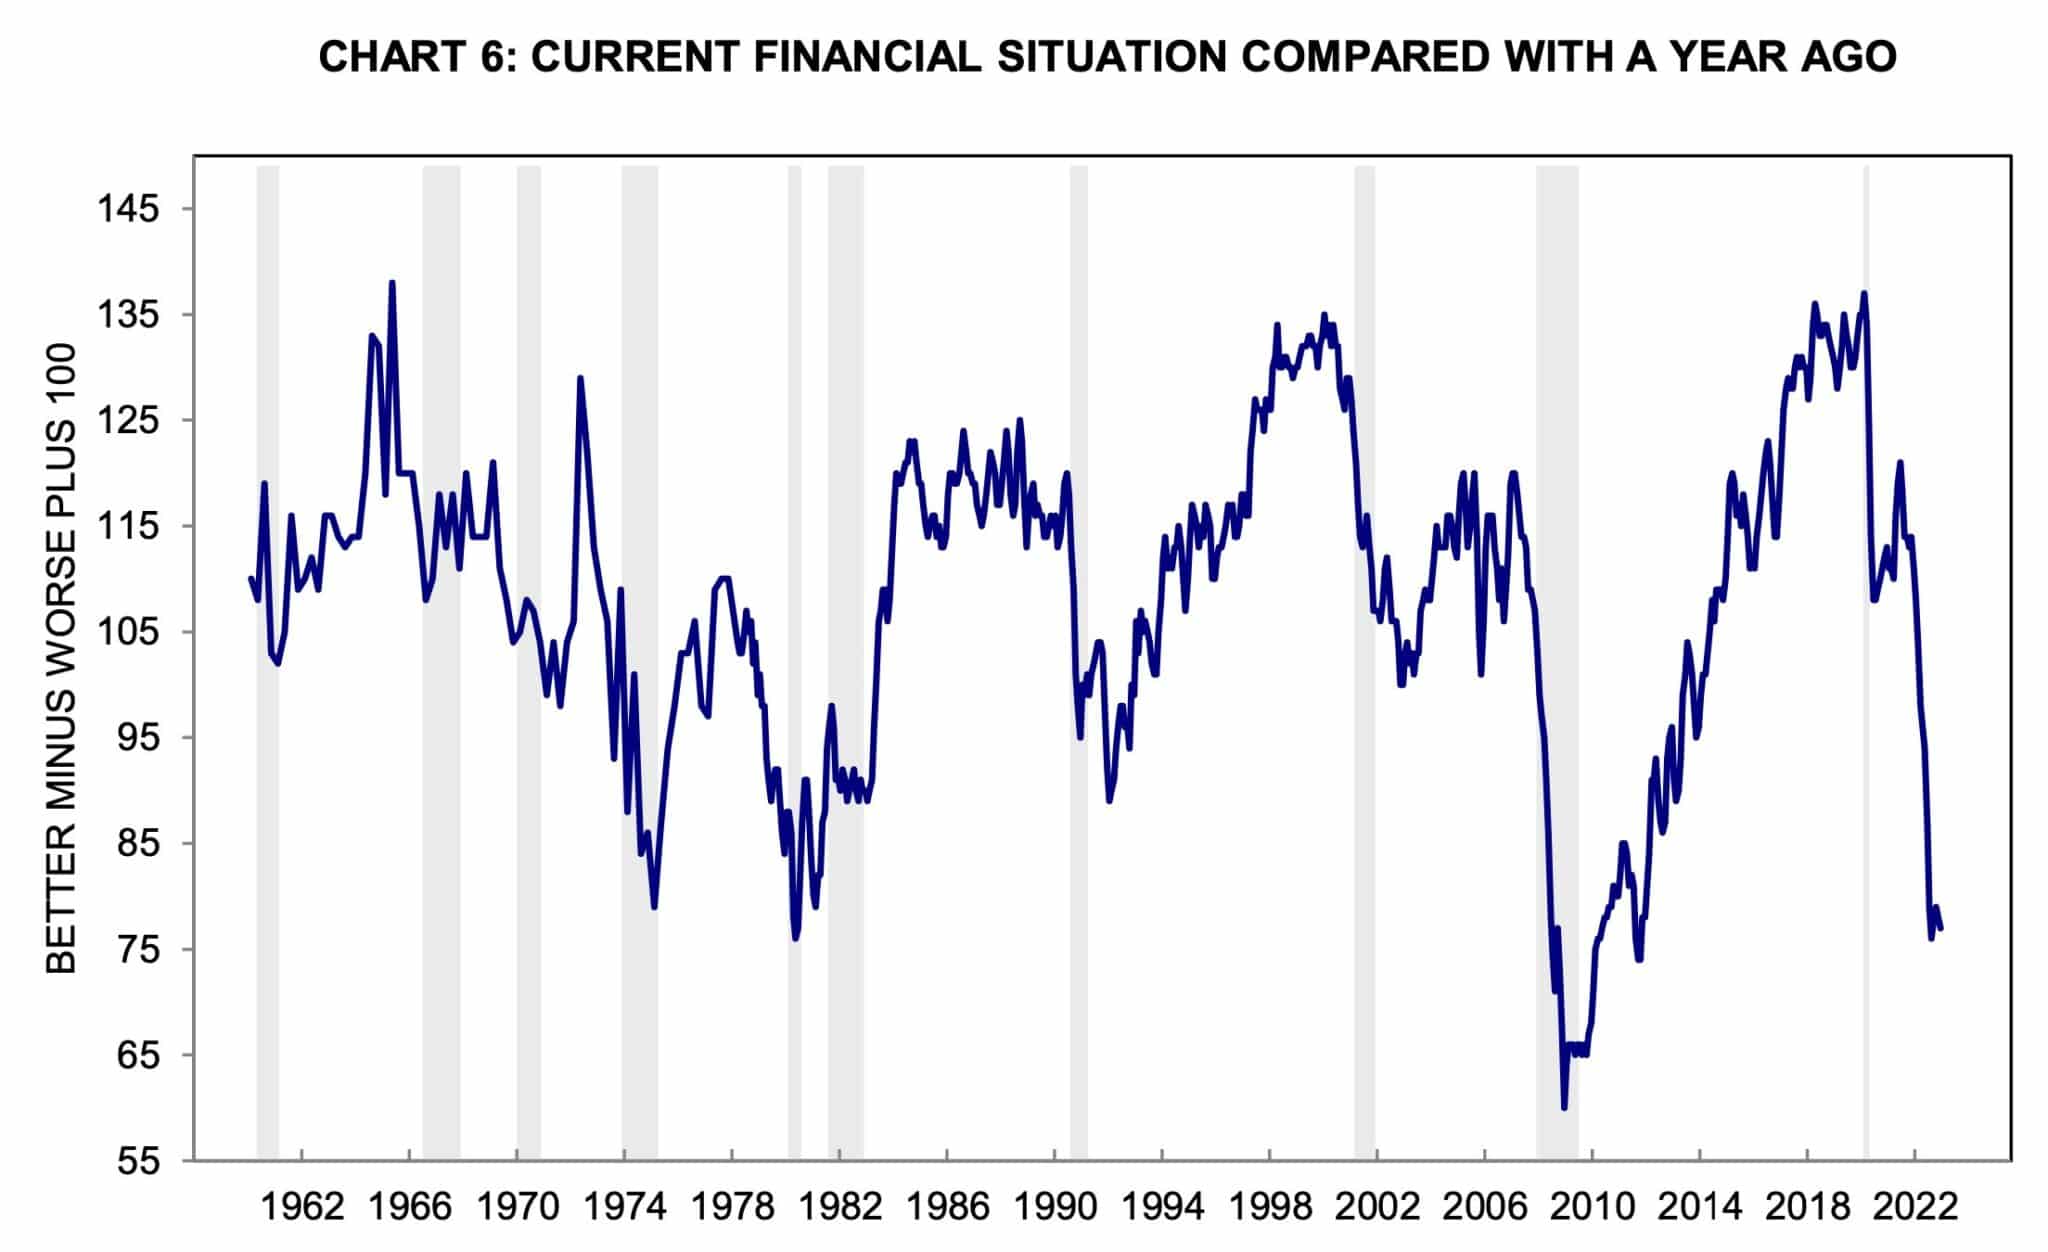
The third graph further helps inform us of the state of consumers. Last week’s University of Michigan survey asks individuals how their current financial situation compared to a year ago. Most of those surveyed consider themselves worse off. The survey, like the amount of personal savings, is at its lowest since the 2008 financial crisis.
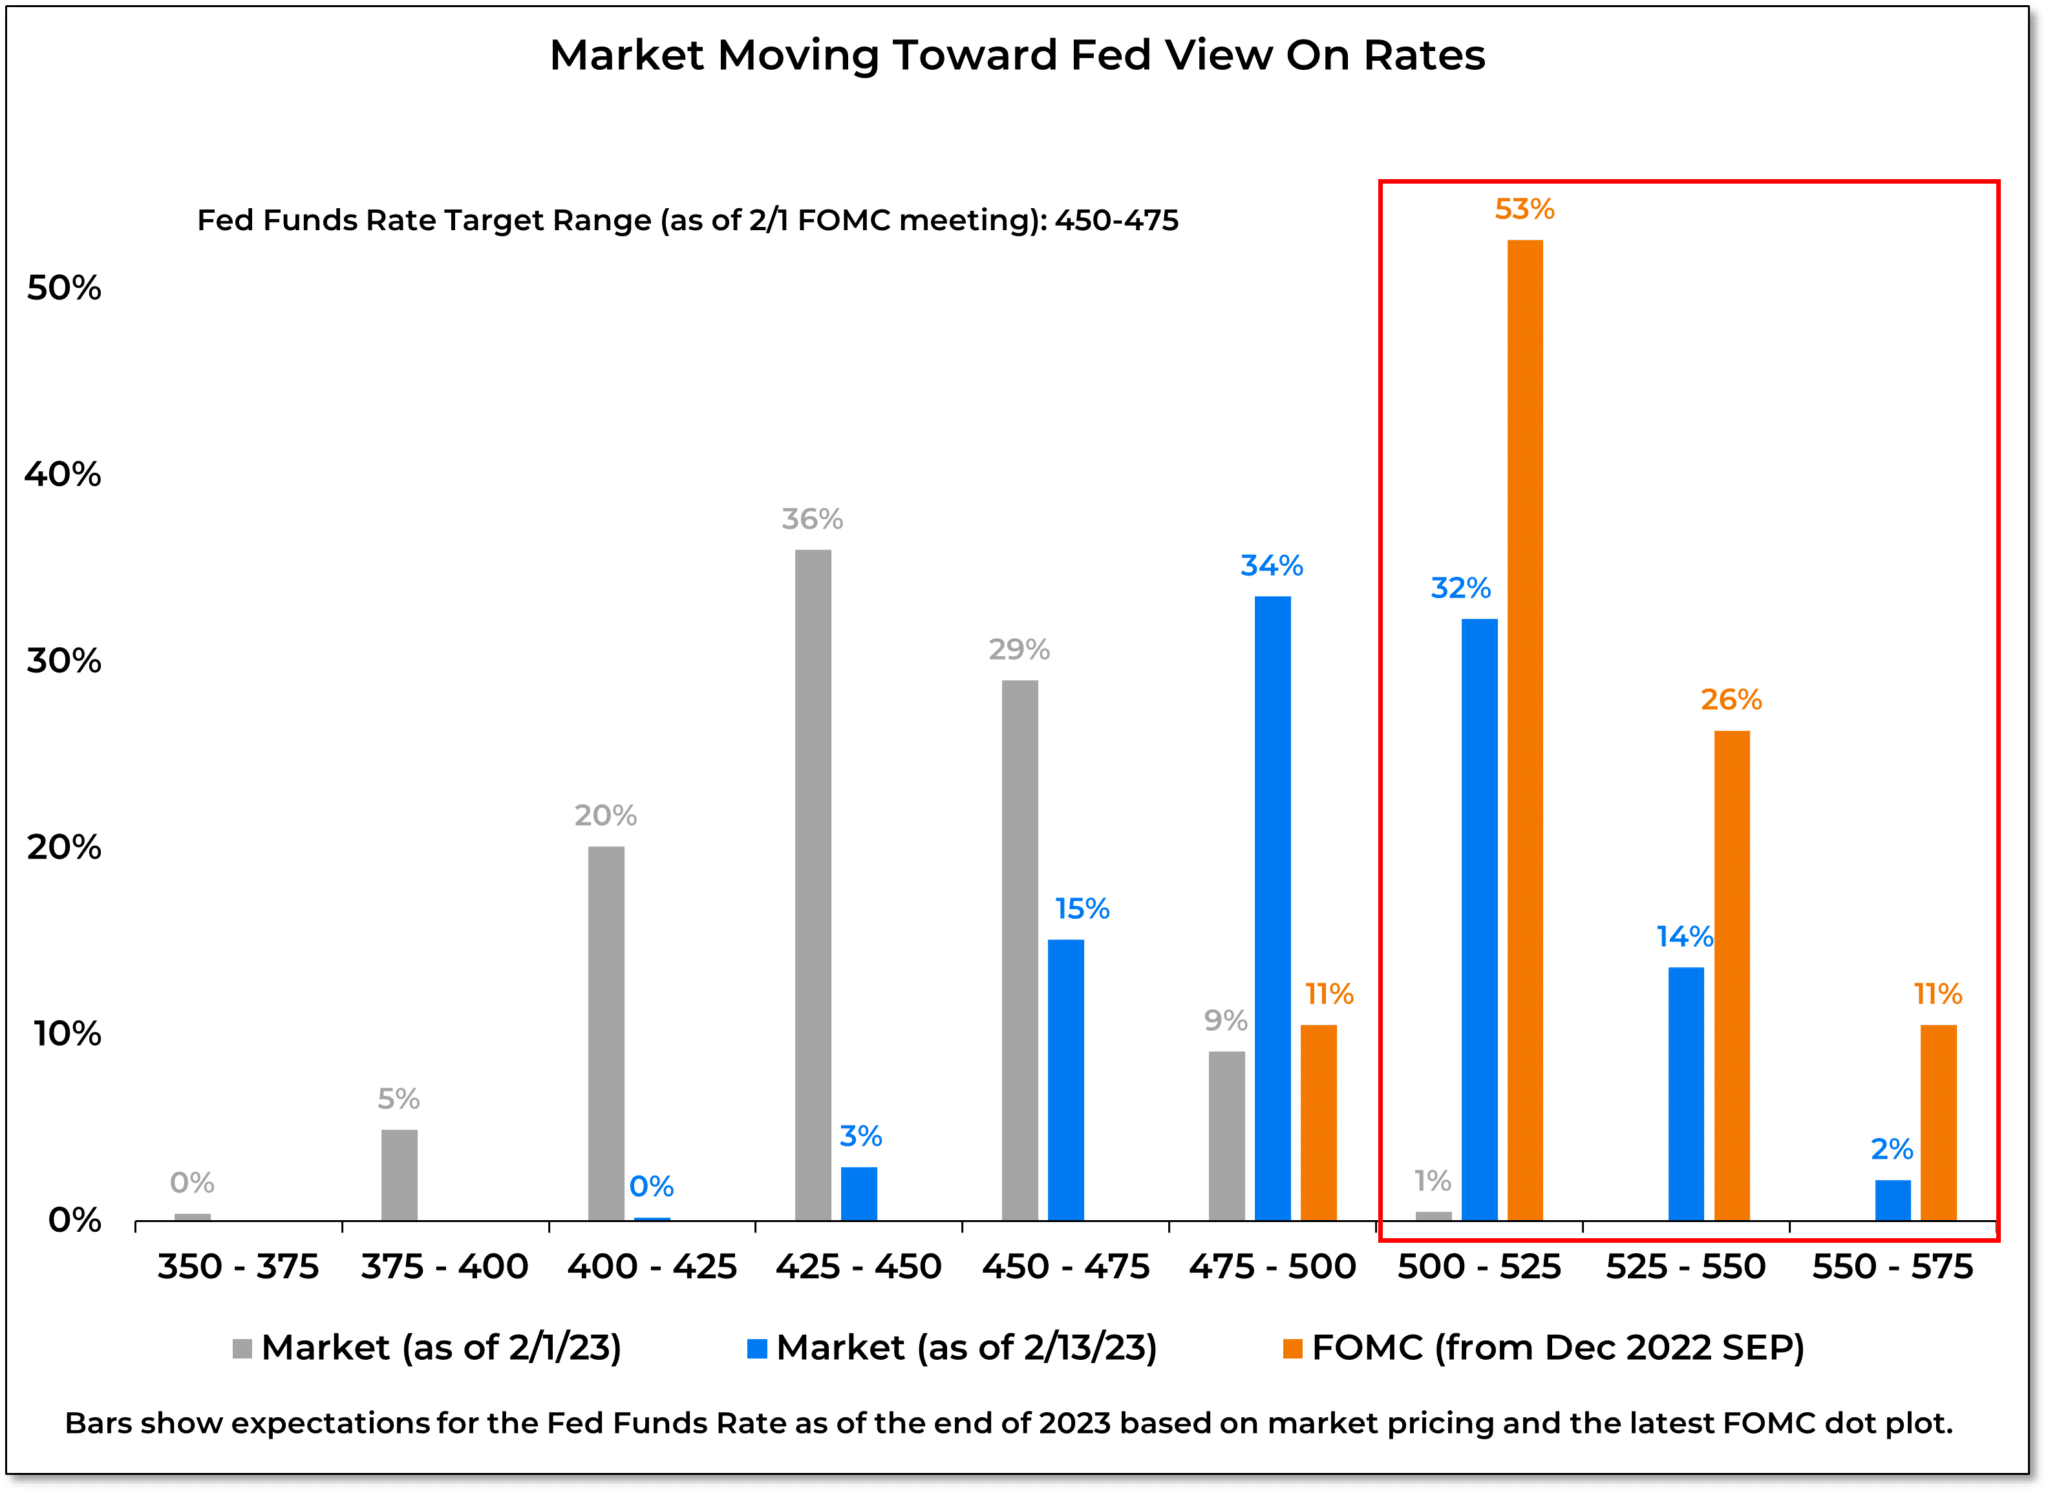
Yield Curves Inverting Further
Last year ended, and this year started with a divergence of views on where interest rates were headed. In mid-December, the Fed projected to increase Fed Funds to around 5.25% by the summer and keep them there for the year. The market’s implied they might get near 5% by mid-year and then lower them by half a percent by year-end. The gap in projections has closed. The first graph below from Willie Delwhiche shows the transition from gray to blue, denoting the market’s new higher rate outlook. As a result, short maturities rose more in yield than longer maturities, and the yield curve inverted to a new 40+ year low, as shown in the second graph.


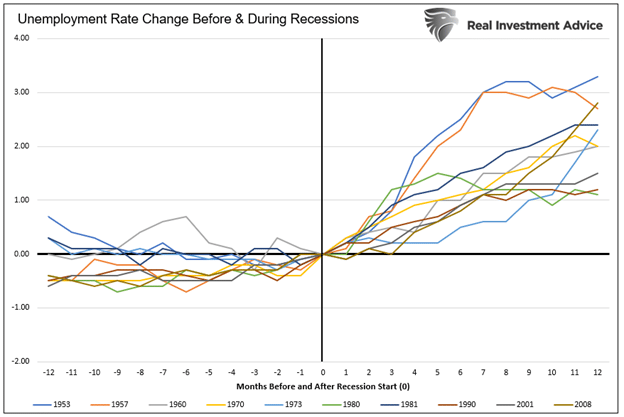
Stocks and Unemployment
The unemployment rate sits at a 53-year low. One would think that would signify a great time to buy stocks. The problem with such a theory is that the unemployment rate tends to reach its lowest point in economic cycles right before recessions. Therefore a low unemployment rate is often the worst time to buy stocks. The first graph below shows that over the past ten recessions, unemployment spikes when recessions begin. As the second bar graph shows, the time to buy stocks is not when an economy is headed into recession and unemployment is very low but when unemployment peaks.

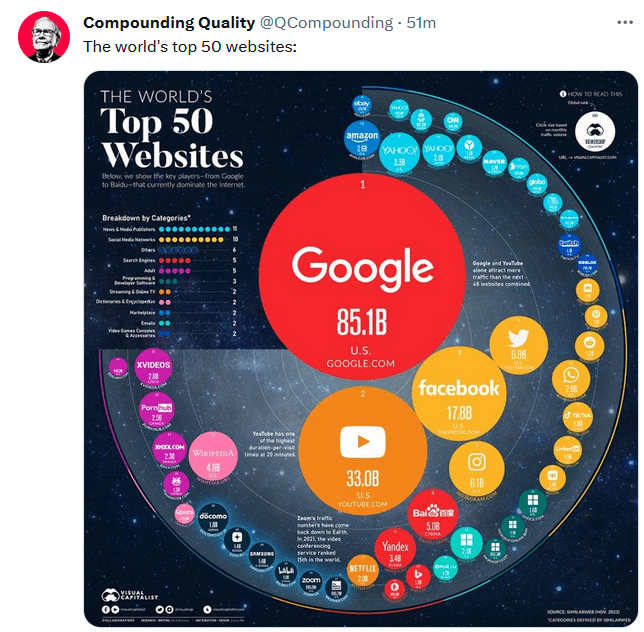
Tweet of the Day
Please subscribe to the daily commentary to receive these updates every morning before the opening bell.
If you found this blog useful, please send it to someone else, share it on social media, or contact us to set up a meeting.