


Michael Markowski has been involved in the Capital Markets since 1977. He spent the first 15 years of his career in the Financial Services Industry as a Stockbroker, Portfolio Manager, Venture Capitalist, Investment Banker and Analyst. Since 1996 Markowski has been involved in the Financial Information Industry and has produced research, information and products that have been used by investors to increase their performance and reduce their risk. Read more at BullsNBears.com
Investors must embrace the bear. A savvy investor or advisor can generate significantly more profits from a secular bear, than a secular bull. It’s also much easier to predict the behavior of a wild and vicious bear than a domesticated bull.
The new 2020 secular bear is the first for which an investor can utilize an inverse ETF (Exchange Traded Fund) to invest in a bear market from start to finish. The share price of an inverse ETF increases when a market goes down. The first inverse ETFs were invented in 2007. The new ETFs enabled investors to make significant profits at the end of the 2000 to 2009 secular bear market. The chart below depicts the gains for the Dow’s inverse ETF before and after Lehman went bankrupt in 2008.

The increased volatility caused by the secular bear can be leveraged by algorithms which had not been utilized in prior bear markets. Two of my algorithms have the potential to produce substantial gains:
- Bull & Bear Tracker (BBT)
From April 9, 2018, and through February 29, 2020, the Bull & Bear Tracker (BBT) trend trading algorithm which trades both long and inverse ETFs produced a gain of 77.3% vs. the S&P 500’s 14.9%. March of 2020 will be the BBT’s 9th consecutive profitable month.
The Bull & Bear Tracker thrives on market volatility. The algorithm’s best performance days since the inception of the signals have been when the markets are most volatile.

- SCPA (Statistical Crash Probability Analysis)
The SCPA is a crash event forecasting algorithm. The algorithm has been very accurate at forecasting the crash of 2020’s events. The SCPA’s forecast that the market had reached a bottom on March 23rd was precisely accurate. From 03/23/20 to 0/3/26/20, the Dow had its biggest one-day gain (11.4%) and three-day percentage gain (21.3%) since 1929 and 1931, respectively. Those investors who purchased the Dow’s long ETF (symbol: DIA) by close of the market on March 23, 2020, after reading “Probability is 87% that market is at interim bottom” which was published during market hours, had a one day gain of 11% at the close of the market on March 24, 2020.

The SCPA’s future event forecasts throughout the life of the crash of 2020 are being utilized to trade long and inverse ETFs until the US markets reach their final bottoms in the fourth quarter of 2022. Had the SCPA and inverse ETFs been available to trade the SCPA’s forecasts in 1929, savvy investors would have made more than 572% from December of 1929 through July of 1932. There were 14 Bear market rallies with average gains of 17%. The rallies were followed by 14 declines which averaged 23%. could have produced average gains of 23% for inverse ETF investors.

Both the Bull & Bear Tracker (BBT) and SCPA complement each other. The BBT predicts market volatility before it increases. The SCPA forecasts the percentage increases for the bear market rallies and the percentage declines from the bear rally highs. My prediction is that the utilization of both of the algorithms will reduce the failed signals ratio for the Bull & Bear Tracker.
Based on the findings from my recently completed empirical research of the Dow’s best rallies from 1901 to 2020, the markets will remain extremely volatile for the foreseeable future.
The Truth About The Biggest One Day Jump Since 1933
The Wall Street Journal’s “Dow Soars More Than 11% in Biggest One-Day Jump Since 1933” was inaccurate. It should have read since “1929”. The article should have been about the Dow Jones industrials composite index having its best one day and three-day percentage gains since 1929 and 1931 respectively.
The gain of 21.3% for the Dow’s three-day rally that ended on March 26th was the index’s second best since 1901. The one-day gain of 11.4% on March 24th ranks as the Dow’s fourth best day since 1901. To understand the significance of the error read on.
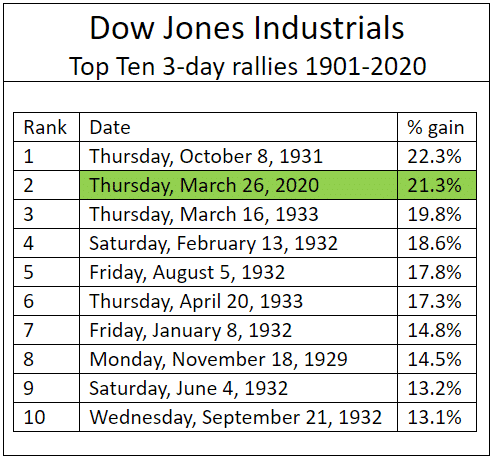
Nine of the top ten three-day percentage gainers occurred during the first four years of the 1929 to 1949 secular bear market. The Five rallies which occurred before the 1929 crash reached its final bottom on July 8, 1932 all failed. Their post rally declines ranged from 19% to 82%.
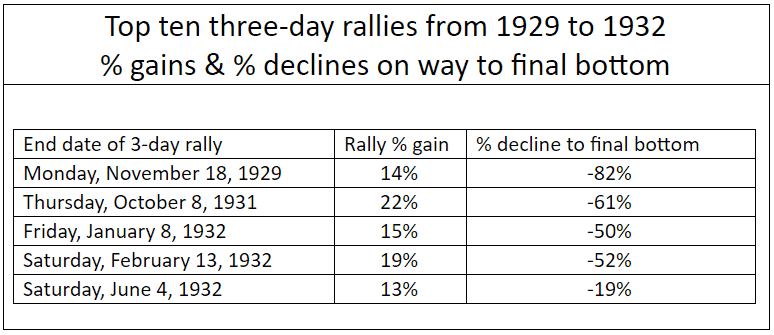
Six of the 10 biggest daily percentage increases in the table below for the Dow over the last 120 years occurred from 1929 to 1933. There were two 2008 secular bear market rallies, October 13 and 28, 2008 among the top ten one day wonders. The losses for both of the one-day 2008 rallies at the March 2009 were 31.1% and 28.7% respectively.
Of the 100 best percentage gain days for the Dow since 1901, 29 of them occurred between the post 1929 crash and the final July 1932 bottom. From the 1932 bottom to the end of 1933 accounted for an additional 23 of the 100 best days. All of those rallies were profitable. From the low to the end of 1933, the Dow increased by more than 100%. The only other period or year which had concentrated representation in the top 100 was 2008 which had seven.

The Wall Street Journal’s error is significant since 100% of the top 100 best one day rallies from:
- October 1929 to July 1932 resulted in significant losses
- July 1932 bottom to end of 1933 resulted in significant gains
The error has created a false sense of security for investors and especially for investment professionals, who are aware that after the 1929 crash, the Dow bottomed in 1932. Had the performance for the Dow’s performance cited in the headline been compared to 1929, the context of the article would have been very bearish instead of somewhat bullish.

From my preliminary empirical research findings there were only seven bull market rallies within the top 100 one day percentage gainers. Three of seven in the table below were represented by 1987 and two by 2009.

The three post 1987 “Black Monday’ crash rallies enabled the secular bull which began in 2002 to resume. To understand why it’s not possible for the secular bull which began in 2009 to resume read my two March 2020 articles below. The 1987 crash does not share the genealogy of the Dow 1929, NASDAQ 2000 and the 2020 crashes for the markets of the US, Japan, Germany, Canada, France and South Korea which are now underway.
- “US Stock Market to decline by another 22% by Easter”, March 6, 2020
- “Probability is 87% that market is at interim bottom”, March 23, 2020
Based on the findings from my empirical research the probability is 94.4% (17/18) that the Dow 2020’s one day and three-day top ten percentage gainers last week were bear market rallies.
Many are hopeful that the crash which has been underway since February 20, 2020, is just a correction for the continuation of the secular bull market which began in 2009. Based on my just concluded empirical research of the Dow’s best daily and three-day gains and my previous findings from my prior statistical crash probability analysis, the rationale is in place for the markets to continue to crash. My deep fear is that the world is on the verge of a 1930’s style economic depression.
Everyone should take advantage of the Bear market rally that is currently underway to exit the market as soon as possible.
- According to the Statistical Crash Probability Analysis (SCPA) forecast the probability is 100% that the relief rally high has either already occurred or will occur by April 8, 2020.
- The probability is the same for the markets of the six countries to make new lows by April 30, 2020.
For more about the SCPA click here for access to all of my 2020 crash related articles. To view the SCPA’s very accurate track record for March 2020 click here.
All mutual funds and stocks over $5.00 per share should be liquidated by April 8th. My suggestion is to utilize a methodical approach by liquidating 20% of all holdings per day from April 1st to April 8th.
The SCPA is also forecasting the probability is 100% for the coming attractions from the crash of 2020:
- Interim bottom by or before May 4, 2020
- At interim bottom market will be 41% to 44% below 2020 highs
- Post-crash high before the journey begins to final Q 4 2022 bottom will occur from June 24, 2020 to September 18, 2020.
- Post-crash highs to get market to within 17% of 2020 highs.
My only argument against the SCPA’s statistical probability analyses is can the markets get back to above, or even to their March/April 2020 post-crash relief rally highs? The simultaneous crashes in multiple markets for more than one country, let alone six countries, is historically unprecedented.
My hunch is that the damage to the markets and economies of the world’s leading developed countries will be much more severe than the damage caused by the 1929 crash. The relief rally highs could prove to be the post-crash highs.
If that proves to be the case, according to the SCPA the probability is 100% that it will take the markets a minimum of 15 years to get back above the highs already made by the relief rally and longer to get back to their post-crash highs. Additionally, the findings from my extensive research on all of the secular bear markets since 1929 further support the SCPA’s forecast.

There are only three reasons why anyone who is reading my articles would not to sell:
- Waiting to get back to break even. It’s against human nature to take losses.
- Not wanting to pay capital gains. Securities with gains can be “sold short against the box” to delay a taxable capital gain,
- Financial advisor advising otherwise. Beware of the following:
a) An advisor’s largest percentage fee that can be charged is for the amount that an investor has in stocks. If the investor is in cash the advisor can-not charge the fee.
b) The majority of financial advisors are affiliated with big brand name firms including Merrill Lynch, Morgan Stanley, Goldman Sachs and UBS, etc. These advisors have to follow the party line. They do not have the independence to get their clients out of the market even if they wanted to.
c) The financial advisor industry utilizes propaganda to get clients to remain invested during volatile periods. Read “No One Saw It Coming’ – Should You Worry About The 10-Best Days” by Lance Roberts. He is among a few of the independent advisors who I know which had his clients’ 90% out of the market.


Lance Roberts is a Chief Portfolio Strategist/Economist for RIA Advisors. He is also the host of “The Lance Roberts Podcast” and Chief Editor of the “Real Investment Advice” website and author of “Real Investment Daily” blog and “Real Investment Report“. Follow Lance on Facebook, Twitter, Linked-In and YouTube
Customer Relationship Summary (Form CRS)