


The midterm playbook still favors stocks over the next year, but the 200-day average at 7,325 decides whether that playbook starts now or after a deeper flush.
🏛️ Market Brief – The Post-Midterm Rally Lasted One Day
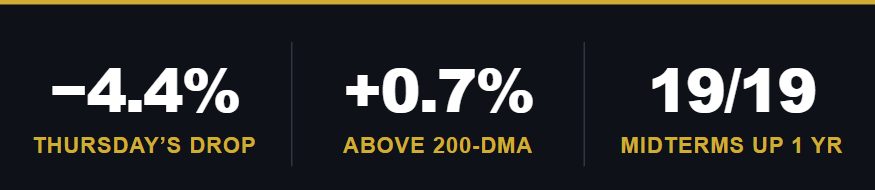
On Monday, we drew the line in the sand. As we wrote in Liquidity Weighed On Gold Trumping Real Yields, a close below 7,490 would make a test of the 200-day moving average more likely. By lunchtime Thursday, the market had blown right through that support level and tested that 200-day average. There is no way to sugarcoat Thursday’s sell-off, with the S&P 500 falling 4.4% to 7,353.73, its worst day since the April 2025 tariff crash. The Nasdaq 100 lost 6.4%. For the week, the index fell 2.7% to 7,376.86. That leaves it 5.7% below the October 6 record and up 7.8% for the year.
What makes the week so jarring is the sequence. Wednesday delivered what Fortune called the best post-midterm election rally in 44 years, with the S&P 500 up 1.6% to 7,688.62. Twenty-four hours later, roughly $3 trillion in market value was gone. The semiconductor ETF (SMH) dropped about 11% on Thursday, Micron and AMD each lost roughly 17%, and Nvidia fell 9%.
The midterm election catalysts were stacked on top of each other.. Democratic wins in Texas, Georgia, Ohio, and Michigan put roughly 45% of planned data center capacity in states likely to tighten the rules, according to Goldman Sachs. Weak results from Qualcomm and Arm hit the chip complex. Asian markets sold off overnight, and the selling spread to the power names that feed the buildout. The politics lit the match, but leverage supplied the fuel. As we noted in Friday’s commentary, Oracle Bought High, Sold Low, Goldman’s prime book showed hedge fund gross leverage near 310%, close to a five-year high, after funds lost more than 3% in October.
Thankfully, Friday brought a partial reprieve, with the market holding key technical support but just barely as the October payrolls report surprised to the upside. Employment jumped by 165,000, exceeding expectations of 65,000, and the unemployment rate fell to 4.1%. Furthermore, revisions added another 84,000 jobs to August and September, and hourly earnings rose 0.4%.
While the outcome of the midterm elections gave the market something to worry about, unfortunately, Friday’s strong labor report keeps a December rate hike in the conversation. That isn’t what a market leaning on lower rates wanted to hear.
Nonetheless, chip stocks bounced on Friday, but the market, however, managed only a 0.3% gain and faded from 7,444 to close near the session low.
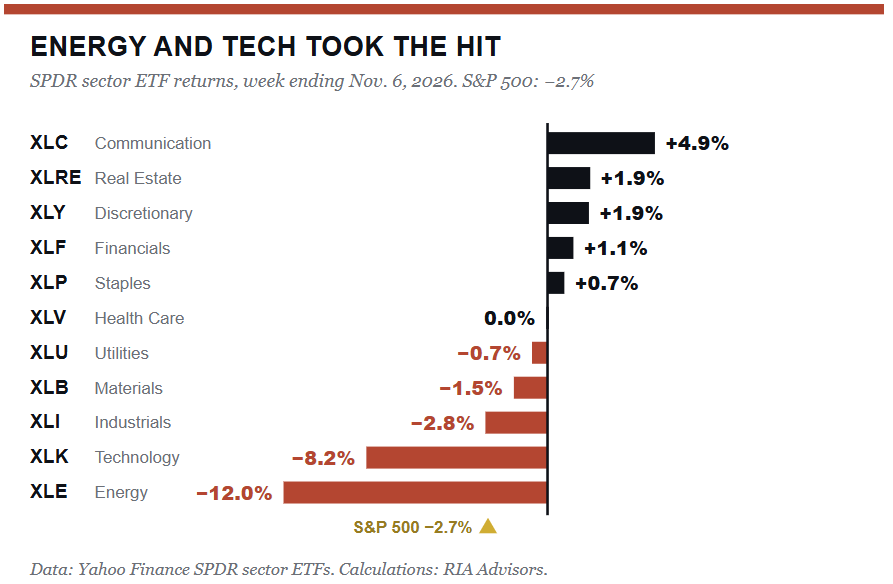
Beneath the brutal headlines, the actual selling was narrower than it felt. The equal-weight S&P 500 (RSP) beat the cap-weighted index by 1.7 percentage points. Five of eleven sectors finished higher, led by Communication Services at 4.9%. Energy was the worst performer, down 12%, as WTI crude fell 13% to $90.50 and Brent slid back below $100. Gold gained 4.5% to $4,076, and the 10-year Treasury yield eased to 4.86% from 4.93%. The VIX jumped from 19.4 to 28.2 on Thursday before settling at 25.6.
The thread to follow into next week is whether Thursday was a “liquidation event” or the start of a trend. Liquidations tend to exhaust themselves quickly, usually within a few sessions once the forced sellers are finished, the margin calls stop and the leverage that built up during the rally has been cleared out of the system. Trends don’t. Tuesday’s CPI report will tell us which way rates lean while the market sorts it out.
📈Technical Backdrop – MACD Turns Up Just Below The Record
Thursday did real technical damage. The S&P 500 closed Friday at 7,376.86, below its 20-day (7,658), 50-day (7,679) and 100-day (7,619) moving averages. It’s holding just 0.7% above the 200-day average at 7,325. The 14-day RSI sits at 35 after touching 33.5 on Thursday, and MACD has rolled into a sell signal at −61 points against a signal line of −27.
Here’s where the “buy the dip” crowd has some hope. Following the post-midterm election rally, Thursday’s close pushed the market 3.1 standard deviations below the 20-day average. That is an extreme that rarely lasts. In Friday’s commentary, we found 27 prior cases since 1950 when the index stretched this far below its 20-day average while holding above its 200-day average. One month later, the market was higher 23 times, with a median gain of 2.4%.
In other words, oversold readings with an intact 200-day average have historically produced a bounce rather than a crash.
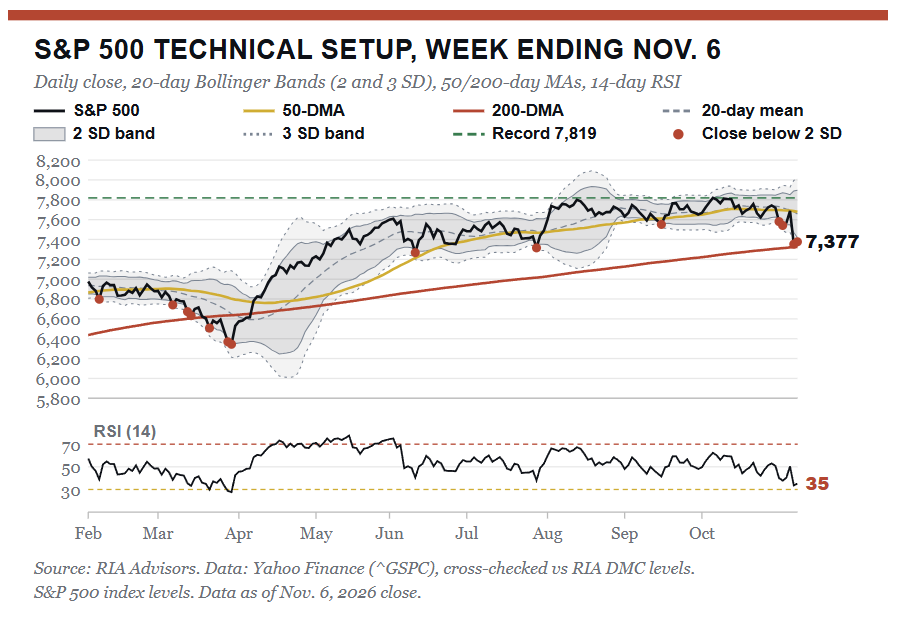
The problem is that our own rules have already spoken. On Monday, we said a close below 7,490 meant tightening stops and raising cash. On Wednesday, in Oracle Sells Cheap Stock As Its Debt Window Narrows, we said that a decisive close below $169 in the technology ETF (XLK) would have prompted us to step aside from new tech buying. XLK closed Friday at $164.74, 3.2% below its own 200-day average. While both triggers fired, that doesn’t mean we are selling everything. It means the growth tranches we laid out last week are on hold until the trend repairs.
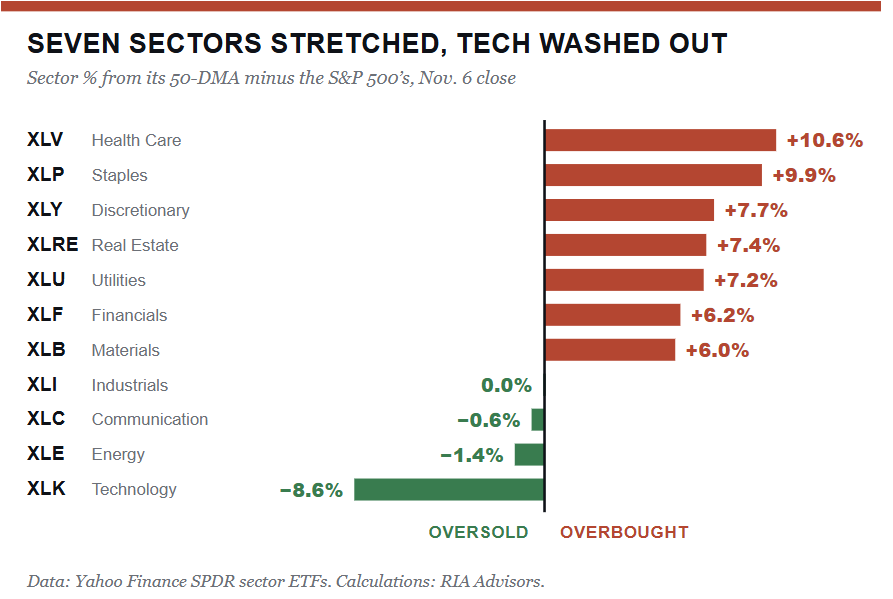
Sector breadth explains why the index held up as well as it did. Seven of eleven sectors are trading well above their 50-day averages relative to the S&P 500, led by Health Care (10.6 points), Staples (9.9), and Discretionary (7.7). Technology sits 8.6 points below with an RSI of 29, and semiconductors are 18% under their 50-day.
As we discussed Thursday in The Election Aftermath: Let The Market Finish Voting, Health Care is more than 15% above its 200-day average, a stretch seen only twice since 2005. The defensive trade is now as crowded as tech was in October. That cuts both ways. Oversold tech is where any rebound has to come from, while stretched defensives are where the next round of selling may start.
Pay close attention to Friday’s market action, as it is likely more important than you think. The index opened near 7,378, rallied to 7,444, and gave it all back into the close. Sellers are still leaning on every bounce. Use any rally toward the 7,620 to 7,680 cluster, where the 100-, 20-, and 50-day averages converge, to trim laggards, rebalance the defensive winners that have run too far, and rebuild cash.
So what does that mean for next week? Start by holding core positions at target weights, but don’t aggressively add more exposure yet. If the 200-day average holds and semiconductors reverse, the advice to add exposure in small tranches resumes. However, a decisive close below 7,316, July’s swing low, opens the door to 7,200. That violation would shift our process toward the 2018 playbook of raising cash and hedging portfolios more aggressively.
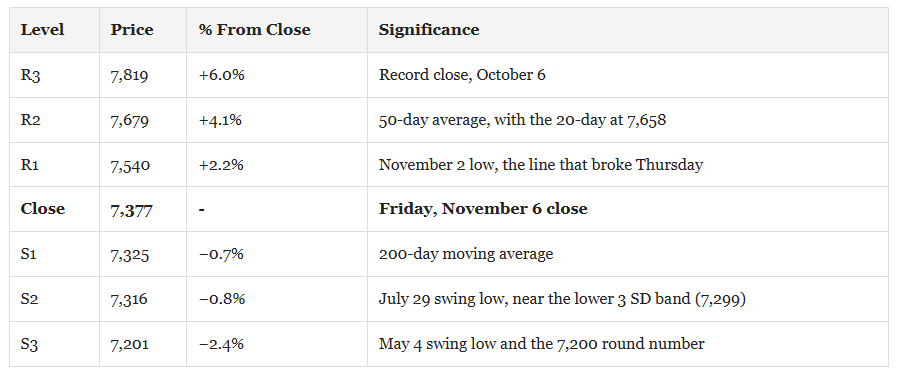
Support levels for the market matter most next week, and the 200-day average at 7,325 is crucial. If the market can hold that key support, then this past week looks like a violent correction inside a bull market. Lose it, and the conversation changes from “how high” to “how much cash.”
🔑 Key Catalysts Next Week
Next week, inflation will move the market, and, unfortunately, the timing couldn’t be any more awkward. On Tuesday, the markets will get the October CPI report, with the consensus calling for a 0.3% monthly gain. The good news is that it is half of September’s 0.6% jump, with the core reading expected at 0.2%. Friday’s PPI follows, with consensus at 0.4% after September’s 1.3% surge. After a 165,000 payroll print, a hot reading on either would push December hike odds higher just as growth stocks can least afford it.
The bond market has a heavy week too. Treasury sells 3-, 10-, and 30-year debt on Monday, Tuesday, and Thursday. The bond market closes Wednesday for Veterans Day, while stocks stay open. Thursday afternoon’s budget statement will show how October’s deficit is tracking, with consensus near $298 billion.
Fed speakers are everywhere. Vice Chair for Supervision Bowman speaks Monday, Tuesday and Friday, Chicago’s Goolsbee speaks Monday and Thursday, Governor Waller and Dallas’s Logan speak Tuesday, and Thursday brings Cleveland’s Hammack, Governor Barr, San Francisco’s Daly and New York’s Williams. Williams carries the most weight on policy. Listen for how each one weighs Friday’s jobs report against Tuesday’s CPI.
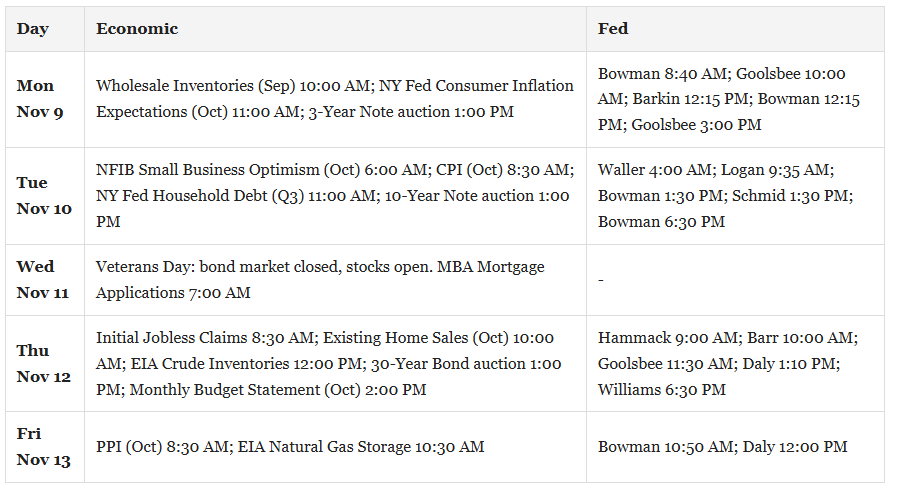
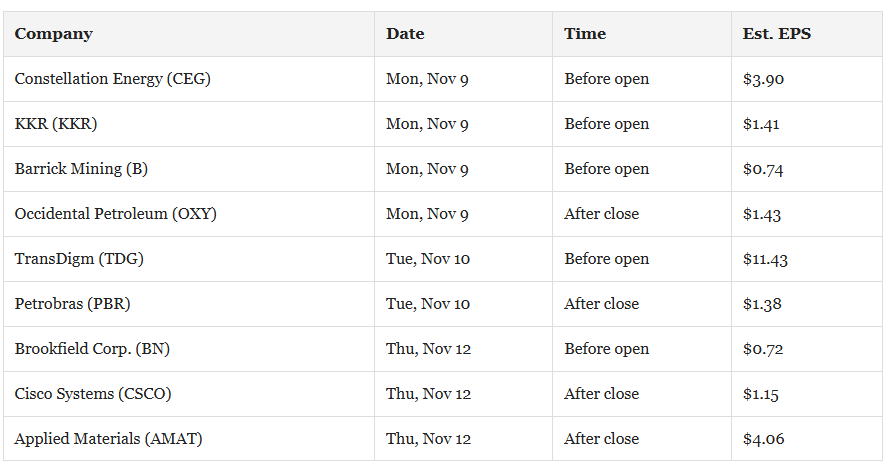
Notably, earnings season is slowing considerably, although there are still some important reports, like Nvidia, to come. However, the names reporting next week go straight to this week’s selloff. Constellation Energy reports Monday before the open. Its read on data center power contracts will be the first corporate response to the midterm election results from Texas.
Then, after a brutal selloff this past week, CoreWeave reports Tuesday after the close, a direct test of how the debt-funded “neocloud” model holds up under pressure. Thursday after the close brings Applied Materials, the best read on chip equipment demand, and Cisco, a check on enterprise AI networking spend. Applied Materials matters twice over, since it reports into a semiconductor group that our commentary this week already placed in a bear market.
In other words, there is still significant risk to the technology sector next week.
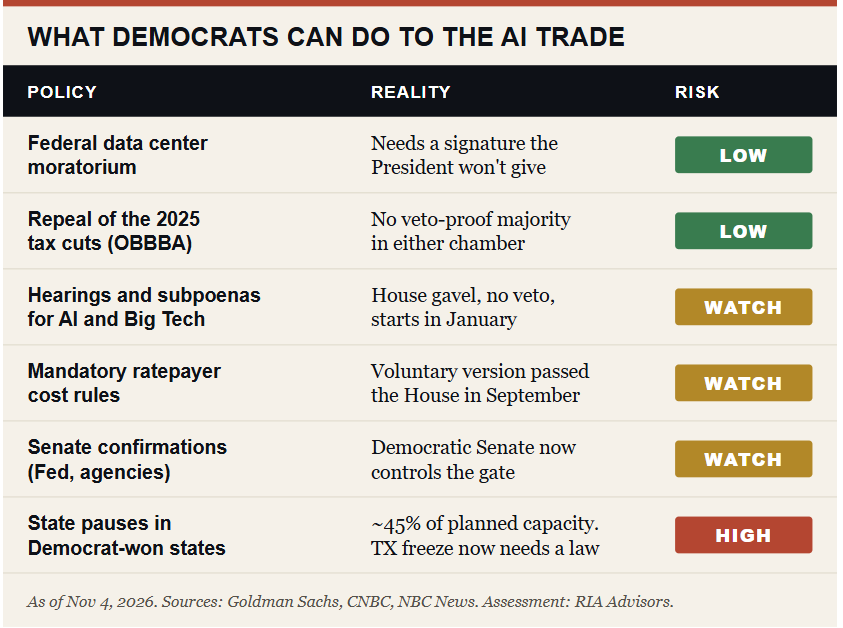
For now, Washington will fade into the background, but it won’t be quiet. The lame-duck Congress returns to a December 11 funding deadline, and headlines around the Sanders and Ocasio-Cortez data center moratorium bill will keep hitting AI stocks even though it has no path past a veto. Texas can’t act until its Legislature convenes on January 12, so any clarity there is still weeks away.
From a market perspective, the single most market-moving event is Tuesday’s CPI. A soft print gives the oversold bounce room to run toward the 50-day average. A hot one is the asymmetric risk, because layered on a strong jobs report and a fragile tech tape, it would challenge the 200-day average just as the market is testing it.
Need Help With Your Investing Strategy?
Are you looking for comprehensive financial, insurance, and estate planning services? Need a risk-managed portfolio management strategy to grow and protect your savings? Whatever your needs are, we are here to help.

💰 Midterm Election Goes Blue: What Happens With Markets Now?
On Tuesday night, the “blue wave” turned into something closer to a midterm election tsunami. Democrats took the House and flipped seven Senate seats, including Texas, for what Forbes tallied as a 54-seat majority. Futures dropped overnight. AI data center names took the worst of it, and then buyers showed up before the open. As we noted earlier this week in Liquidity Weighed On Gold Trumping Real Yields, the year after midterm elections has been positive for the stock market in all 19 cycles since 1950. The question is whether this result breaks that pattern. I don’t think it does, but the reasons matter more than the base rate.
What A Democratic Congress Can Actually Do To The AI Trade
Okay, with that recap, let’s start with the fear, because it’s real. Democrats ran on electricity bills, and the data center was the villain. Bernie Sanders has called for a moratorium on new construction. Elizabeth Warren opened an investigation into hyperscaler power deals, and a voluntary ratepayer bill already cleared the House in September. Before the vote, Wells Fargo’s Ohsung Kwon warned that a Democratic win in the Texas governor’s race, the heart of the data center buildout, was the left-tail risk for the AI trade. Texas got that outcome.
The bigger threat sits outside Washington. Republicans lost the governor’s mansions in Texas, Georgia, Ohio, Michigan, and Nevada. Goldman Sachs estimates that the states likely to tighten data center rules hold roughly 45% of planned U.S. capacity, with Texas alone accounting for about a quarter. Virginia, home of “Data Center Alley,” already has moratorium bills moving ahead of its January 13 session. Permits, zoning, and utility rules are set at the state level.
This is where the risk to the capex story could actually slow. It’s also why the selling hit the levered “neoclouds” while Alphabet, Apple, Microsoft and Amazon all traded higher during Wednesday’s trading session.
However, Texas is also less of a shock than the headlines suggest. In August, Governor Abbott ordered an audit of every data center in the grid queue and, in September, halted the issuance of state environmental permits. What changed Tuesday is the exit door. Governor-elect Gina Hinojosa says the pause will remain in effect until the Legislature acts, and Democrat Vikki Goodwin’s upset of Dan Patrick for lieutenant governor puts a pause supporter in charge of the Texas Senate’s agenda.
In Texas, the legislative session runs from January 12 through May 31, 2027. Of course, with everyone now watching what happens in Texas next, the market will take its cues from its decisions. However, for investors, the most realistic risk is a delay in data center projects, not cancellations.
Most crucially, when looking at earnings for data center players, projects that already have power, permits, and steel keep building. However, it is the projects without them that are either delayed by a year or move to friendlier states like Louisiana. Jefferies summed it up as demand moving right, not away. To wit:
“The question will be how much does this alter fundamentals.” Amit Daryanani, Evercore ISI
Gridlock Has A Better Record Than Either Party
During every election cycle, there is invariably some media outlet running a narrative that markets do better under one party than the other. The problem is that the data doesn’t support it. I sorted the 19 midterm elections since 1950 by the government each one produced, from unified control to a split Congress, and then measured where the S&P 500 stood twelve months after the vote. The setup we now have, a Republican President facing a Democratic Congress, averaged 15.5% across seven cases. The full set of 19 averaged 15.1%. Every configuration was positive on average, and not one of the 19 cycles finished the following year lower.
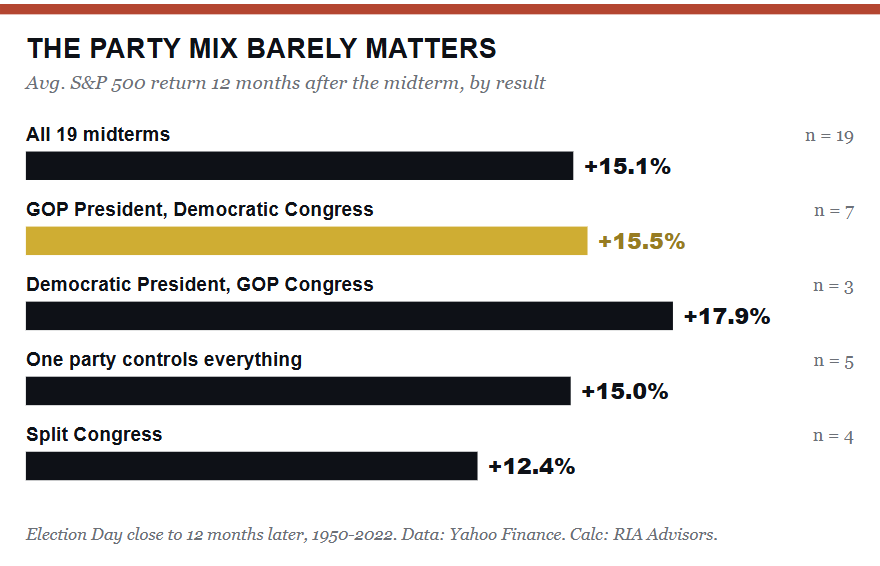
Such is the real lesson. The midterm election cycle does the work, not the party that wins it. Throughout the history of all four-year presidential cycles, midterm election years tend to see the deepest drawdowns. Such is why, by Election Day, much of the “uncertainty” is already priced in. Once the votes are counted, that discount unwinds regardless of the map’s color. Investors don’t need a friendly Washington. They need a predictable one, and gridlock is about as predictable as Washington gets.
Seven Times Before, And The One That Stung
Here are the seven midterm elections that handed a Republican President a Democratic Congress, measured from the Election Day close. The averages look terrific, with the index up 10.7% after three months, 17.5% after six, 20.1% after nine, and 15.5% after a full year, which is better than the 19-cycle average at every horizon. All seven were higher at every checkpoint.
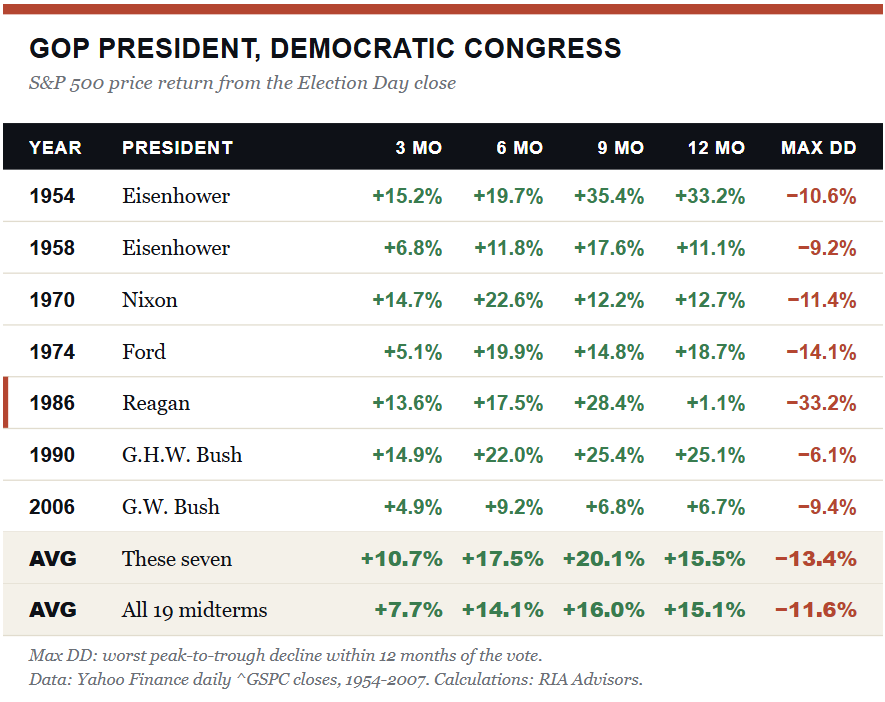
However, it is important to understand that “averages” hide the path, and the path is what investors actually live through. A good example occurred in 1986 when Democrats retook the Senate under Reagan. Over the next 9 months, the market gained 28.4%. Then October 1987 arrived, a 33% drawdown hit within the year, and the twelve-month gain shrank to 1.1%.
More recently, the closest analog to 2026 is 2006, when Democrats flipped both chambers under a second-term republican president, George Bush. Over the next 12 months, the market gained 6.7%, but the bull market peaked eleven months after the vote. Seven observations are a small sample, so treat this as a tilt in the odds rather than a promise.
Impeachment And Shutdowns Make Noise, Rarely Bear Markets
Unfortunately, the one thing that the markets will likely have to deal with is the resurgence of impeachment actions against the President. The incoming class includes a louder populist and, in a few cases, openly “socialist” wing; the relationship with the White House starts out hostile, and Hakeem Jeffries has said Democrats haven’t ruled impeachment in or out. A House majority can impeach. Removal takes 67 Senate votes, and Democrats hold 54. So while an “impeachment” may cause short-term market turmoil, a full removal is highly unlikely.
However, how would the market likely respond to an attempt at impeachment? Less than you’d think. The Clinton impeachment coincided with a 28% rally, and stocks gained 12% from the opening of the first Trump inquiry to the acquittal.
The most likely risk of the post-midterm election configuration is a government shutdown. While government shutdowns are used for political positioning and media attention, they have very little impact on the market itself. The S&P 500 rose during every lapse since 1995 except a four-day gap this January. That includes the 35-day closure in 2018-19 and last year’s 43-day shutdown.
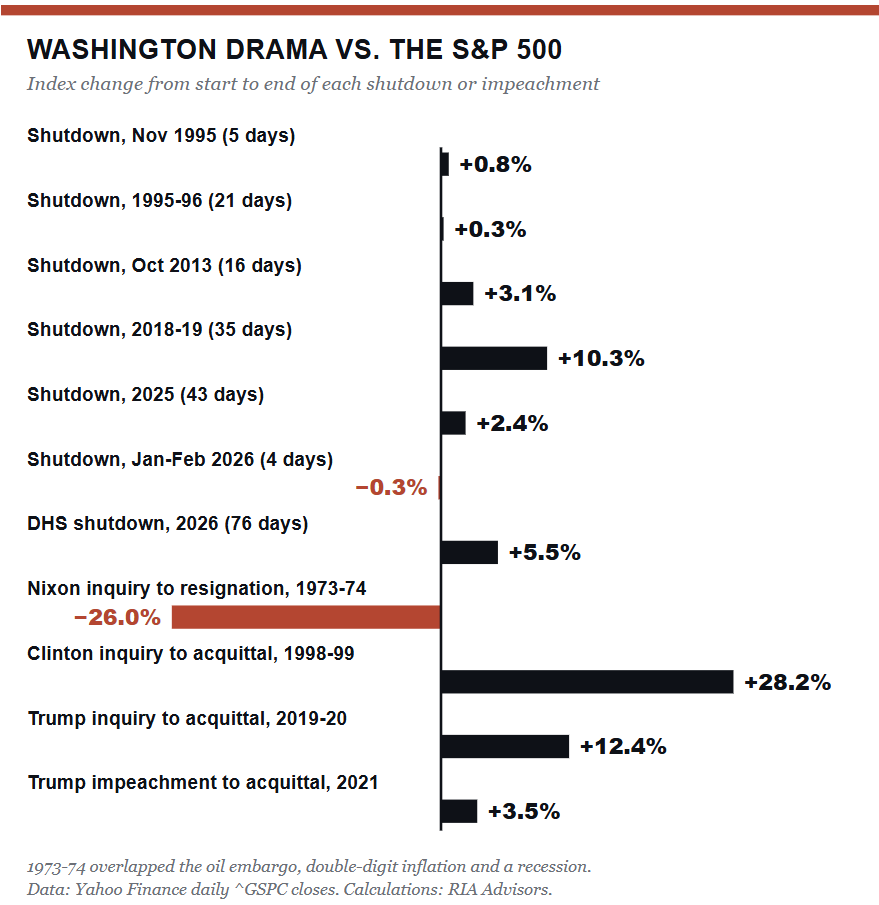
The exception is Nixon. Stocks fell 26% from the opening of the House inquiry in October 1973 to his resignation the following August. That stretch also brought the Arab oil embargo, double-digit inflation, and a recession. Washington didn’t cause that bear market. The economy did, and political chaos rode along.
The nearer test is December 11, when the stopgap funding bill expires, one day after ERCOT files its Texas data center audit. A defeated majority has to pass something in the lame duck, and a short lapse is plausible. Such is the nature of a Congress with nothing left to lose. I’d expect noise rather than anything that ends the bull market.
The Bond Market Is Betting On Slower Growth, Not Bigger Deficits
Someone will tell you that a Democratic Congress means a spending spree and a “bond vigilante” revolt. The bond market disagreed on Wednesday. By midday, the 10-year Treasury yield had slipped about five basis points to roughly 4.90%, and the 2-year and 30-year followed it lower. That isn’t what a market bracing for a deficit blowout looks like.
Start with spending. Democrats would like to spend more, and Pimco’s Libby Cantrill expects deficits to widen no matter who controls Congress. However, the same veto math that protects the data center buildout also blocks any large new spending program. The likely path is two years of stopgaps, standoffs and a debt ceiling fight that Reuters reports probably won’t bite until late 2027. Gridlock won’t shrink the deficit. It does keep it from accelerating.
For the market, growth matters more. Currently, ING estimates that AI-related investment accounts for roughly 33% of U.S. economic growth this year. Wells Fargo figures that for every 10% cut to Texas data center projects, it will trim total AI capex by about 1.6%. Therefore, if state permitting freezes, or federal scrutiny slows the data center buildout, the economy loses its biggest engine.
For the bond market, slower growth means lower yields. I’ve long argued that debt and deficits are ultimately disinflationary, because unproductive borrowing erodes growth over time. This sets up a trap that Democrats are potentially walking into. Since political parties can’t, and have no desire, to cut the deficit, any actions that slow the capex cycle will increase the economic drag that is already present. Such an outcome could be perilous heading into the 2028 Presidential election.
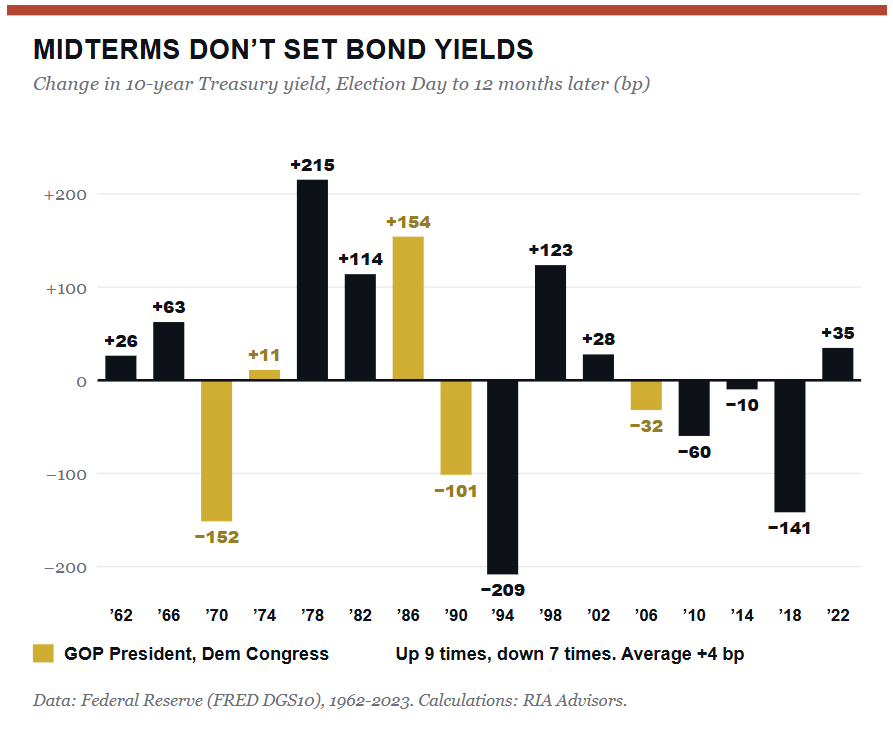
However, history agrees that midterm elections don’t set interest rates. Over the last 16 midterm elections since FRED’s daily 10-year data begins in 1962, the yield rose over the following year nine times and fell seven times, for an average change of just 4 basis points.
Most notably, given the current Congressional makeup, interest rates under a Republican President facing a Democratic Congress fell in three out of five cases. As we have repeatedly stated, it is economic growth, inflation, and the Fed that drive yields. Congress mostly supplies the noise.
There is one place that you should watch more closely, and that is the long end of the yield curve. The 30-year sits near 5.3%, and a shutdown standoff or debt ceiling brinkmanship can add term premium in a hurry, even when the growth outlook argues for lower rates. I would treat a fiscal-driven spike in long yields as an opportunity to add duration rather than a reason to run from bonds.
What Should Investors Do Now
The midterm playbook argues for staying invested through the November-to-April window. Since 1950, that six-month stretch has gained in all 19 midterm years, averaging 14.8% according to Carson Investment Research, and it has never once required a friendly Congress to get there. I reconstructed those figures from daily S&P 500 closing prices.
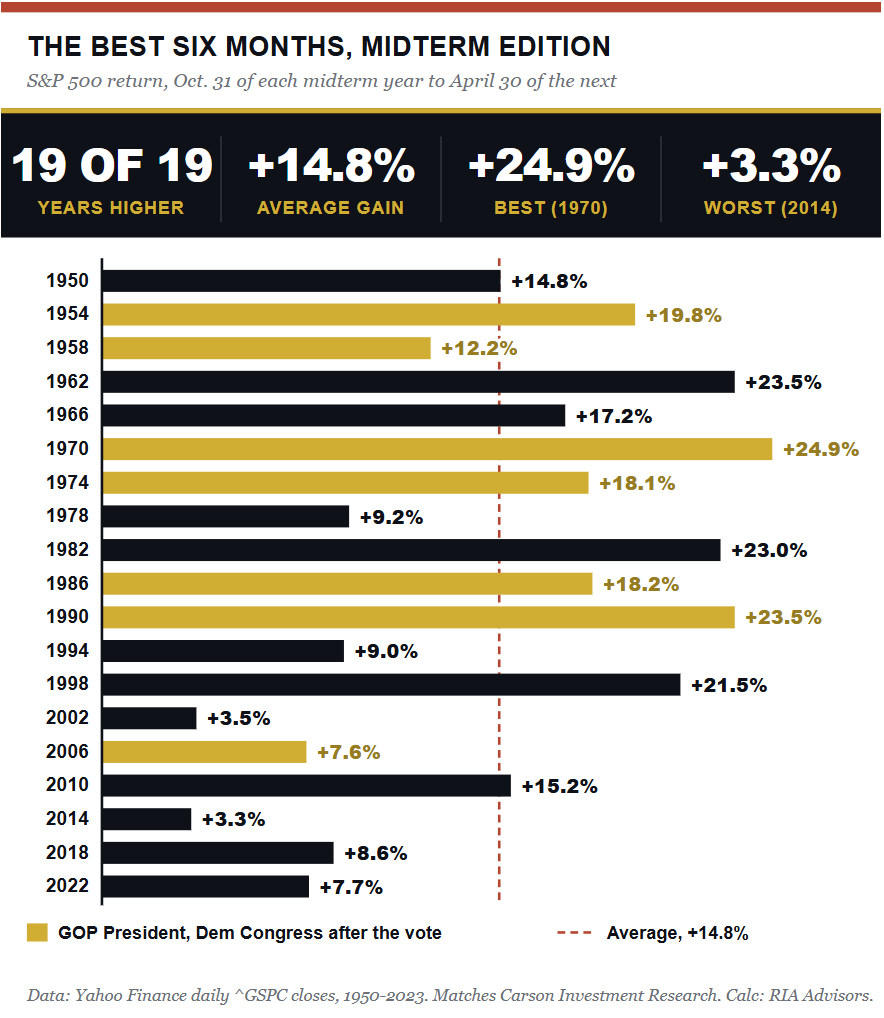
Every year ties out. History tilts the odds, but it does NOT manage your risk. As we discussed in Oracle Sells Cheap Stock As Its Debt Window Narrows, the weakest links in the AI chain are the companies funding the buildout with borrowed money. A state permitting freeze hits them first, and a hearing room doesn’t help. Even the workaround is stuck, since the Texas permit halt also reaches the on-site power plants developers were using to skip the grid queue.
That brings us back to last week’s newsletter. On October 5, we tilted the equity model toward value, trimming Apple, Nvidia, AMD, and Palantir, and adding Walmart, Costco, JPMorgan, Goldman Sachs, Kinder Morgan, and RTX. By last Friday, growth had lost 11.9% against value since October 7. Three of the five conditions on our turn checklist were met.
The plan was a first tranche back into growth on weakness, a second only after the S&P 500 reclaims its 50-day average near 7,697, and a stop on every new position. This week, the Factor Rotation model used overbought readings in value to rebalance toward oversold growth. We added to Amazon, Alphabet, Microsoft, Nvidia, and the rest of our growth positions, and took profits in those previous value-oriented trades.
The election-night selling in tech is exactly the weakness that first tranche was built to buy. Our October exits from Applied Digital and Vertiv kept us away from the builders most exposed to a state permitting freeze, and our exits from KMI and Williams protected us from the drop in oil. Such is why we prepared the rotation before the vote rather than reacting to it.
The calendar is on the bulls’ side, and gridlock has historically been good company for stocks. Politics will make the headlines. Leverage will make the losses.
🖊️ From Lance’s Desk
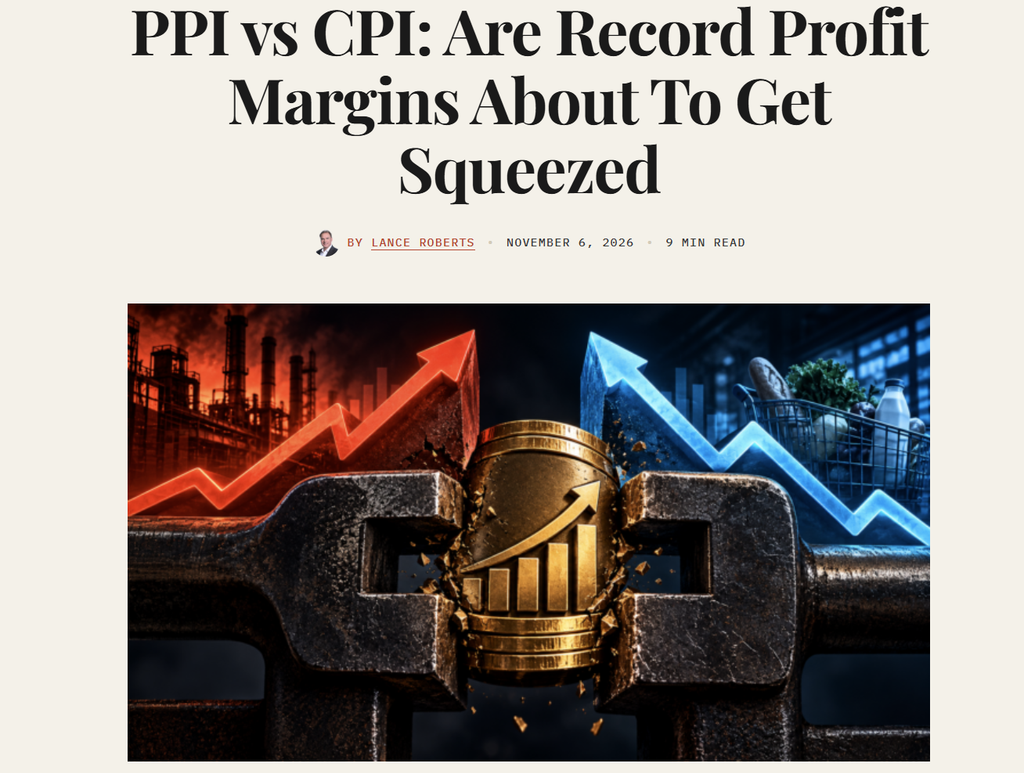
This week’s #MacroView blog explores the PPI vs. CPI gap, the widest since 2022, and history suggests record profit margins are in the crosshairs.
Also Posted This Week:
📹 Watch & Listen
Stocks surged following the midterm elections, but can the post-election rally finally break the market out of its prolonged trading range?
Subscribe To Our YouTube Channel To Get Notified Of All Our Videos
📊 The Weekly Market Dashboard
Weekly technical overview across key sectors, risk indicators, and market internals

💸 Market & Sector X-Ray: Market Gains Ground
Last week I stated: “With Energy and Healthcare are the most overbought along with Real Estate, Utilities, and Materials. Take profits and look for a potential reversal in Technology and Communications.” While Technology did not reverse, and has become even more deeply oversold, Energy reversed even more. Bonds performed well and are the most overbought, which increase the risk of a reversal in the more growth focused sectors.
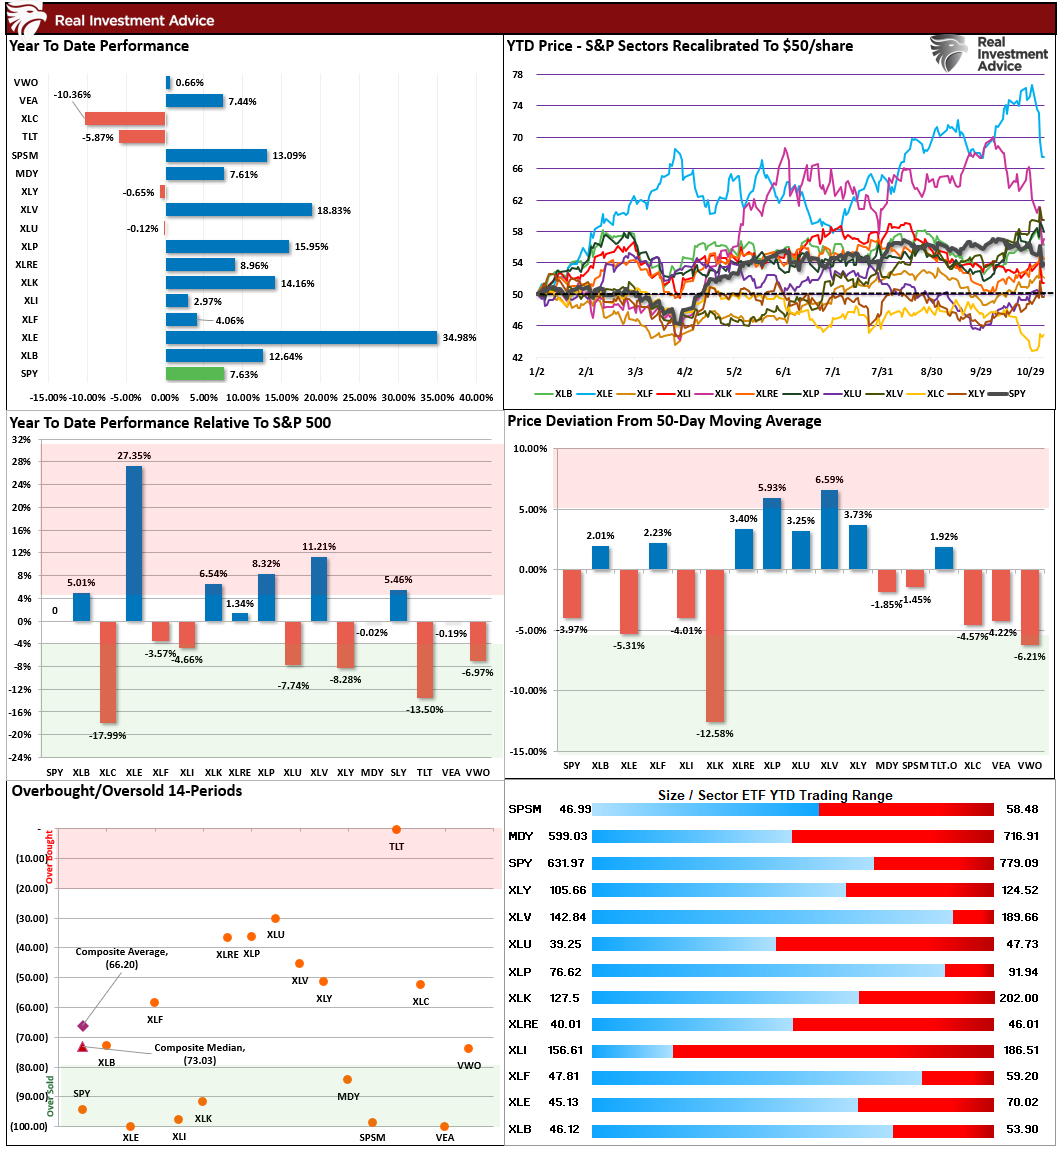
📐 Technical Composite: 30.67 – Sell-Off Reduces Overbought Conditions
The technical condition plunged last week dropping from 53.53 to 30.67 as the technology sector unwind intensified. Notably, However, the reduction reversed the previous overbought condition back to more extremely oversold. Rallies from these levels, are not uncommon, but there is risk of further contraction. Rebalance risk and remain tactically cautious until conditions improve.

🤑 Fear/Greed Index: 54.89 – Holding At Neutral
Even though the market sold off sharply on Thursday, the underlying market allocation and sentiment remain more neutral. There was an increase in the Commitment of Traders equity allocations; however, investor sentiment turned more bearish last week. With the market getting decently oversold short-term, a reflexive bounce is possible.

🔁 Relative Sector Performance
Five weeks ago we warned that the more extreme divergence growth from value in the market was due for an eventual rotation. That rotation came swiftly those value oriented sectors are more overbought and growth is very oversold. As shown below, the Healthcare, Staples, Financial and Real Esate have become more overbought, while the Technology is the most oversold. Historically, these more extreme deviations, as noted last week, have been a precursor to a rotation, while that didn’t happen this past week, doesn’t mean it won’t.

📊 MFBR Index (Money Flow/Breadth Ratio Indicator)
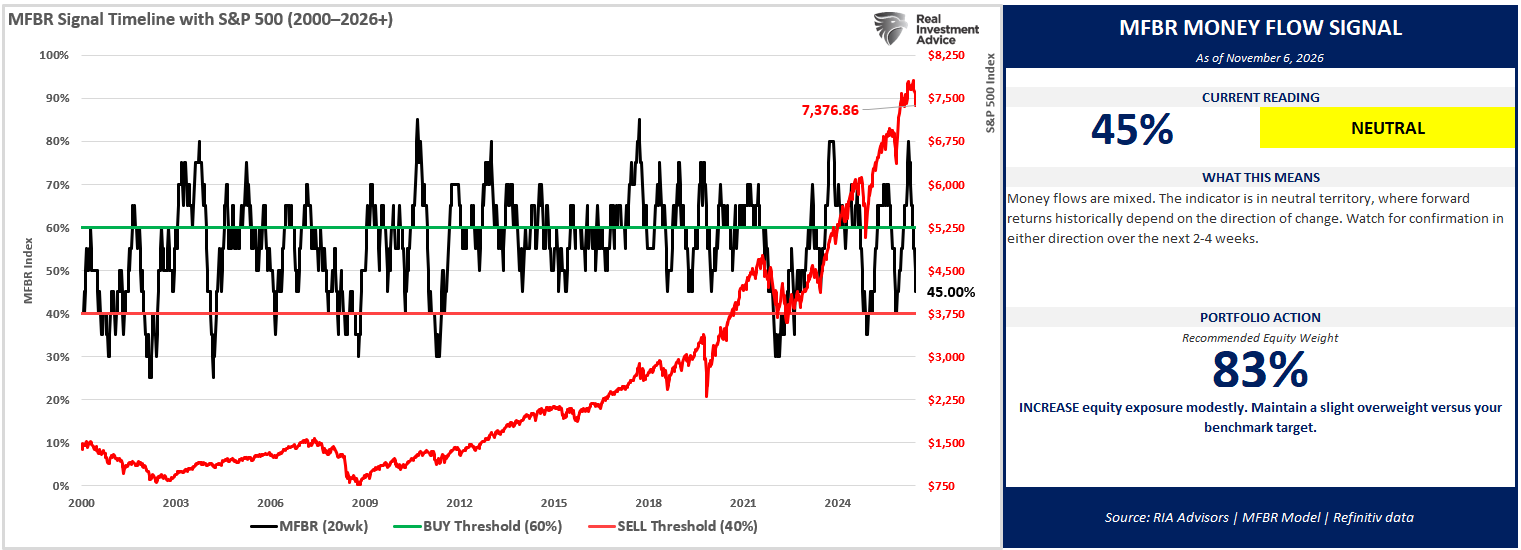
The Money Flow Breadth Ratio (MFBR) model is a rules-based equity allocation framework that uses weekly S&P 500 money flow data to generate buy, sell, and neutral signals. The MFBR systematically adjusts portfolio equity exposure in response to the direction and persistence of institutional capital flows. It aims to reduce drawdowns while capturing the majority of market upside.
“As of November 6, 2026, with the S&P 500 at 7,376.86, the Money Flow Breadth Ratio (MFBR) stands at 45%, down from a peak of 80% set 12 weeks ago and falling versus 50% the prior week. The trailing four-week change is -15 percentage points, and the near-term trend has rolled over. This places the indicator in neutral territory (40-50%). The raw zone signal reads NEUTRAL, but the model still flags a TOP REVERSAL, with 35 points now off the 80% peak. This is the lower half of the neutral band, and the path matters: the gauge is still sliding out of overbought, not bouncing off a low, and the 40% sell line is now just 5 points away.
Bottom line: hold target weights for now, but treat it as a weight already on the books, not a fresh buy. The roll-over off the 80% peak has now taken the gauge 35 points lower, into the lower half of the neutral band, where falling readings have averaged just +1.3% over 26 weeks. The 8-week hold keeps the target locked for 5 more weeks; unconstrained, the grid already reads 58%. A break below 40% would move the grid into the sell zone (25% if still falling); a turn back up would lift the grid to 75%, though the backtest flags rising readings in this band as a trap.”
📊 Sector Model & Risk Ranges
We noted three weeks ago that “Energy and Technology are now extremely deviated above their long-term weekly means. Historically, such deviations lead to corrections or consolidations, so profit-taking and rebalancing are recommended.” While the rotation to Technology hasn’t materialized yet, the advice to take profits in Energy helped shield the market from the decline this past week. Bonds also rallied as the rotation to safety accelerated. Energy remains extremely elevated above long-term means, and Healthcare has now joined that club. Continue to rebalance risk, as we still expect the rotation to Technology, in particular, to occur.
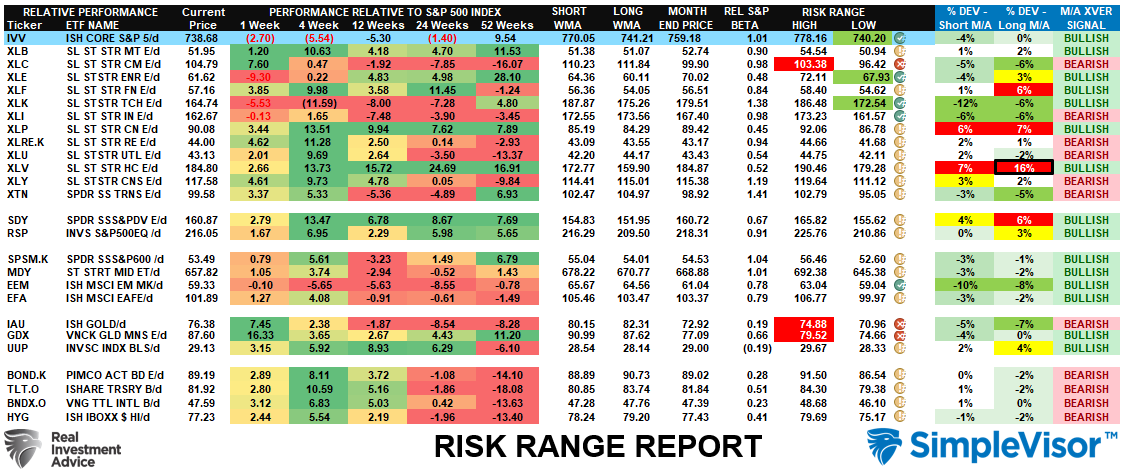
Have a great week.
Lance Roberts, CIO, RIA Advisors

Lance Roberts is a Chief Portfolio Strategist/Economist for RIA Advisors. He is also the host of “The Lance Roberts Podcast” and Chief Editor of the “Real Investment Advice” website and author of “Real Investment Daily” blog and “Real Investment Report“. Follow Lance on Facebook, Twitter, Linked-In and YouTube
Customer Relationship Summary (Form CRS)