


Monetary headwinds, already proving difficult for stock prices, are expected to strengthen in the next two months. The U.S. Treasury announced its Q4 borrowing estimates would be $150 billion more than expected. Further, they expect to increase its cash balances held at the Fed (Treasury General Account -TGA) to $700 billion. Increased debt issuance forces investors to carry more Treasury assets, leaving less cash for other investments. Further, the higher Treasury cash balances will accentuate monetary headwinds already weighing on stock prices.
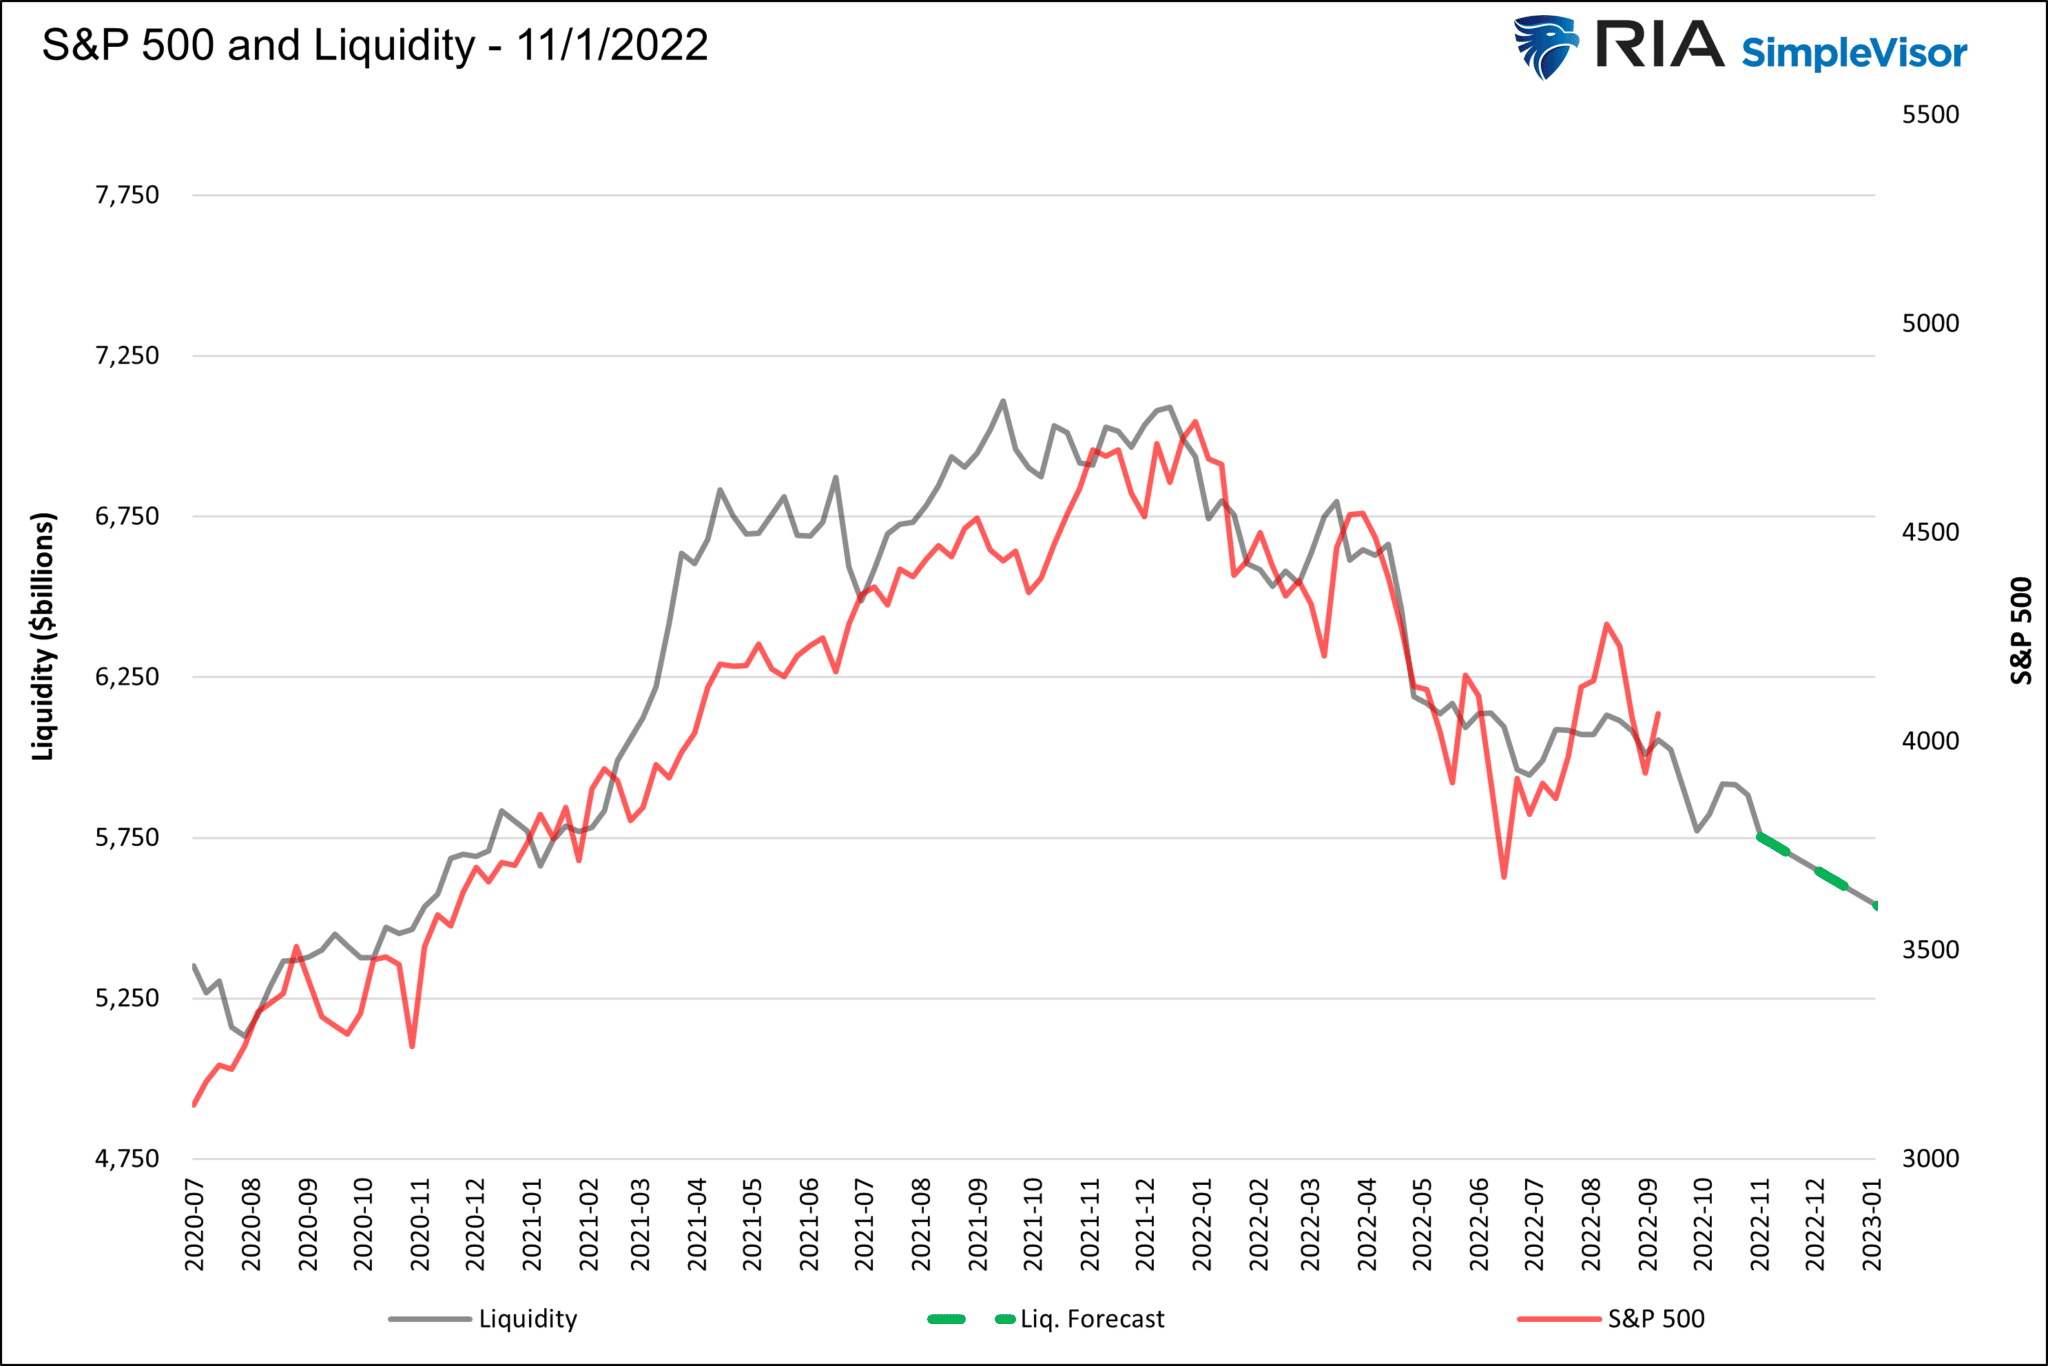
As we wrote in 3500 By Year End if QT Continues, liquidity is governed by the Fed’s balance sheet, the Fed’s RRP program, and Treasury balances held at the Fed (TGA). The size of the Fed’s balance sheet less the sum of the TGA and RRP equals the amount of Fed-generated liquidity in the system. The Fed, via QT, will continue to reduce its balance sheet by $95 billion a month. RRP is expected to be flat over the coming months, neither adding nor subtracting liquidity. As we noted, the TGA will rise to $700 billion, pulling an additional $75 billion of liquidity from the markets by yearend. The updated graph below shows that increasing monetary headwinds still project the S&P 500 toward 3500.

What To Watch Today
Economy
- 7:00 a.m. ET: MBA Mortgage Applications, week ended Oct. 28 (-1.7% prior)
- 8:15 a.m. ET: ADP Employment Change, October (180,000 expected, 208,000 prior)
- 2:00 p.m. ET: FOMC Rate Decision (Lower Bound), Nov. 2 (3.75% expected, 3.00% prior)
- 2:00 p.m. ET: FOMC Rate Decision (Upper Bound), Nov. 2 (4.00% expected, 3.25% prior)
- 2:00 p.m. ET: Interest on Reserve Balances Rate, Nov. 2 (3.90% expected, 3.15% prior)
Earnings

Market Trading Update
The market traded up nicely yesterday morning until a much stronger-than-expected Job Opening Survey (JOLTS) sent stocks lower over concerns that the report will keep the Fed more hawkishly biased for now. Today, we will have the Fed’s latest commentary following the November FOMC meeting, where rates will increase by 0.75% bps. That rate hike is well expected; however, the markets will be looking for Powell’s commentary about future rate hikes and a reduction in the pace of those hikes. Also, markets are hoping for signs the Fed may be closer to suggesting they are closer to the end of hikes than not. We will see, but for now, we continue to reduce exposure to stocks on this rally and will likely take further action following the outcome of the meeting and how the market responds.
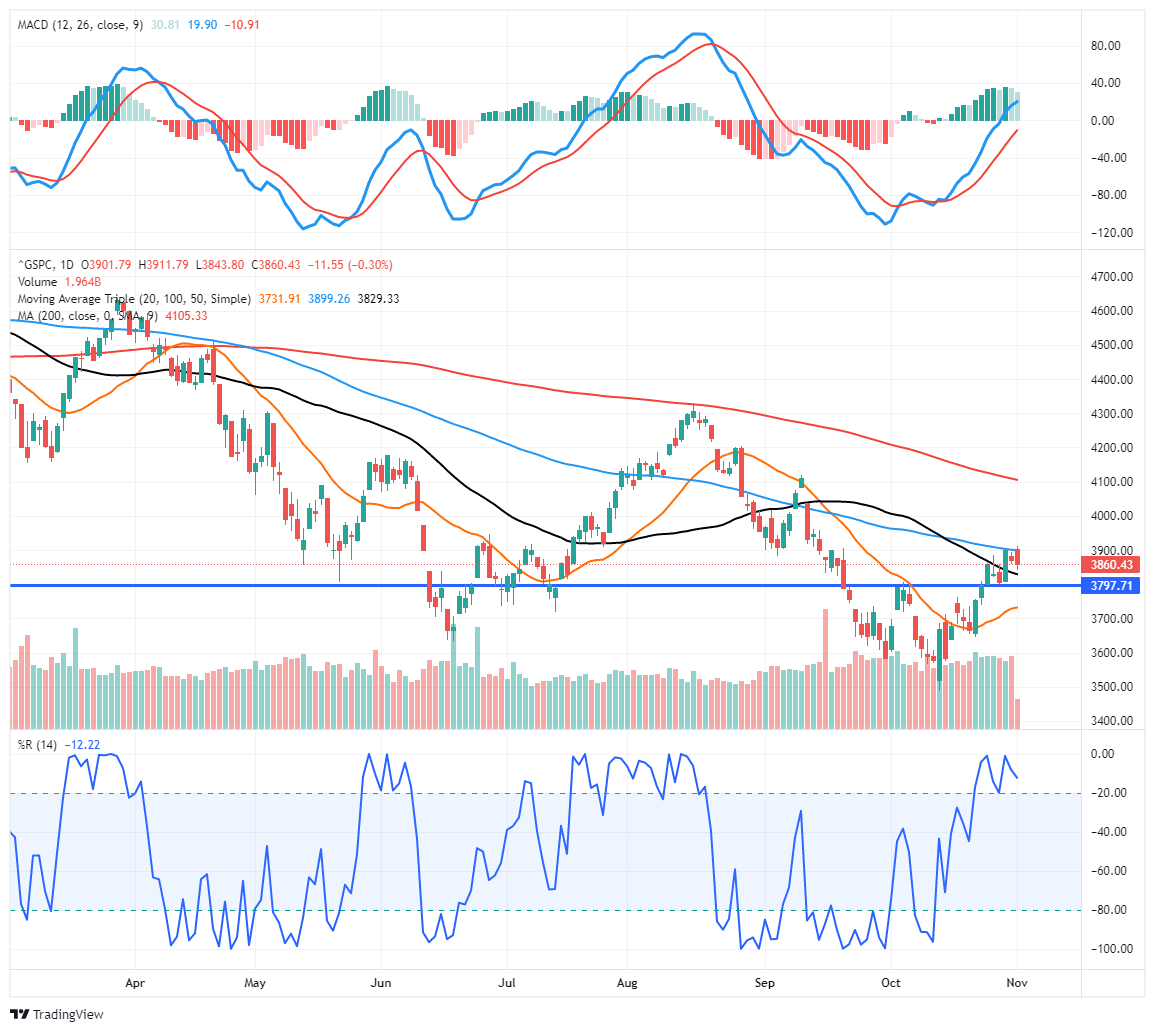
Yesterday, the market struggled with the 100-dma after an intraday test of the 50-dma. Support also remains at the 3800 level, which is critical for the current rally. A failure of that support will set the market up for a test of the rising 20-dma. With the market short-term overbought, a bit of pullback is likely.
Is a Reprieve of Monetary Headwinds Possible
The opening paragraph discusses the prospects for strong monetary headwinds to continue through yearend. There may, however, be a silver lining. The Treasury Department has been raising the prospect of conducting a yield curve control (YCC) program. The gist would be the Treasury would buy back long-term debt and issue short-term debt. Such a program would not affect the amount of debt outstanding, but it may benefit liquidity. In Quantitative Buybacks, Joseph Wang explains how YCC could boost liquidity and dampen the monetary headwind. To wit:
A Treasury buyback program today would be mechanically equivalent to quantitative easing and a tailwind for risk assets. Buybacks funded by bill issuance would move cash out of the RRP and into the broader financial system.
Joseph makes the case that a larger supply of short-term debt would increase money market yields. Therefore it entices money market funds to buy the higher-yielding Treasury debt instead of investing cash in the Fed’s RRP program. As we wrote earlier, an increase in RRP drains liquidity from the system. Ergo, a decrease in RRP increases liquidity. Joseph ends as follows:
The combination of a large primary deficit and QT is creating a wave of selling that the market is having trouble digesting. A sizable buyback program would in effect make the Treasury a dealer of last resort like the Fed. The result is likely comparable to the Fed QE: improved market liquidity and lower yields.
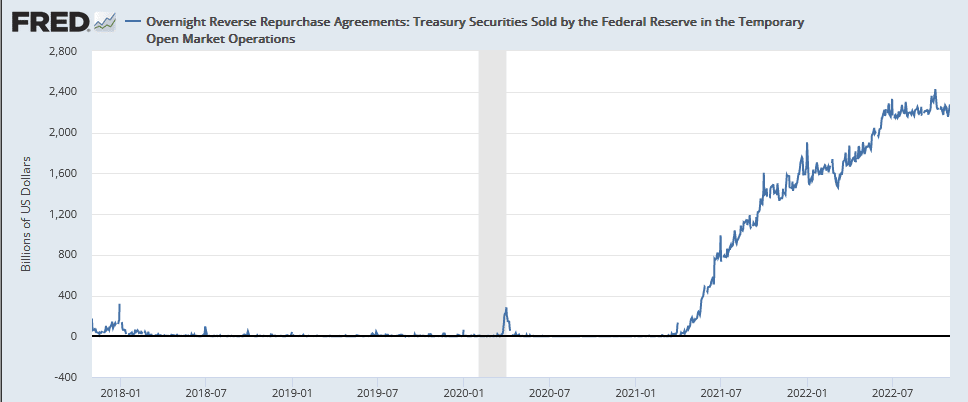
The following graph charts the Fed’s RRP balances. If the Fed enacts YCC, investors should pay close attention to RPP balances. YCC may be just the medicine Mr. Market needs to end the fourth quarter on a high note.
Small Businesses are Struggling
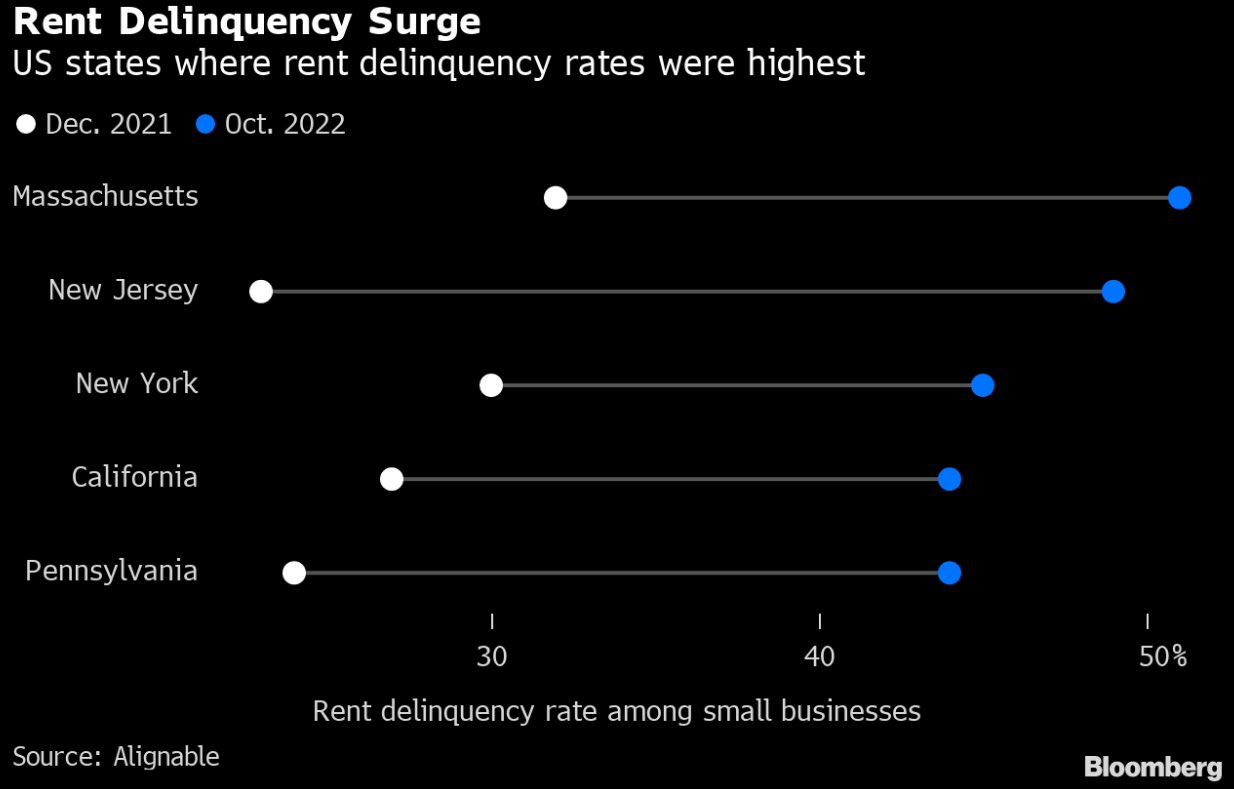
As you read the following commentary and view the graph from Liz Ann Sonders at Charles Schwab, consider small businesses employ about half of all Americans in the private sector. If the rental delinquency trends continue, layoffs will likely surge in the coming months.
Reeling from rent: per @Alignable, ~37% of U.S. small businesses were unable to pay their rent in full in October, up 7% from September and the highest pace of 2022 … Massachusetts and New Jersey led in delinquency surge
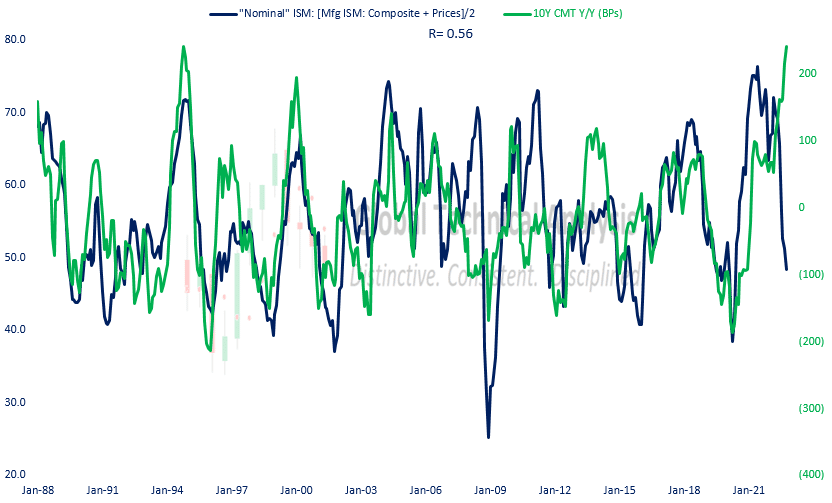
“Nominal” ISM Portends Plunging Bond Yields
The ISM report showed that manufacturing activity is growing at its slowest rate in about 2.5 years. The index, at 50.2, sits just above economic contraction territory. The good news is that prices paid fell 46.6, the seventh straight monthly decline and the lowest level since May 2020. While prices are falling, the labor market continues to remain strong. The ISM employment index ticked up slightly. Additionally, the JOLTS report came in shockingly higher. There are now 10.7 million job openings. That is 1 million more than expected and 700k higher than last month.
The graph below from Brett Freeze shows the strong correlation between “nominal” ISM and 10-year UST yields. Per Brett, nominal ISM is the average of ISM activity and ISM prices. The higher the number, the more robust growth, and inflation. Bond yields tend to rise in such an environment. The takeaway from the graph is that the two figures diverge on occasion, but importantly, those periods are brief and always converge afterward. Will growth and prices accelerate to justify bond yields, or will yields plummet by over 3% in the coming year?
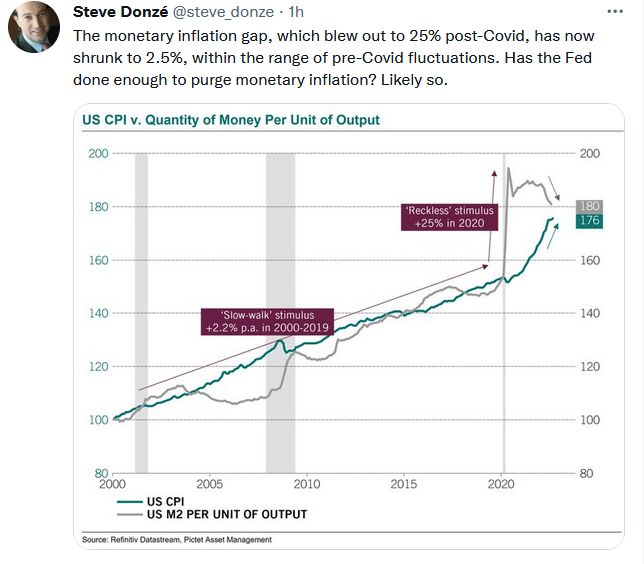
Tweet of the Day
Please subscribe to the daily commentary to receive these updates every morning before the opening bell.
If you found this blog useful, please send it to someone else, share it on social media, or contact us to set up a meeting.