


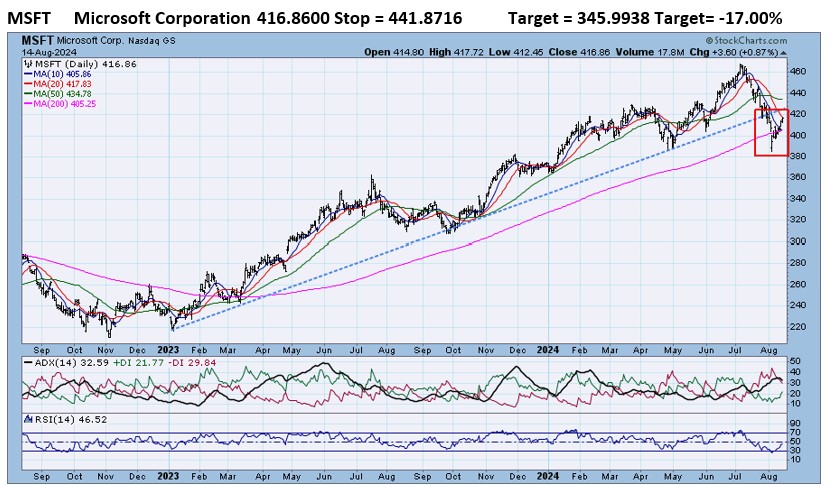
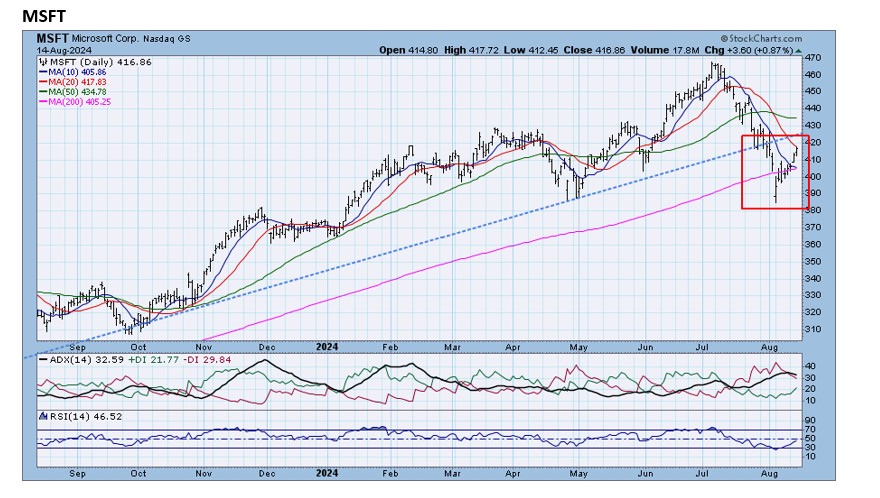
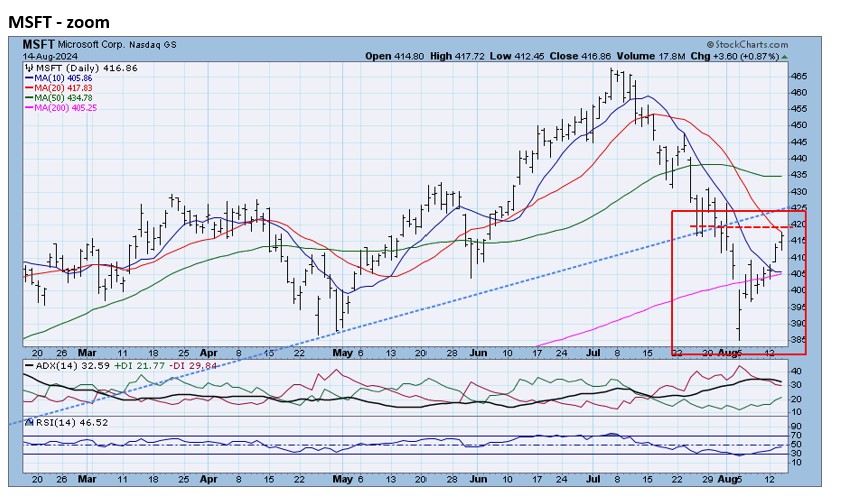
- MSFT fell below its steady 17-month uptrend line at the end of July. MSFT had rallied over 110% from the start of 2023 to the highs of July. Chart 2 shows the breakdown in sharp relief. The 7 day 5% rally puts MSFT right at break point resistance (Zoom chart).
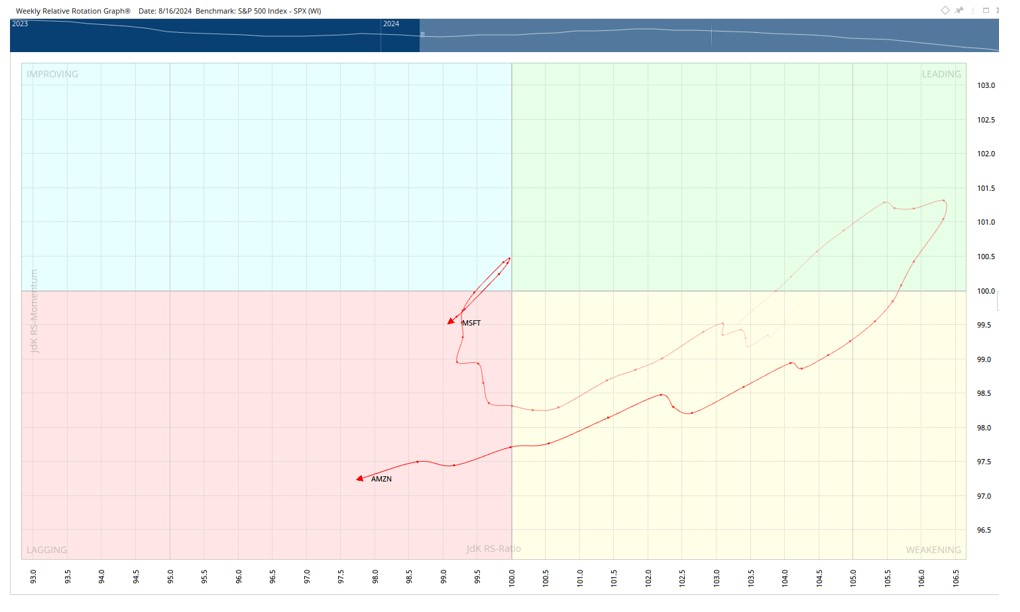
RRG analysis shows that MSFT has lost relative strength and relative momentum in the past 20 weeks and that the recent move is just a head fake as MSFT has ended up back in the Lagging quadrant.
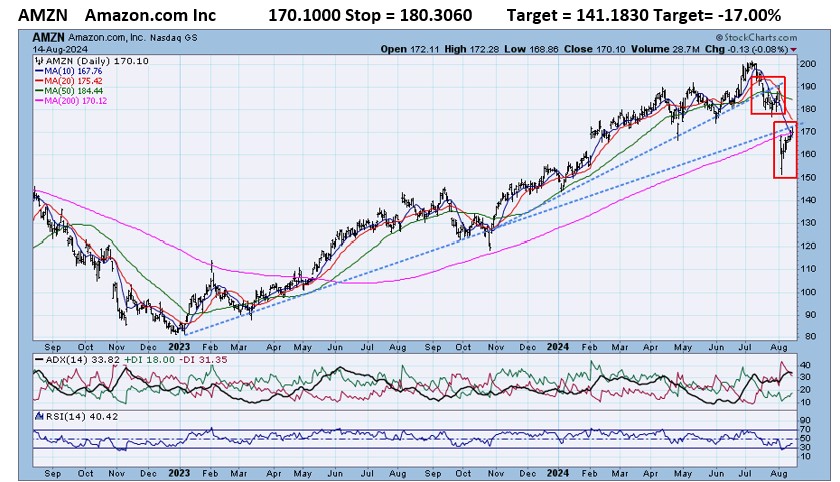
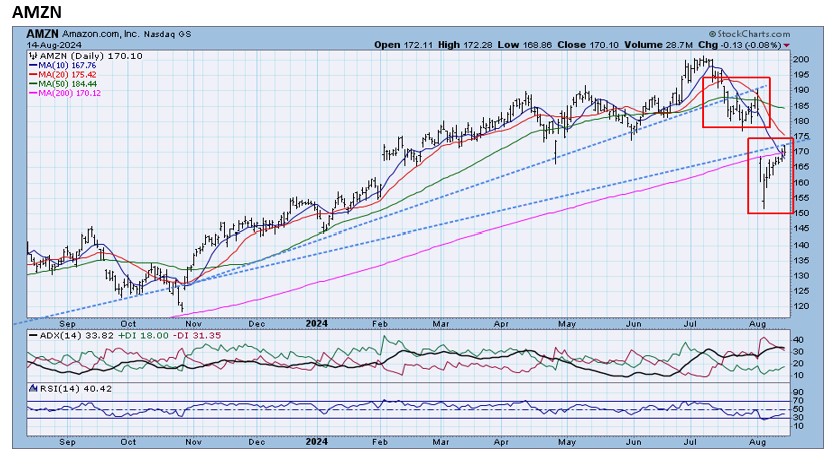
- AMZN fell below the 8-month uptrend line in early July and then experienced a huge gap-=down day that also violated the long-term uptrend line. Chart 2 and the Zoom chart reveal that the recent 10-day rally merely puts AMZN at break-point resistance.
RRG analysis shows that AMZN has lost relative strength and relative momentum as it moved solidly into the Lagging quadrant.

Relative Rotation Graphs (RRG) – explanation video


Jeff Marcus founded Turning Point Analytics (TPA) in 2009 after 25 years on trading desks and 13 years as a head trader to provide strategic and technical research to institutional clients. Turning Point Analytics (TPA) provides a unique strategy that works as an overlay to clients’ good fundamental analysis. After 10 years of serving only large institutions, TPA now offers its research services to mid and small managers, RIA’s, and wealthy sophisticated individuals looking for a way to increase their returns and outperform their peers.
Subscribe 2 Week Trial
Customer Relationship Summary (Form CRS)