


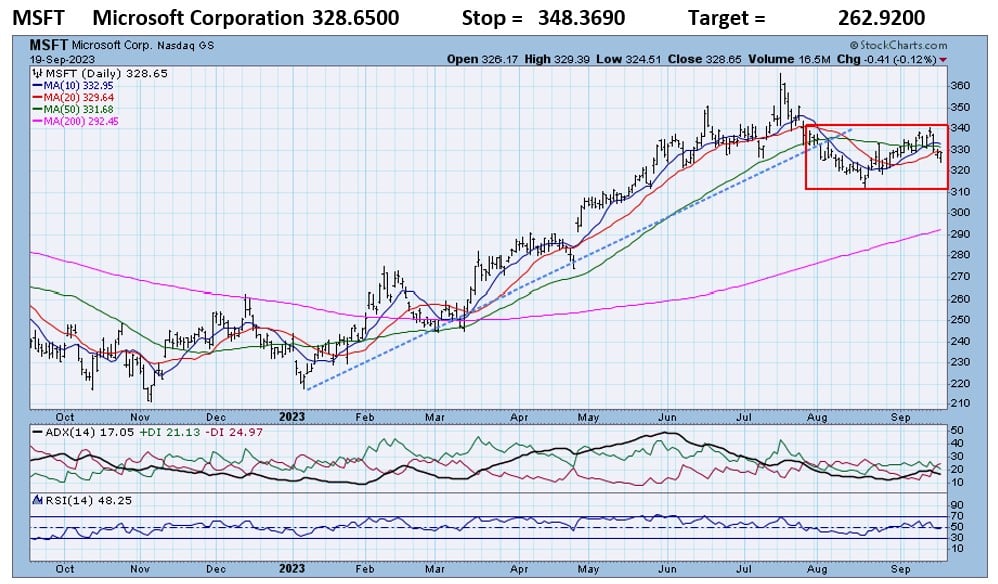
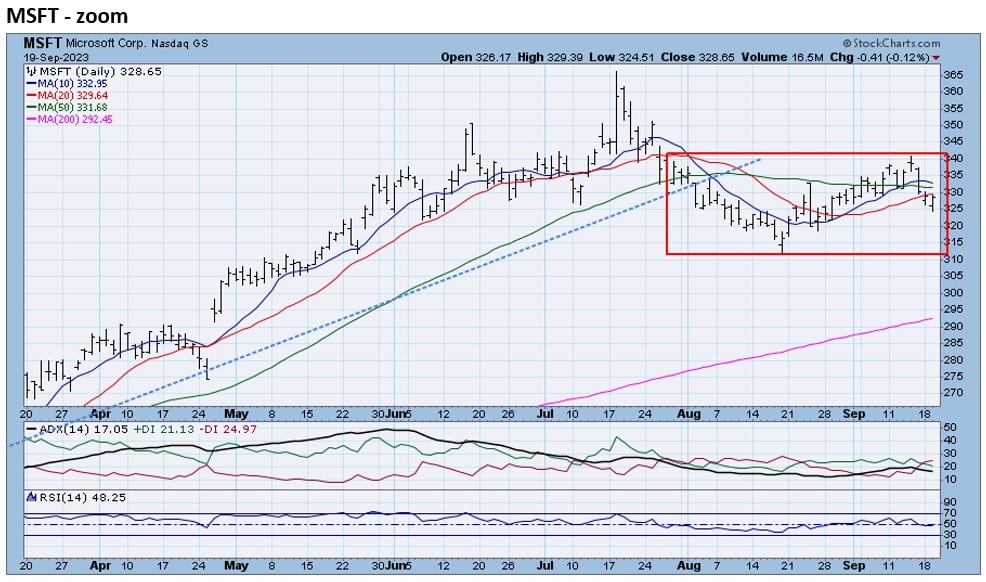
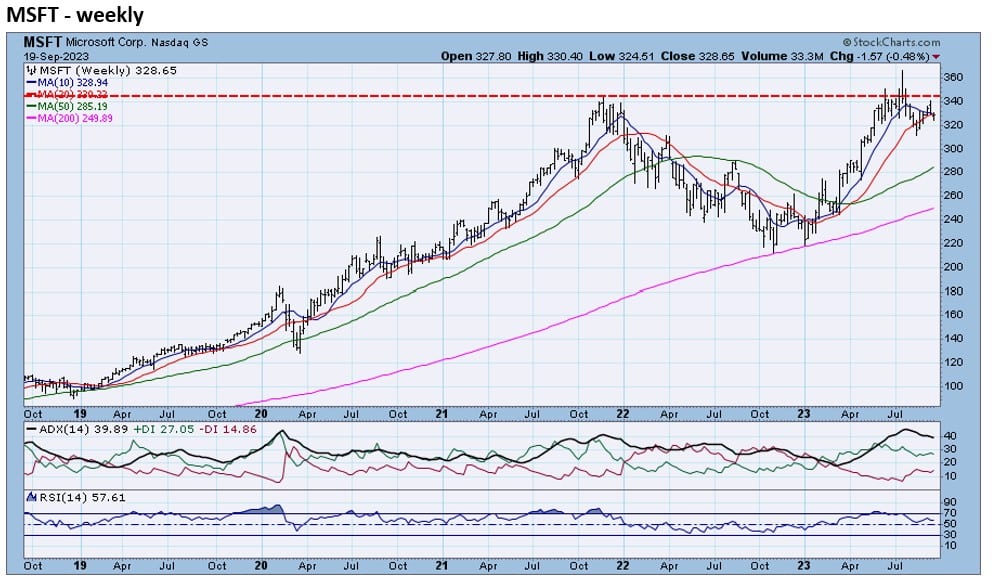
MSFT fell below its 2023 uptrend line at the beginning of August. MSFT had rallied over 60% from early January to the highs of July. MSFT’s rally from mid-August to mid-September failed at break-point resistance (zoom chart). The weekly chart reveals that MSFT topped out at resistance from the 2022 highs. Long-term support will be around the 200-week MA.
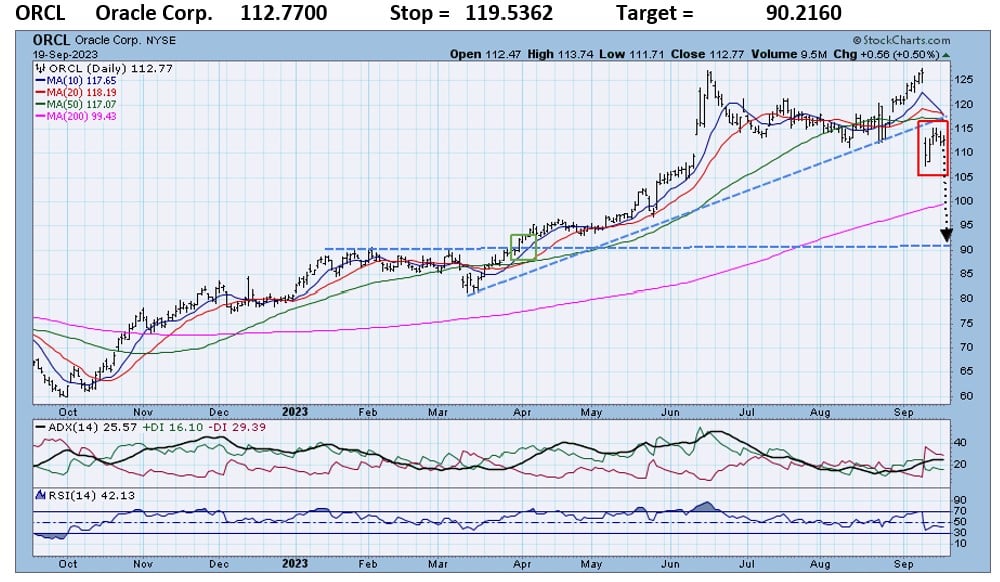
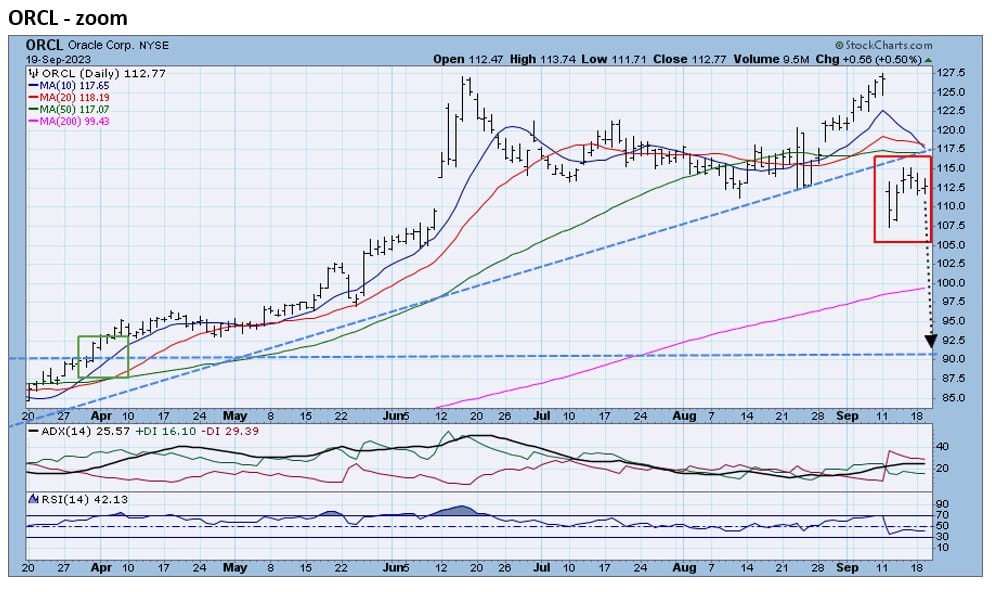
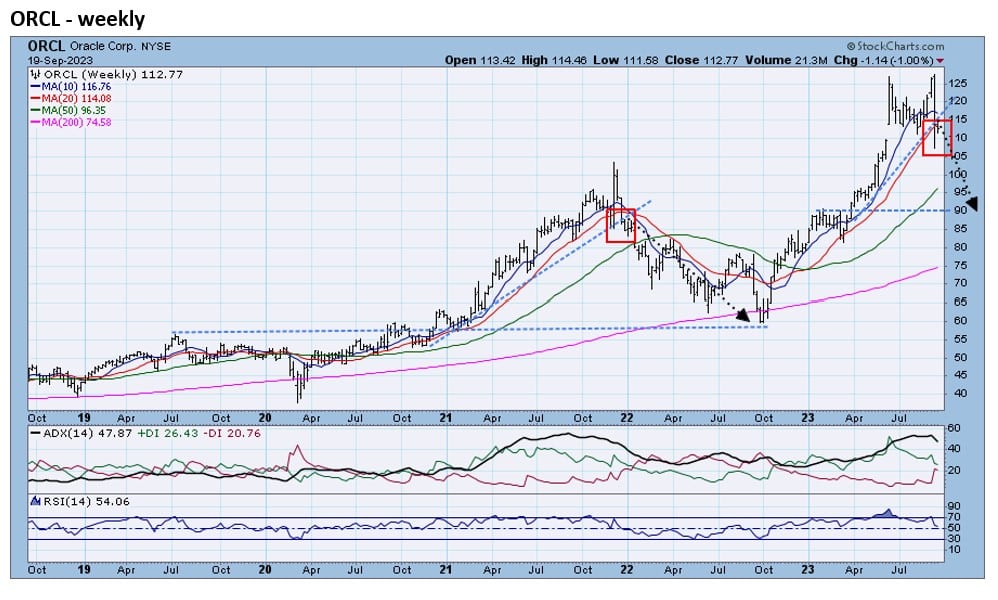
ORCL had a gap down day a week ago that ruined its 6-month uptrend line. Long-term support should be around the 90 level, where ORCL broke out in April. The zoom chart reveals that ORCL was unable to overcome break-point resistance. The weekly chart shows that the current pattern seems to be a replay of the 2021-2022 breakdown.


Jeff Marcus founded Turning Point Analytics (TPA) in 2009 after 25 years on trading desks and 13 years as a head trader to provide strategic and technical research to institutional clients. Turning Point Analytics (TPA) provides a unique strategy that works as an overlay to clients’ good fundamental analysis. After 10 years of serving only large institutions, TPA now offers its research services to mid and small managers, RIA’s, and wealthy sophisticated individuals looking for a way to increase their returns and outperform their peers.
Subscribe 2 Week Trial
Customer Relationship Summary (Form CRS)