


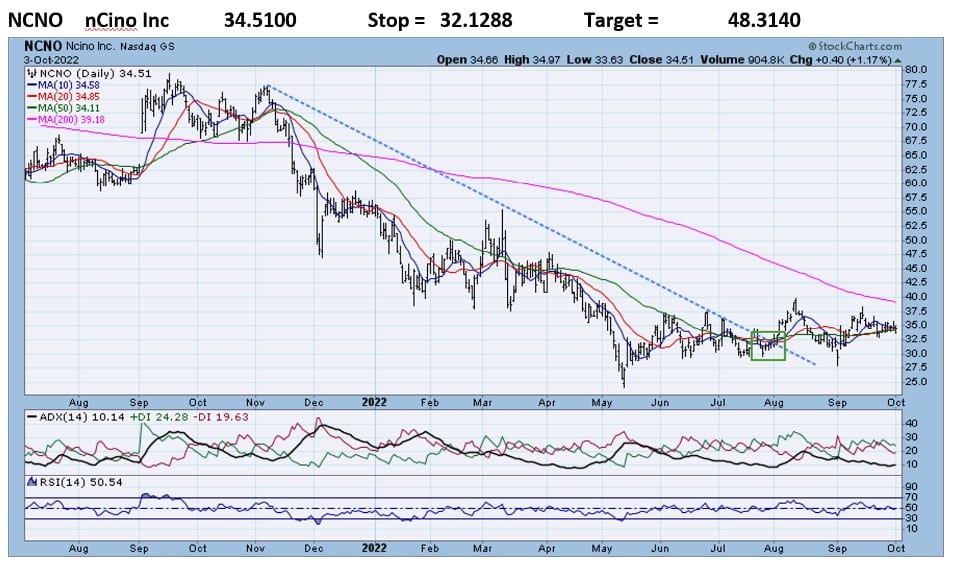
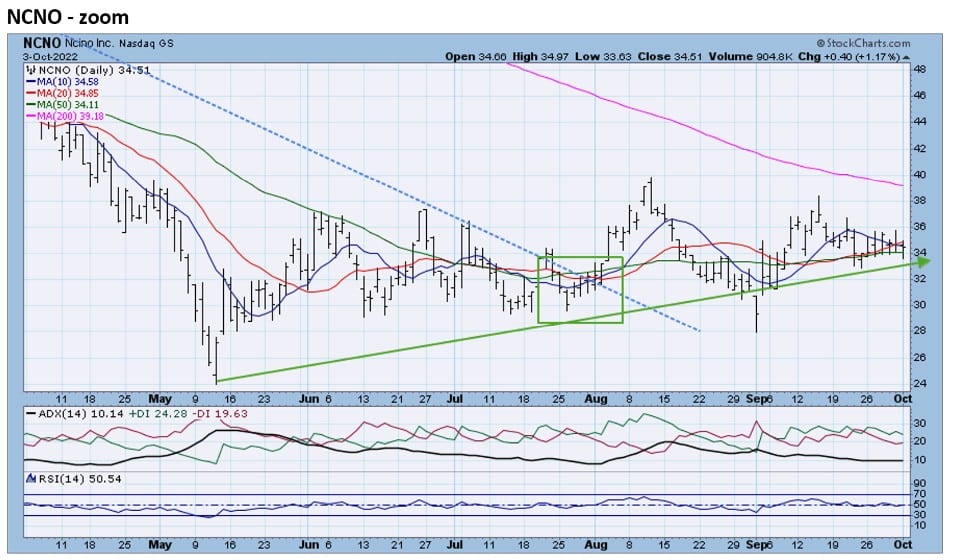
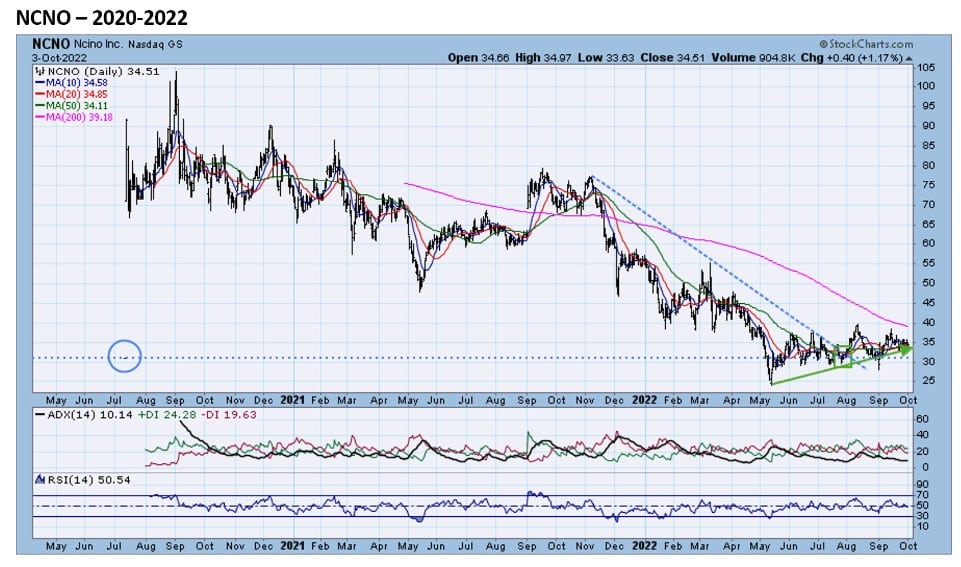
- NCNO rose above its 8-month downtrend line in August. The zoom chart reveals that NCNO has established a pattern of higher lows=uptrend since the May lows. Chart 3 shows the dramatic and brief price history of NCNO. The IPO was on 7/14/20 @ $31. The stock rallied 150%+ on its first day, but has declined over 65% since its 202 highs. NCNO battled with the 29-32 level (around its IPO price) from the end of May to the beginning of September and has seemed to win the war. The next level of resistance is around the 50 level.
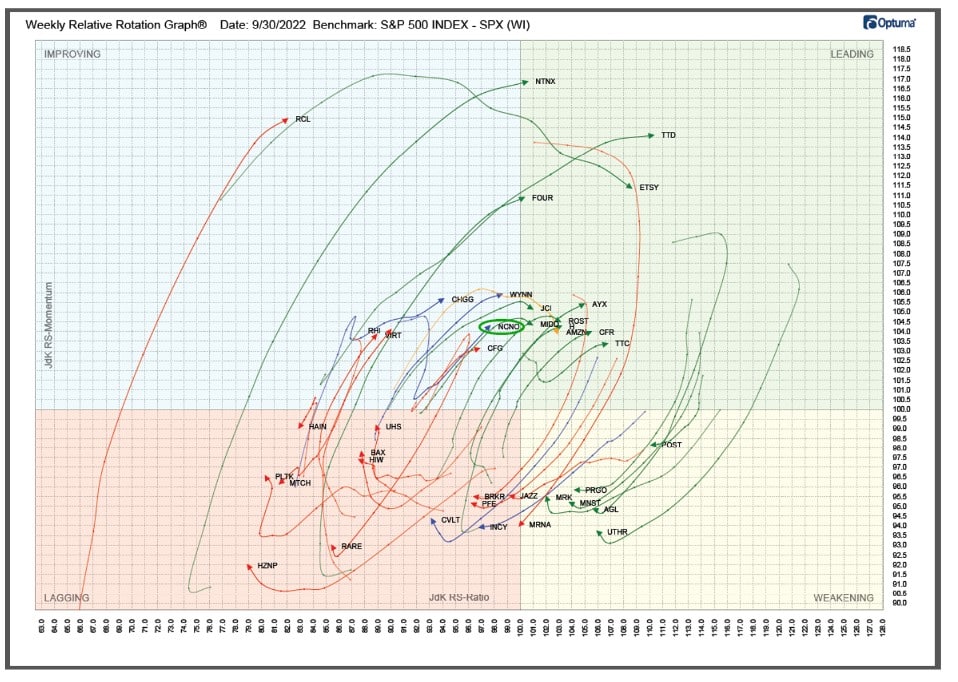
RRG analysis shows that NCNO has moved into the Improving quadrant and is headed for the Leading quadrant. NCNO was one of the TOP 20 stocks in this week’s TPA-RRG Report. (see Top 20/Bottom 20 RRG below).
Relative Rotation Graphs (RRG) – explanation video


Jeff Marcus founded Turning Point Analytics (TPA) in 2009 after 25 years on trading desks and 13 years as a head trader to provide strategic and technical research to institutional clients. Turning Point Analytics (TPA) provides a unique strategy that works as an overlay to clients’ good fundamental analysis. After 10 years of serving only large institutions, TPA now offers its research services to mid and small managers, RIA’s, and wealthy sophisticated individuals looking for a way to increase their returns and outperform their peers.
Subscribe 2 Week Trial
Customer Relationship Summary (Form CRS)