


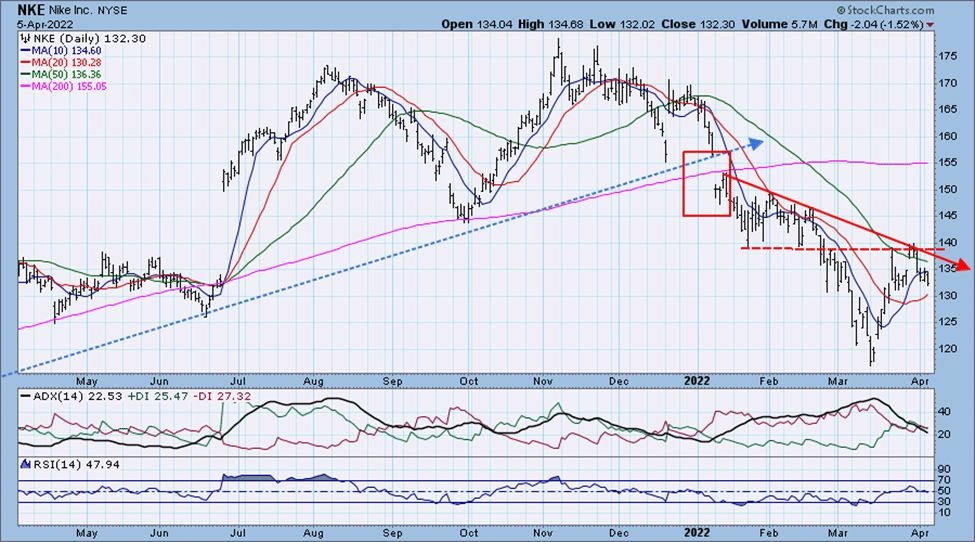
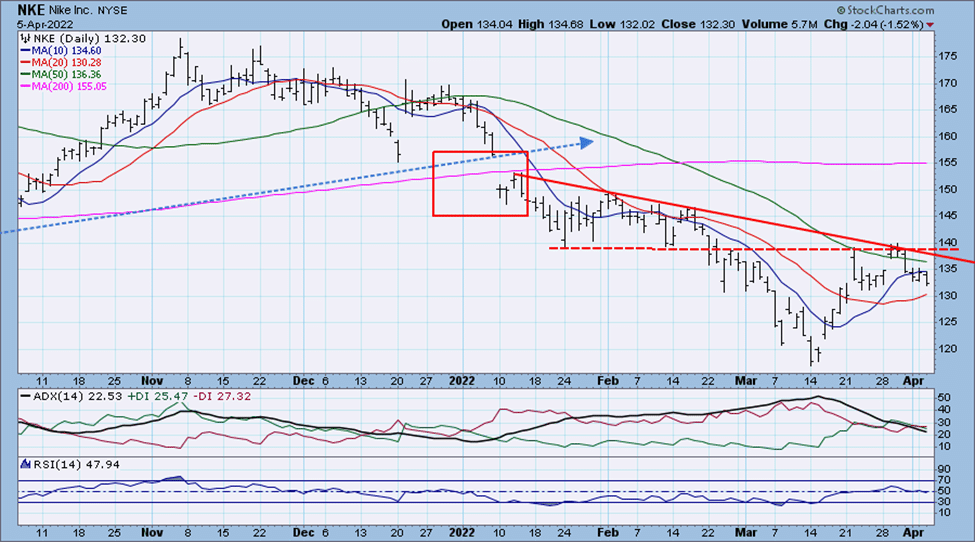
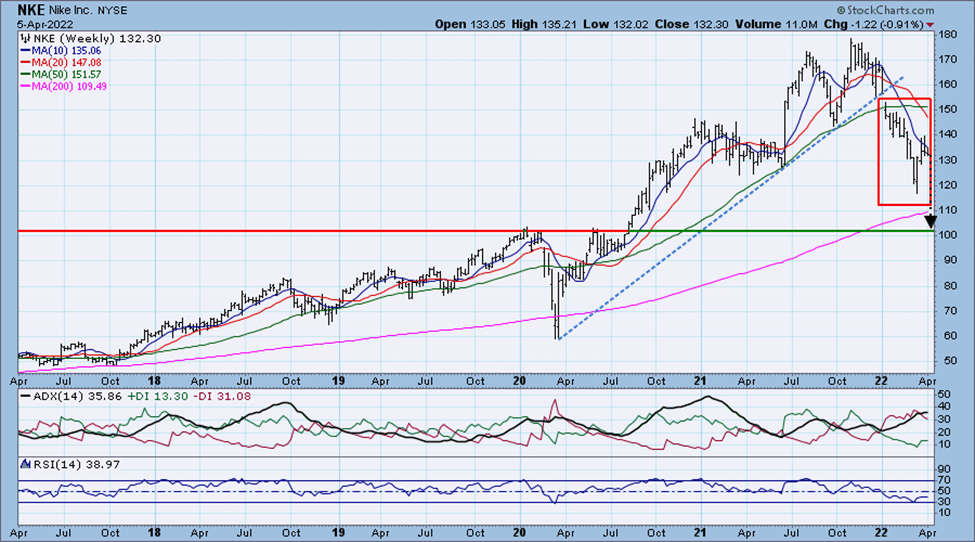
- NKE fell below the 22-month uptrend line in January. TPA recommended selling NKE on 2/3/22. That Sell rec was closed out at 121.21 (P&L +16.59%) in March as it had become oversold. Chart 2 shows that NKE has now rallied 10% in 14 days and is back to downtrend resistance. NKE is also near new short-term resistance at where it broke down in late February (see zoom chart). Long-term support for NKE is far below near the 100 level (weekly chart).
- RRG analysis shows that NKE is firmly in the Lagging quadrant as week relative strength and momentum continue.
NKE Nike Inc. 132.3000 Stop = 140.2380 Target = 105.8400

NKE
NKE – zoom
NKE – weekly
Relative Rotation Graphs (RRG) – explanation video
NKE and the sector RRG


Jeff Marcus founded Turning Point Analytics (TPA) in 2009 after 25 years on trading desks and 13 years as a head trader to provide strategic and technical research to institutional clients. Turning Point Analytics (TPA) provides a unique strategy that works as an overlay to clients’ good fundamental analysis. After 10 years of serving only large institutions, TPA now offers its research services to mid and small managers, RIA’s, and wealthy sophisticated individuals looking for a way to increase their returns and outperform their peers.
Subscribe 2 Week Trial
Customer Relationship Summary (Form CRS)