


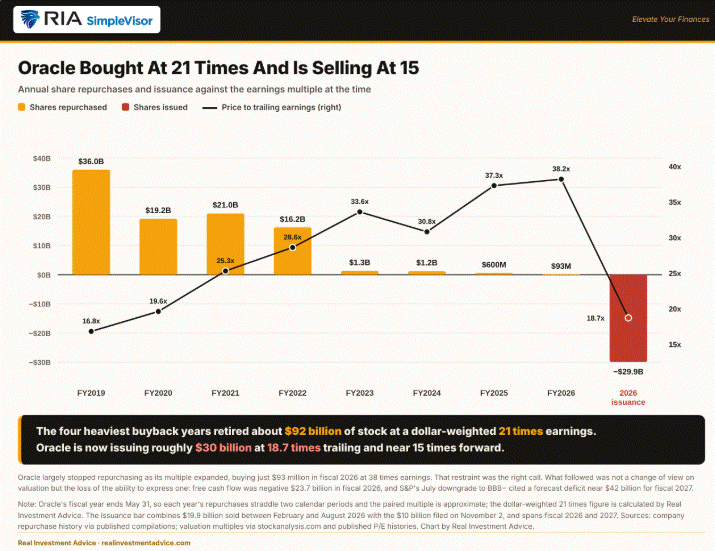
Oracle has repurchased roughly $96 billion of stock since 2019. That tide is turning. As we wrote in Oracle Sells Cheap Stock, they are now sellers, issuing $10 billion in equity, on top of $19.9 billion already issued between February and August. The recent switch from buyer to seller lets us once again highlight the problem with the decade-long spate of record share buybacks. The right way to judge whether a company is efficiently buying back shares and/or issuing them is not by price, but by the valuation at which they occurred. To wit, in 2011 Warren Buffett said:
Charlie and I favor repurchases when two conditions are met: first, a company has ample funds to take care of the operational and liquidity needs of its business; second, its stock is selling at a material discount to the company’s intrinsic business value, conservatively calculated.
Let’s dig into Oracle’s recent history of share repurchases and issuances. Per the chart below, Oracle bought about $92 billion in stock between 2019 and 2022. Weighted by dollars, Oracle retired those shares at roughly 21 times trailing earnings. Buybacks collapsed from 2023 through 2025 because of its $28 billion purchase of Cerner and the associated debt issuance.
Today, Oracle trades at 18.7 times trailing earnings, a one-year low, and roughly 15 times forward earnings compared to a five-year average near 21. Simply put, the shares are relatively cheap, so one would think it’s a good time to resume buybacks. Instead, the company is issuing equity at about 13% below the multiple at which it bought it, and nearly 30% below its own recent norm on forward earnings.
Oracle bought high-quality earnings at 21 times and is selling the same earnings stream back at 15 to 19 times. If it had saved the money for future investment instead of buying back shares, its credit rating would not be on the verge of a downgrade to junk, and it would not rely so heavily on dilutive equity issuance to fund its AI-related investments. Poor judgment designed to bolster the stock price a few years ago leaves the company in a precarious position today.
What To Watch Today
What To Watch Today
Economy (Friday, Nov 6)
| Time (ET) | Release (Period) | Prior | Consensus | Forecast |
|---|---|---|---|---|
| 8:30 a.m. | Nonfarm Payrolls (Oct) | 29K | 65K | 40K |
| 8:30 a.m. | Unemployment Rate (Oct) | 4.2% | 4.2% | 4.2% |
| 8:30 a.m. | Average Hourly Earnings MoM (Oct) | 0.1% | 0.3% | 0.2% |
| 8:30 a.m. | Average Hourly Earnings YoY (Oct) | 3.0% | 2.9% | 3.0% |
| 10:00 a.m. | Michigan Consumer Sentiment, Prelim (Nov) | 48.0 | 48.0 | 47.0 |
| 10:00 a.m. | Michigan 1-Yr Inflation Expectations, Prelim (Nov) | 4.7% | n/a | 4.7% |
| 3:00 p.m. | Consumer Credit Change (Sep) | $8.28B | $12.0B | $11.0B |
Earnings
| Company (Ticker) | Timing | EPS Est. | Rev. Est. |
|---|---|---|---|
| Charter Communications (CHTR) | Before open | $10.06 | $13.48B |
| Humana (HUM) | Before open, 6:00 a.m. | -$1.03 | $40.46B |
| Vistra (VST) | Before open | $2.89 | $7.44B |
| Moderna (MRNA) | Before open | -$1.10 | $888.8M |
Fed speakers: New York Fed President Williams (4:30 a.m.), St. Louis Fed President Musalem (9:10 a.m.), and Vice Chair for Supervision Bowman on supervision and regulation at the University of Mississippi (12:15 p.m.). No market-moving earnings after the close. All times ET.
Market Trading Update: Special Update
Yesterday, we laid out the year-end tailwinds and drew a line in the sand. A close below the Nov 2 low near 7,530 meant the tailwinds had stalled and we would temporarily stop adding exposure. Thursday, the market crossed that line before lunch and never looked back. The S&P 500 fell 4.4% to close at 7,354, the low of the day. The Nasdaq 100 dropped 6.5%, and the semiconductor ETF (SMH) lost 11%. Memory names took the worst of it, with Micron and AMD each down roughly 17%. Nvidia lost 9%. By the close, there was no place to hide, as even Staples and Utilities finished red. Since 1950, the S&P 500 has posted a daily loss that large only 44 times.
So what happened? The trigger was political. Reuters attributed the selling to the Democrats’ sweeping midterm win, which fueled fears of tougher congressional scrutiny of the data-center buildout. That fear has a paper trail. The Sanders/Ocasio-Cortez AI Data Center Moratorium Act would pause construction of new data centers until Congress passes AI regulation. Weak results from Qualcomm and Arm added fuel, and the selling spread to GE Vernova and Constellation Energy.
However, a moratorium bill and a moratorium law are two very different things. Even a Democratic Congress needs a presidential signature, and plenty of Democrats oppose a halt to competition with China. The likely outcome is hearings and headlines, NOT a halt in hyperscaler spending. Earnings for 2027 did not change on Thursday. The multiple investors were willing to pay for them did.
Is a hedge fund blowing up? While there is no evidence of a single fund failure, we often don’t know these things until a few days after the fact. A good example was Leopold Aschenbrenner’s Situational Awareness, the AI-focused hedge fund run by the former OpenAI researcher. At its peak, the fund was about $45 billion. In late July, it was forced to unwind all its publicly held stock positions after steep losses, and the Wall Street Journal reported that Citadel had bought the portfolio. However, we didn’t know that for about two days after the fund collapsed by 67%.
What we can see today are the mechanics of a forced unwind. Goldman’s prime book showed both fundamental and systematic funds lost over 3% in October, a first since 2016. Funds sold existing longs four times faster than they added shorts, which is “de-risking,” not bearish conviction. The problem is that gross leverage remains near 310%, close to a five-year high. When crowded, leveraged positions fall together, risk managers force more selling regardless of fundamentals. Such is the nature of a crowded trade.
Has This Happened After A Midterm Before?
The short answer is no. We went back through every midterm election since 1950. The S&P 500 rallied 1.6% on Wednesday, then fell 4.4% on Thursday. That sequence has never occurred in the two days following a midterm. The worst second-day decline in the prior 19 midterms was a 2.3% drop in 2002. In most years, the two days after a midterm were simply quiet. The only election that comes close is 2008, when the S&P 500 rallied 4.1% on Election Day and then fell about 5% on each of the next two days. That was the middle of a financial crisis, so it is hardly a useful template.
History does offer one caution. The post-election rally after the 2018 midterms failed within days, and the S&P 500 fell 16% into Christmas. Across the prior 19 midterms, the market finished the year higher from the second day after the election only 11 times. Seasonality is a tailwind, not a guarantee.
Deeply Oversold Changes The Math
Notice where the market sits in the chart below. The S&P 500 closed more than 3 standard deviations below its 20-day average, with RSI at 34. It is down roughly 6% from its October peak and sits just above its 200-day average near 7,320. The Nasdaq 100 is now down about 15% from its October peak, a correction by definition. Semiconductors are down 33% from their June high, which is a bear market.
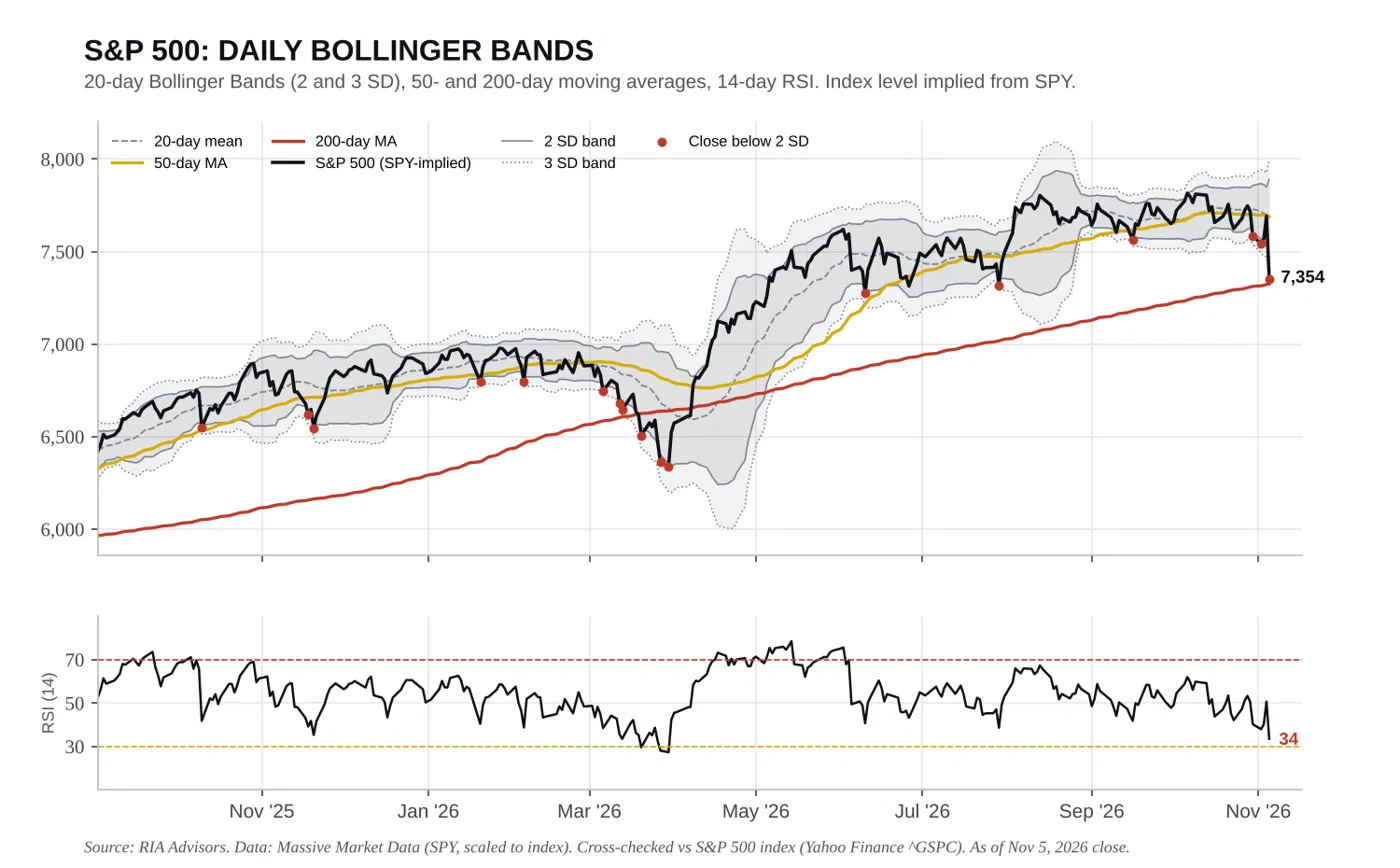
That kind of stretch rarely lasts. Since 1950, the S&P 500 has closed 3 standard deviations below its 20-day average while still above its 200-day average 27 times. One month later, the index was higher in 23 of those cases, with a median gain of 2.4%. Three months later, it was 22 times higher, with a median gain of 6.2%. When the long-term trend holds, extreme oversold readings have historically been buying opportunities rather than the start of something worse. One of the exceptions was October 2018, and the difference came down to whether the 200-day average held.
So, is this a buying opportunity? A skeptic would argue we just told you not to fight the tailwinds. Fair enough. We said the trend was supportive until 7,530 broke, and it broke. Our rules said to stop adding exposure, and we are following them. That does not mean we sell everything, but it also doesn’t mean that opportunities to buy strong companies at a discount aren’t becoming available.
Bob Farrell’s Rule #9 reminds us that when everyone agrees, something else tends to happen. Two weeks ago, everyone agreed AI was the trade. Today, everyone agrees it’s broken. Neither extreme tends to be right.
Our plan is simple. The test of the 200-day average is here, and now it has to hold. A reflexive bounce toward the 20-day average near 7,680 is likely in the days ahead, and we will use that rally to rebalance risk rather than chase it. If the market then retests and holds the 200-day average, with semiconductors reversing, we will start adding to our growth exposure in measured tranches. A sustained break below 7,320 shifts the playbook toward something closer to 2018. Until then, patience is a position.
“Corrections always look like opportunities in hindsight. In real time, they just look like losses.”

Hiking Into Disinflation
Last week, in our article Warsh Is Promising Something The Fed Can’t Control, we made a simple point:
The Fed controls the overnight interest rate. It does not control the Strait of Hormuz,” and “it does not decide whether a handful of companies spend $600 billion next year or $400 billion.
We wanted to show how the Fed risks a policy error by hiking rates to dampen the recent spurt in inflation. Importantly, we noted that inflation drivers- oil and AI capex-related inflation- are largely beyond the Fed’s control. The inflation outlook just changed, and it’s not because of the Fed’s hawkish policy, raising the question of whether a December rate hike is appropriate.
On October 30th, crude oil peaked at $104. Today it sits below $90, its lowest level since August 31. This sharp decline stemmed from rumors of a pending agreement, President Trump pulling back from promises to attack Iran, and investors betting the Democrat-led Congress pushes toward ending the Iran war.
The second inflationary force that gets less attention is the AI buildout. J.P. Morgan estimates DRAM prices will rise more than 400% between early 2024 and the end of this year. The CPI for software and accessories is up 23% since the end of 2024, and import prices for computers and parts are up 37%. Their economists put the lift to core inflation at 0.2 to 0.4 percentage points.
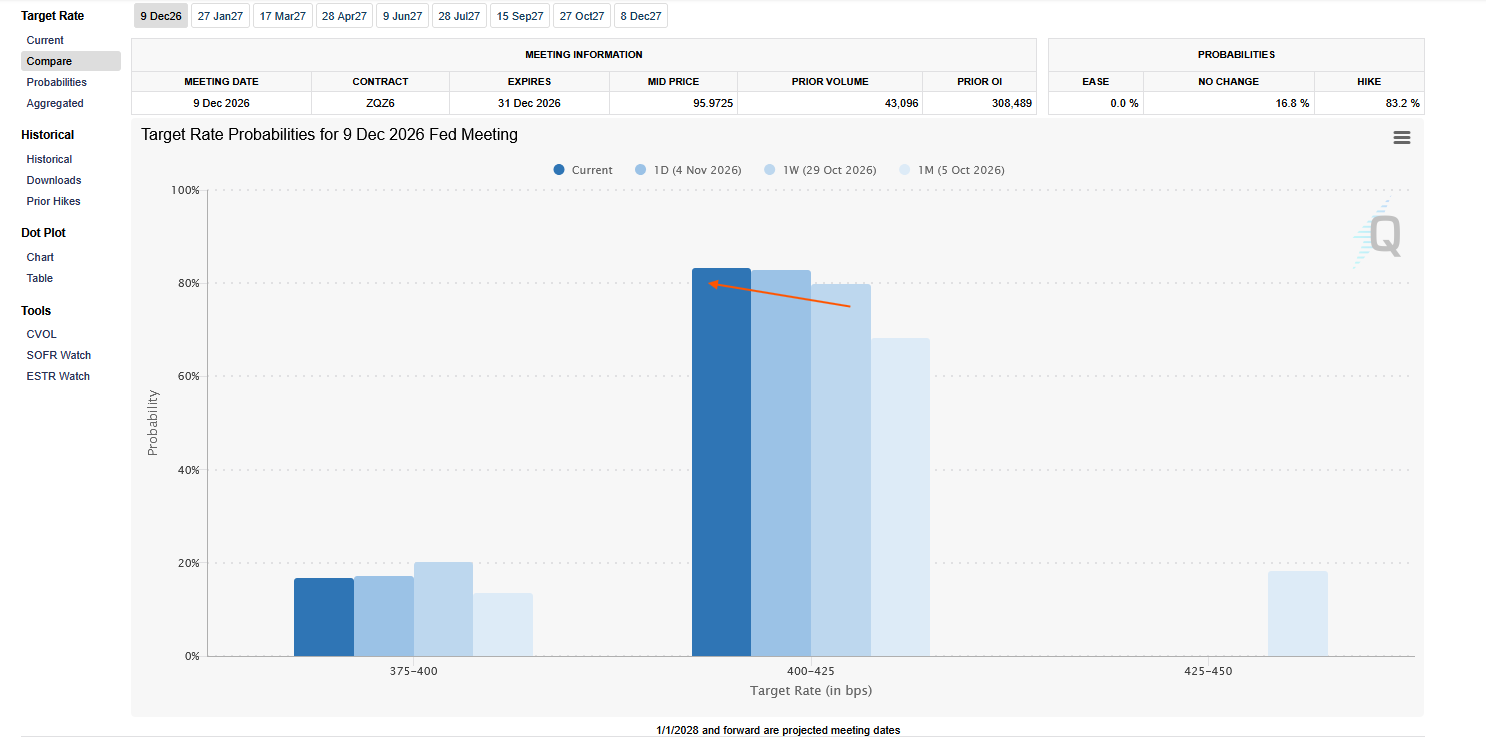
With the potential for peace in the Middle East and political pressure to slow down capex spending, the December Fed math improved. However, the graphic below, courtesy of the CME, shows that despite the election and lower oil prices, the market remains steadfast that the Fed will hike rates.
The question worth considering, as we have opined plenty on, is whether the Fed is making a mistake by raising rates to combat inflation it can’t control.

Tweet of the Day
Trading Rules With Desktop Printout
“Want to achieve better long-term success in managing your portfolio? Here are our 15-trading rules for managing market risks.”
Please subscribe to the daily commentary to receive these updates every morning before the opening bell.
If you found this blog useful, please send it to someone else, share it on social media, or contact us to set up a meeting.