


Our first article of the year, January Stats & New Year Investing Resolutions for 2024, provides a review of what we might expect in 2024. 2024 is a little unique as the upcoming presidential election will certainly be a critical factor driving markets. Election years tend to have better performance. This occurs in part because the incumbent can take action to encourage investor enthusiasm. In turn, more robust markets improve consumer sentiment. Such boosts the incumbent’s chances of winning as well as those of their party in the Senate and the House.
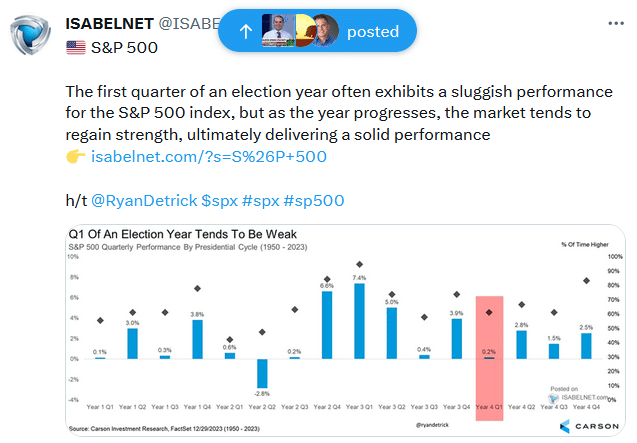
The graphs and tables below provide historical context as to what we might expect heading into this presidential election. The table on the top left shows that in the year of the last 20 presidential terms, only two have been negative. The most recent being the financial crisis in 2008. The graph on the top right highlights that the S&P 500 has the best winning percentage in the final year of the president’s term. In all years, positive years beat negative years by slightly over two to one. However, in the year of the presidential election, up years outnumber down years by three to one. The Tweet of the Day shows the first quarter may be lackluster, but the next three quarters should provide solid returns.
While history favors a good year, there are other factors that can result in something different than what we have become accustomed to in presidential election years.

What To Watch Today
Earnings
- No notable earnings releases
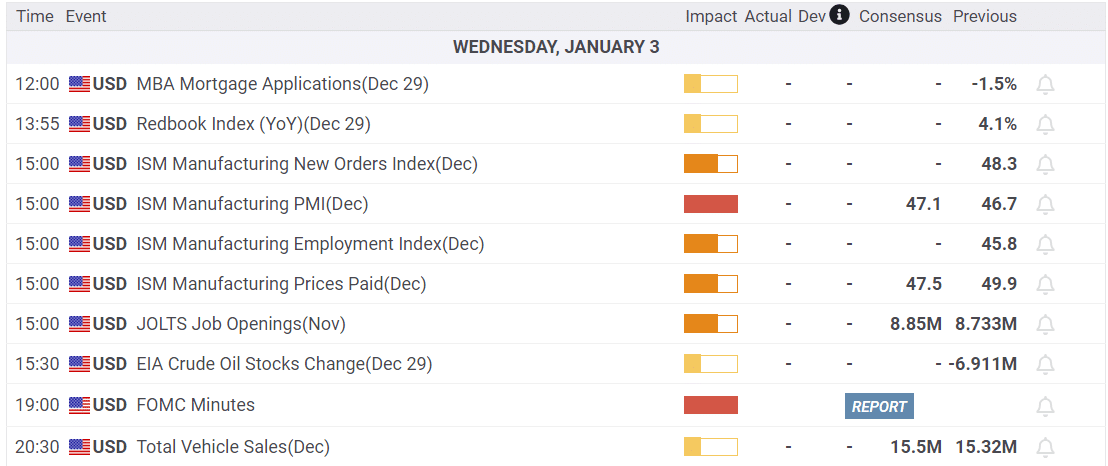
Economy
Investing Summit: Early Bird Registration Available Now
January 27th, we are hosting a live event featuring Greg Valliere to discuss investing in the 2024 presidential election. What will a new president mean for the markets, the risks, and where to invest through it all? Greg will be joined by Lance Roberts, Michael Lebowitz, and Adam Taggart for morning presentations covering everything you need to know for the New Year.
Register now, as there are only 150 seats. The session is a LIVE EVENT, and no recordings will be provided.

Market Trading Update
As we discussed last week, the market was very overbought and deviated above moving averages, so a correction was likely. That correction started on Friday and continued through yesterday. Of note was the negative divergence between the Relative Strength Index (RSI) and the market, as shown. That weakening of relative strength as the market rose was a warning sign for an eventual correction. The downside remains limited at the moment, and the selling pressure was mostly relegated to last year’s best performers. The question is whether yesterday’s rotation into Healthcare and Energy stocks is the beginning of a new trend or just a temporary stop before the Technology chase resumes.
Continue to hold some extra cash, and we think we will have a better entry point to increase portfolio exposures in the next few days.


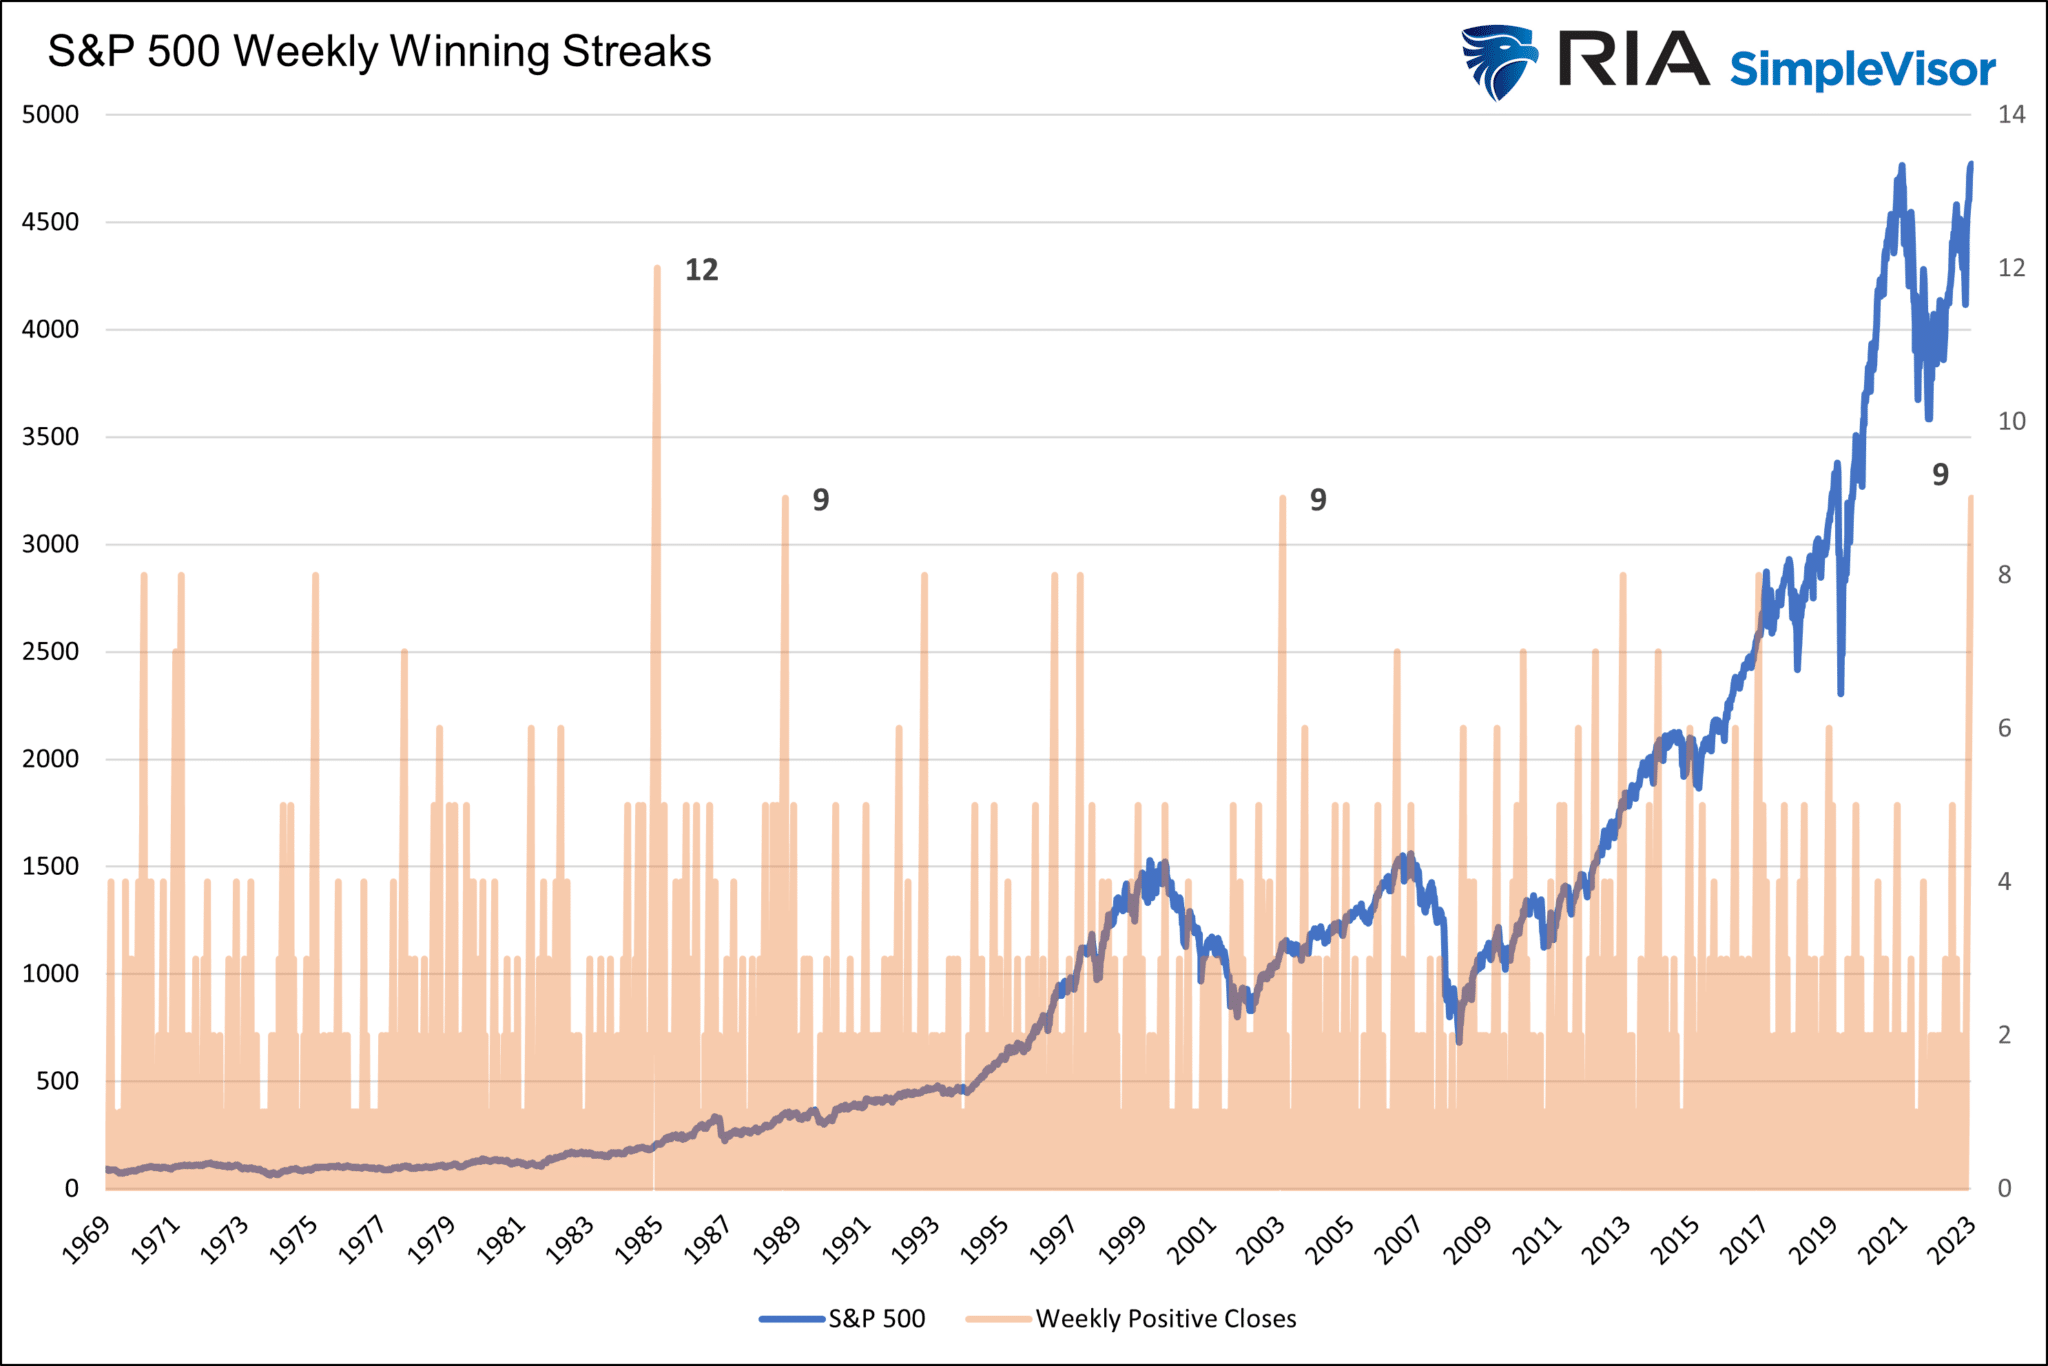
The S&P 500 Is Up 9 Weeks In A Row
As we share below, the S&P 500 has risen 9 weeks in a row. That is the longest such streak in over 20 years. Since 1969, there were two other 9-week winning streaks for the S&P 500 and one that lasted 12 weeks. The 12-week streak was followed by an 18% return in the following 12 months. Conversely, the 12-month returns following the two prior 9-week streaks were not as promising, with a near 0% return in both instances.
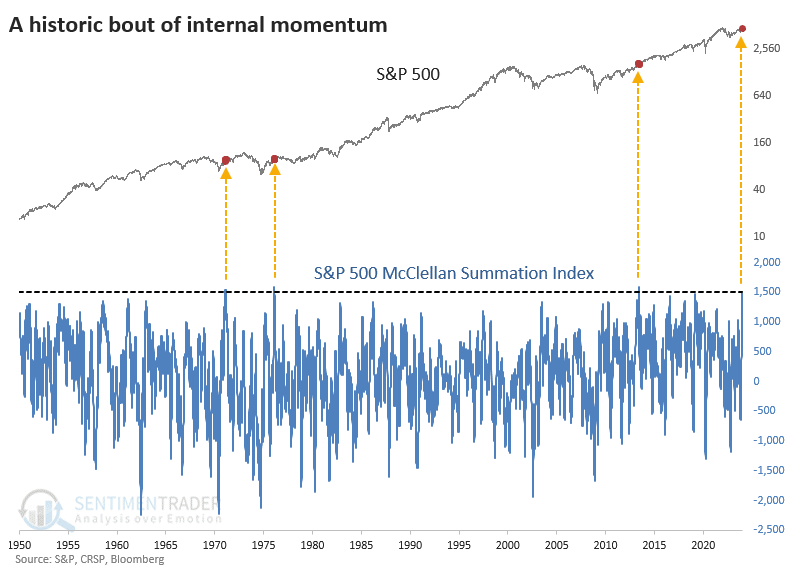
Historical McClellan Momentum Readings
With the 9-week winning streak for the S&P 500, we also find the McClellan Summation Index is near 1500. Such a level has only occurred three other times since 1950. Interestingly and unlike today, all three were after bear markets. Per Stockcharts:
Developed by Sherman and Marian McClellan, the McClellan Summation Index is a breadth indicator derived from the McClellan Oscillator, which is a breadth indicator based on Net Advances (advancing issues less declining issues). The Summation Index is simply a running total of the McClellan Oscillator values.
Tweet of the Day
“Want to have better long-term success in managing your portfolio? Here are our 15-trading rules for managing market risks.”
Please subscribe to the daily commentary to receive these updates every morning before the opening bell.
If you found this blog useful, please send it to someone else, share it on social media, or contact us to set up a meeting.
Post Views: 5
2024/01/03