


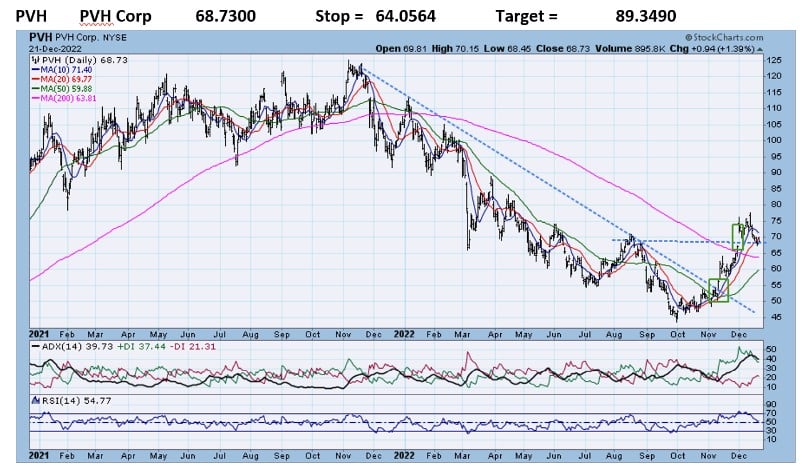
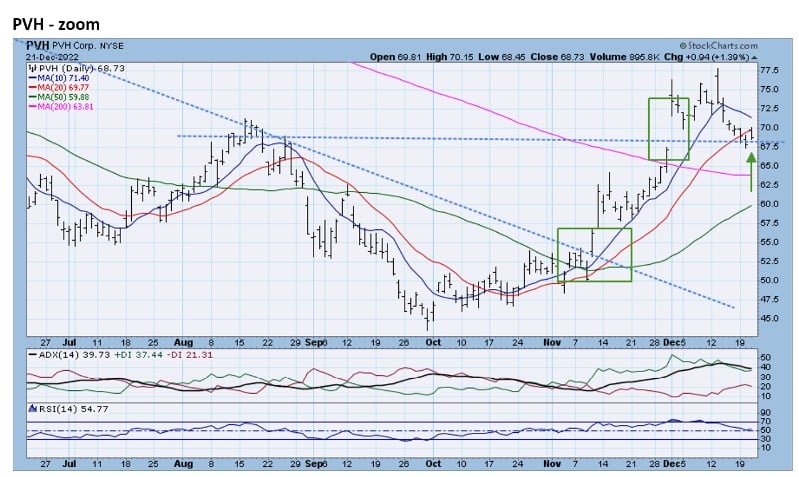
- PVH rose above its steep 12-month downtrend line in November. PVH then proceeded to break out above the August highs on a big gap-up day in November (zoom chart). Both are long-term positives. These breakouts mean a large potential upside for BURL as it declined over 60% from the November 2021 highs to the October 2022 lows. PVH is still down 45% from the 2021 highs.
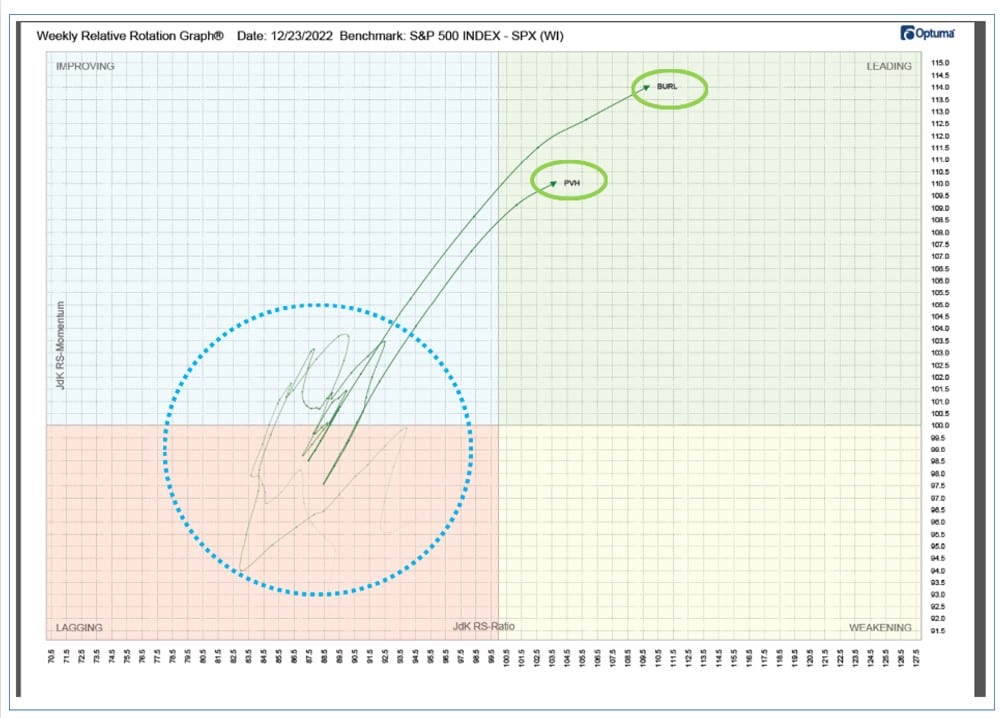
RRG analysis shows that after spending many weeks stuck in the Lagging quadrant, PVH is now firmly in the Leading quadrant. (RRG below).
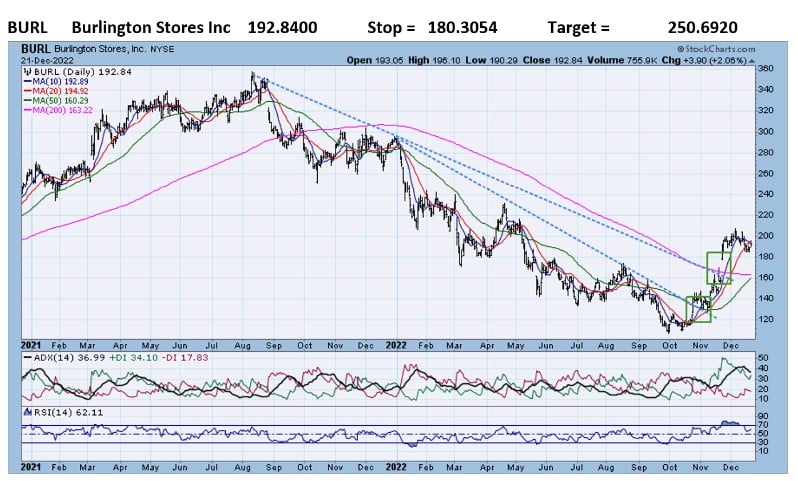
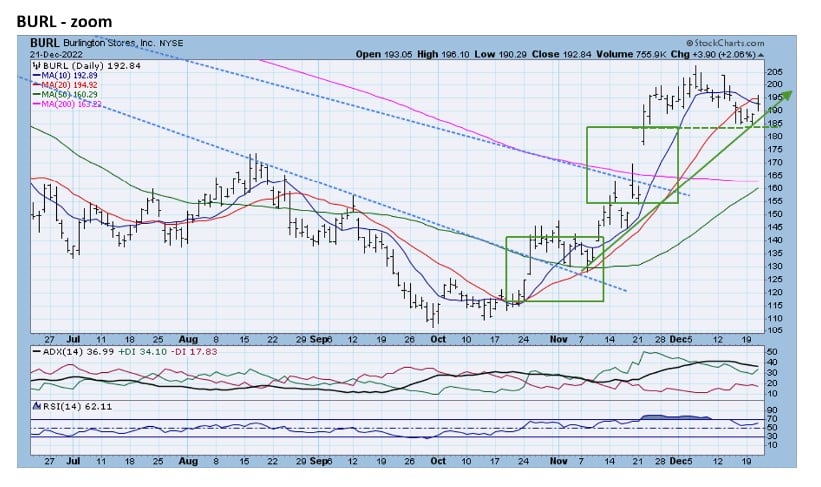
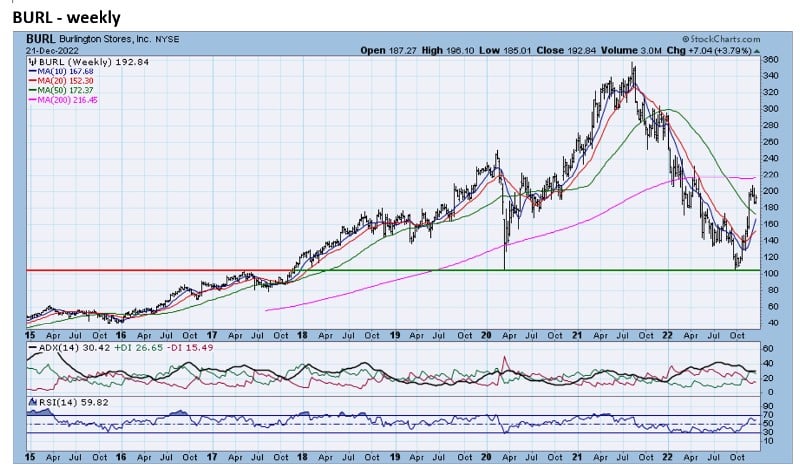
- BURL rose above its steep 14-month downtrend line at the end of October. BURL also moved above the 2022 downtrend line in November on a big gap-up day. The zoom chart reveals that BURL is now at support from both the gap-up day and the newly formed uptrend line from the November breakout. The weekly chart reveals that the inflection point for BURL’s steep decline was long-term support at 100.
RRG analysis shows that after spending many weeks stuck in the Lagging quadrant, BURL is now firmly in the Leading quadrant. (RRG below).
Relative Rotation Graphs (RRG) – explanation video


Jeff Marcus founded Turning Point Analytics (TPA) in 2009 after 25 years on trading desks and 13 years as a head trader to provide strategic and technical research to institutional clients. Turning Point Analytics (TPA) provides a unique strategy that works as an overlay to clients’ good fundamental analysis. After 10 years of serving only large institutions, TPA now offers its research services to mid and small managers, RIA’s, and wealthy sophisticated individuals looking for a way to increase their returns and outperform their peers.
Subscribe 2 Week Trial
Customer Relationship Summary (Form CRS)