Q4 Market Outlook: Strong Years Usually Finish Strong
By Lance Roberts | October 3, 2026
Share
🔎 At a Glance
🏛️ Market Brief -Bond Yields Hit A 24-Year High
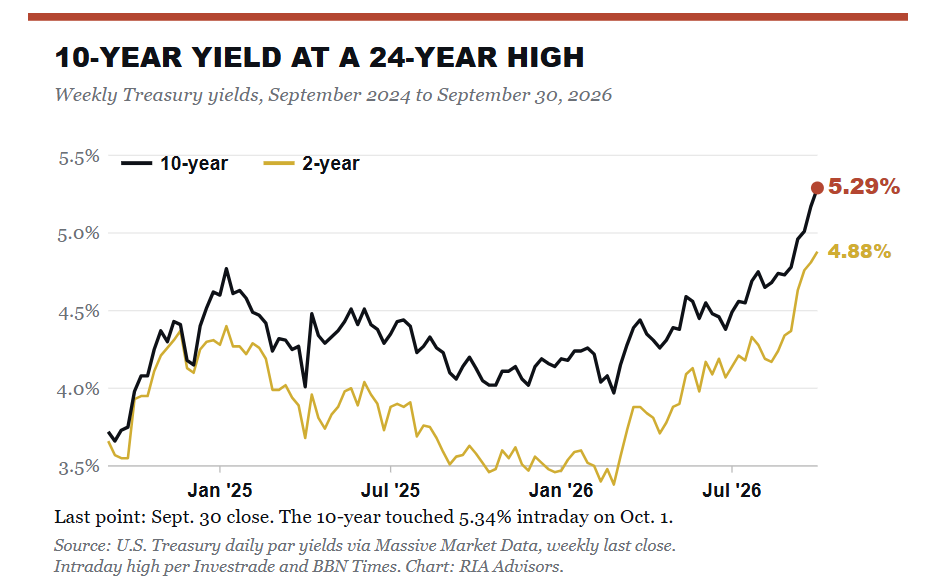
The bond market ran the show this week. On Thursday, the 10-year Treasury yield touched 5.34%, its highest level since April 2002. It eased back to roughly 5.28% by Friday. The 30-year yield pushed toward 5.67%. Stocks absorbed the shock better than you might expect. The S&P 500 slipped 0.3% to 7,722.72. Meanwhile, the Nasdaq-100 gained 0.7% as Nvidia set a record, topping $5.7 trillion in market value. The Dow lagged, with banks and other rate-sensitive names taking the brunt.
Two weeks ago in “The Fed Rate Hike Won’t Fix The Inflation It Targets,” I argued that rate hikes can’t cure a supply shock. This week’s data made that case for me. TheISM manufacturing indexheld steady at 54.5, but its prices component jumped 6.8 points to 77.9. That’s the highest reading since the Iran war began, and not a single commodity reported a price decline. Brent crude finished near $103 a barrel on reports of more U.S. military deployments to the Middle East, even after the G7 agreed to release strategic reserves.
Then Friday’s jobs report flipped the script. The economy added just 29,000 jobs in September against expectations closer to 85,000. Revisions erased another 60,000 jobs from the July and August totals. Unemployment rose to 4.2%, while wage growth slowed to 3.0%. Bad news became GOOD news as traders cut the odds of an October rate hike to roughly 18%. Subsequently, yields backed off their highs, and the S&P 500 rallied 0.7% on Friday on the bet that a cooling labor market will force the Fed to stop tightening, even as pipeline inflation keeps climbing.
Make no mistake, that combination has a name. Weaker hiring and hotter input prices aretwo ingredients of “stagflation,”the third is weak economic growth, which is not happening at the moment, with Q3 estimates north of 4%. That’s the risk of the Fed hiking into an oil shock, stalling economic growth. The yield itself is also a problem for stocks. At more than 5%, the 10-year Treasury offers investors a risk-free return that equities haven’t offered since 2002. That’s the “there is no alternative” trade running in reverse.
Leadership stayed narrow. Technology gained 1.8% and energy 1.5%. Health care (−2.7%), financials (−2.5%), and communication services (−2.3%) led the decline. The equal-weight S&P 500 fell 0.7%, trailing the cap-weighted index again. Gold dropped 3.4% as the dollar firmed.
The macro thread for next week is simple. If the 10-year holds above 5% through Wednesday’s auction and minutes, rate-sensitive stocks stay under pressure. A slide back below 5% would give the rest of the market room to breathe.
📈Technical Backdrop– Range Holds, Breadth Keeps Cracking
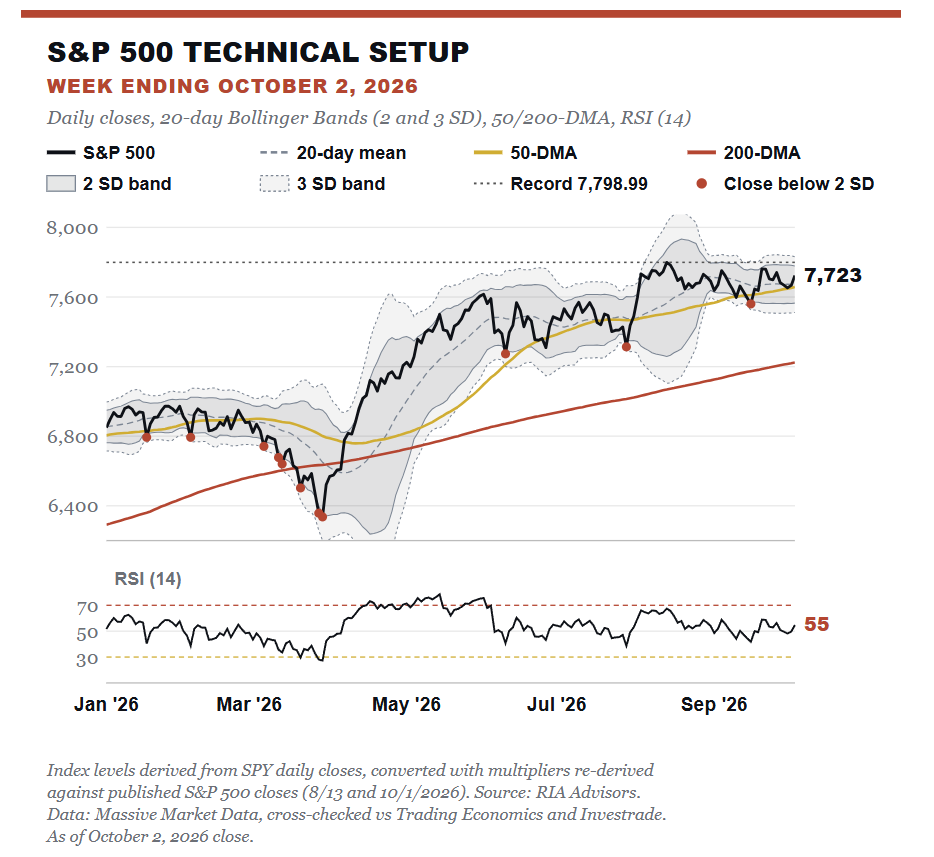
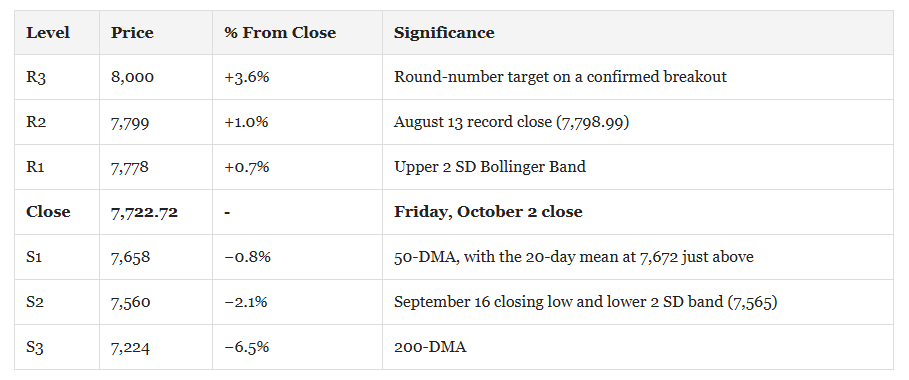
The S&P 500 closed Friday at 7,722.72, down 0.3% for the week. It’s still trapped inside the range that has held since early August. That range runs from the September 16 closing low near 7,560 up to the August 13 record of 7,798.99. The index sits 0.9% above its 50-DMA at 7,658 and 6.9% above its 200-DMA at 7,224. The 14-day RSI reads 55, squarely neutral. MACD is still positive at about 10 index points, but slipped just below its signal line this week. That’s a mild loss of momentum rather than a breakdown.
The Bollinger Bands tell the same story. Price sits about one standard deviation above its 20-day mean of 7,672. The upper 2 SD band is at 7,778, just under the record. Such is the problem with this range. The upper band and the record converge at the points where sellers stepped in on August 13, September 3, and September 21. Until the index can close above that zone, rallies toward 7,800 are places to trim rather than chase.
The technical support and resistance levels remain key this week as the Q3 earnings season gears up. All-time highs remain within reach, and support sits immediately below market prices.
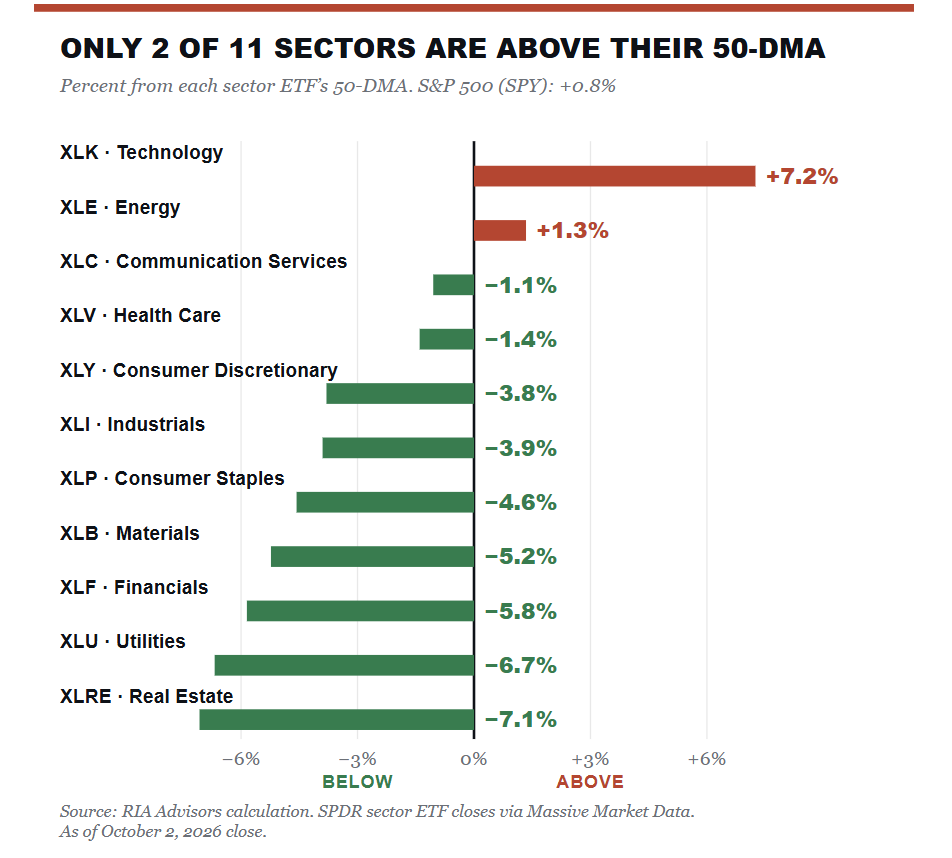
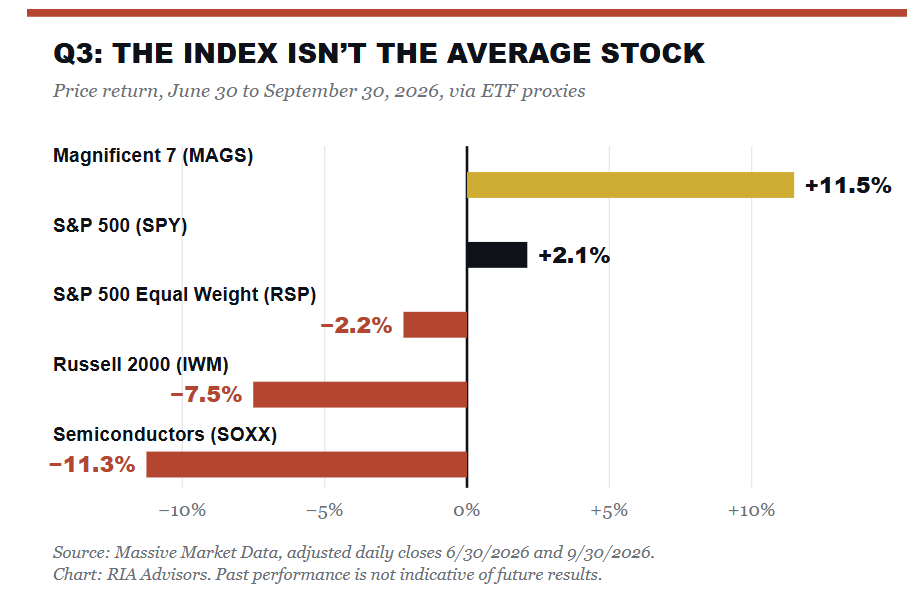
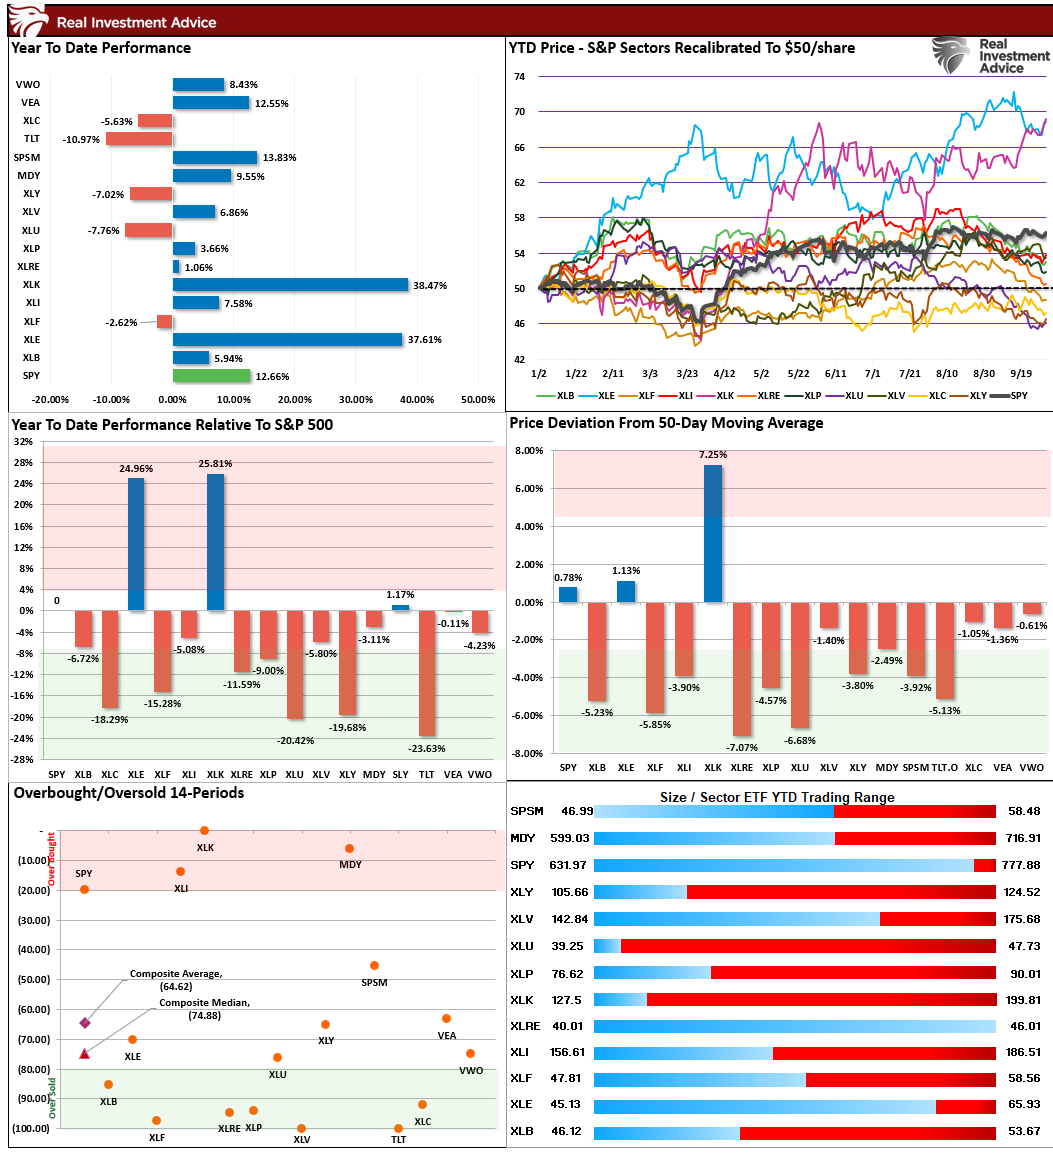
The bigger issue is underneath the index. Only two of the 11 S&P 500 sectors, technology and energy, closed above their own 50-day moving averages on Friday. Technology sits 7.2% above its average. Real estate (−7.1%), utilities (−6.7%), and financials (−5.8%) sit deep below theirs. The ratio of equal-weight to cap-weight has dropped 4.4% since June 30. That’s a narrow tape. When one sector carries the market while nine others trade below their averages, the index can hold up for a while, but it grows more vulnerable to a stumble in the handful of mega-cap technology names doing the lifting.
Dispersion cuts both ways, though. The skeptics will tell you a market this narrow has to break, and eventually they may be right. However, deeply oversold sectors are exactly where a “broadening” rally would come from. Real estate, utilities, and financials are the groups most hurt by rising yields. They also have the most room to snap back if Friday’s pullback in rates continues. A retreat in the 10-year below 5% would likely do more for market breadth than any earnings report.
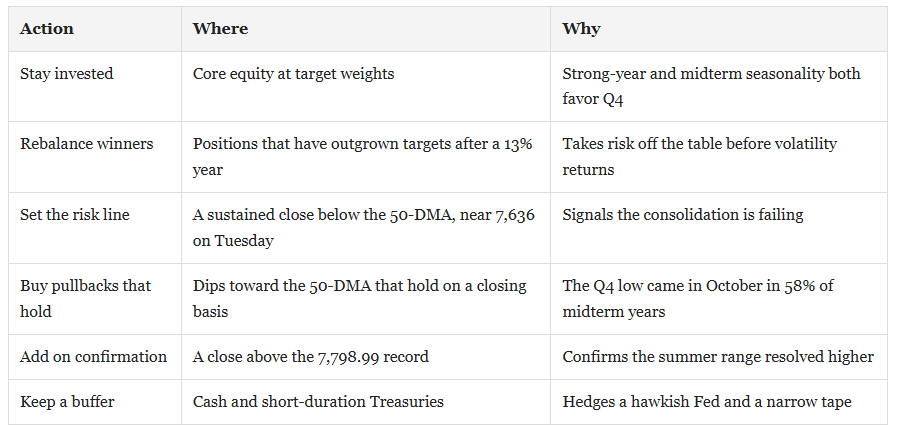
For the coming week, patience pays at the top of the range. We continue to recommend trimming positions that have run toward the record and rebalancing back to target weights. Pullbacks that hold the 50-DMA near 7,658 are buyable. A close above 7,800 on strong volume would confirm a breakout and open a path toward 8,000. A close below 7,560 would break the range. That’s where we’d raise hedges and tighten stops, with the 200-DMA near 7,224 as the next support.
The single level to watch next week is 7,800. Clear it, and the summer consolidation resolves higher. Fail there again, and the range is likely to continue, with the risk tilted toward the 7,560 floor.
🔑 Key Catalysts Next Week
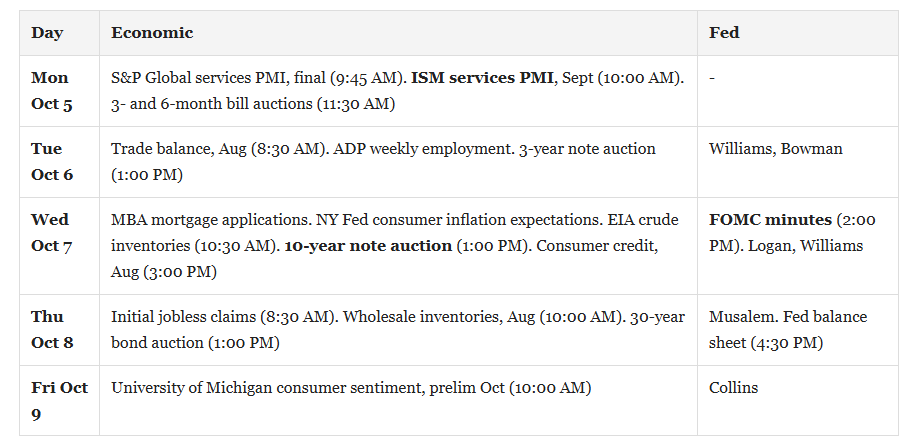
Next week comes down to one question: can the bond market find a ceiling? Wednesday’s FOMC minutes will show how many officials wanted more tightening after September’s unanimous quarter-point hike. Friday’s jobs data cut the odds of an October hike to about 18%. The minutes will tell us whether the committee shares the market’s newfound calm.
The auction calendar matters more than usual. Treasury sells 3-year notes on Tuesday, 10-year notes on Wednesday, and 30-year bonds on Thursday, all with yields sitting at or near multi-decade highs. A weak 10-year auction on the same afternoon as the minutes could push yields back toward this week’s 5.34% peak.
Monday’s ISM services index (consensus: 55.7) will show whether price pressures are spreading beyond factories. August’s services price index already sat at 72.6. Tuesday brings the August trade balance, and Wednesday brings consumer credit. Jobless claims matter more now. After a 29,000 payroll print and 60,000 in downward revisions, a jump in Thursday’s claims above the 195,000 consensus would confirm that the labor market is cracking faster than the Fed’s projections assume. Friday’s preliminary University of Michigan sentiment reading, expected near 48, closes the week.
Fed speakers fill the calendar. New York Fed President John Williams speaks Tuesday and Wednesday, and Governor Michelle Bowman speaks on Tuesday. Dallas Fed President Lorie Logan follows on Wednesday, St. Louis Fed President Alberto Musalem on Thursday, and Boston Fed President Susan Collins on Friday.
Third-quarter earnings season gets its unofficial start. PepsiCo reports Thursday before the open, giving a read on how consumers are handling higher prices. Delta follows Friday morning. Bank earnings kick off in earnest the week after.
The most market-moving stretch is Wednesday afternoon. The 10-year auction and the FOMC minutes land within an hour of each other. Strong demand and a less hawkish tone would pull yields back below 5% and give the oversold rate-sensitive sectors room to rally. A sloppy auction paired with hawkish minutes is the asymmetric risk, putting 5.5% on the 10-year in play.
Need Help With Your Investing Strategy?
Are you looking for comprehensive financial, insurance, and estate planning services? Need a risk-managed portfolio management strategy to grow and protect your savings? Whatever your needs are, we are here to help.
💰 Q4 Market Outlook: Strong Years Usually Finish Strong
Since early August, the S&P 500 has gone nowhere in a hurry. The index has chopped between roughly 7,550 and 7,800 on a closing basis. It never reclaimed the August 13 record of 7,798.99, nor did it break down. As we warned in “September Market Weakness: The Setup Has Teeth,” the buyers who carried August were leaving the table. That’s exactly what happened. Last week, we looked at whyJefferies’ 9,000 target needs everything to go right over the next fifteen months.
But what about the Q4 market outlook? A recent note by Jason Zwieg from the WSJ made a great point:
“It’s almost October. In the northern hemisphere, October has long been a time for reaping—but also for sowing.
Yes, in 1987 the stock market crashed on Oct. 19, falling more than 20% in a single day. Over the five days ended Oct. 10, 2008, as the global financial crisis intensified, U.S. stocks lost 18%, the worst week then on record. The panic of 1907, which devastated the U.S. banking system, also erupted in October. Some researchers have even argued for a “Halloween indicator,” which steers clear of stocks until after Oct. 31.
And many investors, in my experience, worry that October is cursed by the market gods.
Well, then, so is January, when the horrific bear market of 1973-74 began, initiating a 48% wipeout. So is February, when the 22% swoon of 1966 started—and the pandemic panic of 2020. So is March, which kicked off the beginning of the disastrous bear market of 2000-02, when tech stocks fell by about 80%—and the second-worst market downdraft on record, from 1937 to 1942, when the stock market lost 60%. So is April, which in 2011 was the start of a 19% drop that ended at the beginning of October.”
Jason concluded with a famous quote:
OCTOBER: This is one of the peculiarly dangerous months to speculate in stocks. The others are July, January, September, April, November, May, March, June, December, August, and February.– Mark Twain
Yes, the market could crash this month, such is always a possibility in any given month, as Jason notes above. However, the market won’t crash just because it’s October, and this year, there are a surprising number of things lining up in the bulls’ favor.
Q4 Market Outlook: History Rewards A Strong First Nine Months
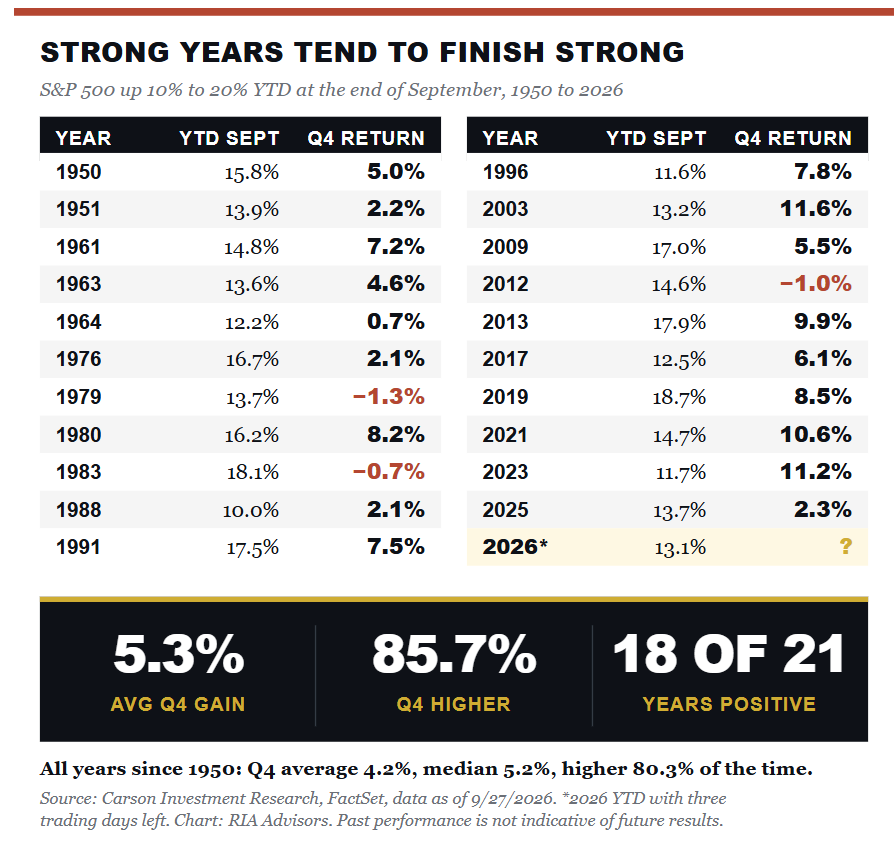
Start with the statistic that matters most. Ryan Detrick at Carson Investment Research screened every year since 1950 when the S&P 500 entered Q4 up 10% to 20%. There are 21 of them. The fourth quarter finished higher in 18, an 85.7% hit rate. The average gain was 5.3%, with a median of 5.5%. For all years since 1950, Q4 averaged 4.2% and rose 80.3% of the time.
Q4 gained in 18 of the 21 “sweet spot” years. Only 1979, 1983, and 2012 finished lower, and none lost more than 1.3%.
As of September 27, the S&P 500 was up 13.1% with three trading days left, which puts 2026 squarely in that group. The losing years are worth a look. They were shallow. Across 21 observations, the worst fourth quarter was a 1.3% decline in 1979, while the best was an 11.6% gain in 2003, and eight of the 21 years delivered 7.5% or more. The asymmetry in this sample is the real story, because the misses were small and the hits were large. I rebuilt the table using Carson’s figures and got an average of 5.24% rather than 5.3%. That rounding difference changes nothing.
The Midterm Calendar Adds A Second Tailwind
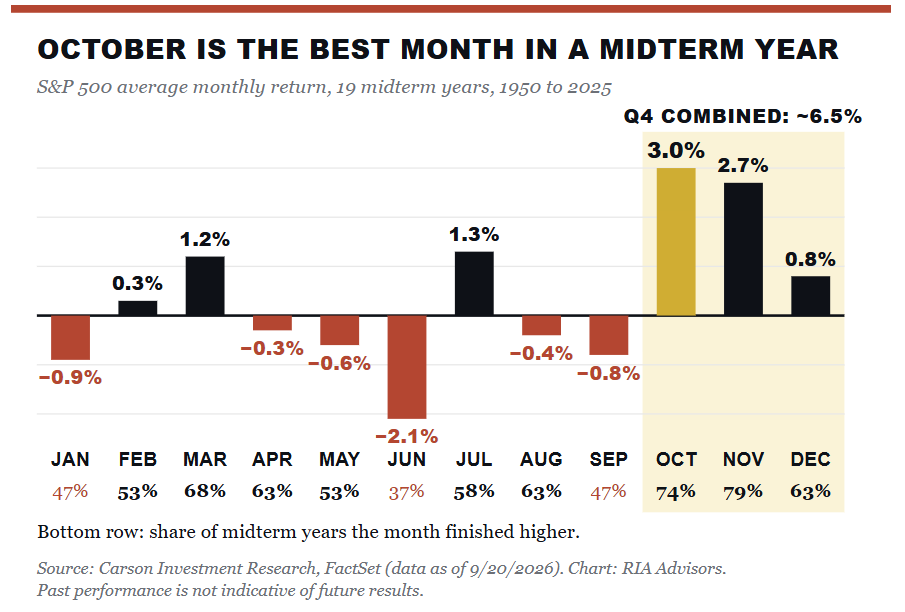
The second layer is political. As I noted in Tuesday’s Daily Market Commentary, October is the best month of midterm years since 1950. It averages a 3.0% gain and finishes higher 73.7% of the time. November isn’t far behind at 2.7%, and it’s the most consistent month on the midterm calendar, closing higher 78.9% of the time. Add the three fourth-quarter averages together, and you get roughly 6.5%.
October (3.0%) and November (2.7%) are the two best months of the midterm calendar. June’s 2.1% average decline is the worst.
Such is the typical rhythm of a midterm year. Markets dislike uncertainty, and the months before a midterm vote are full of it. Once the ballots are counted, even a gridlocked result removes a variable, and money that sat out the summer tends to come back. One more detail makes this more useful than it looks. Only one year, 1950, appears in both the strong-year and midterm samples. These are two largely independent tailwinds, not one signal counted twice. Seasonality is a tailwind, NOT a guarantee.
Earnings Estimates Are Rising, Which Rarely Happens
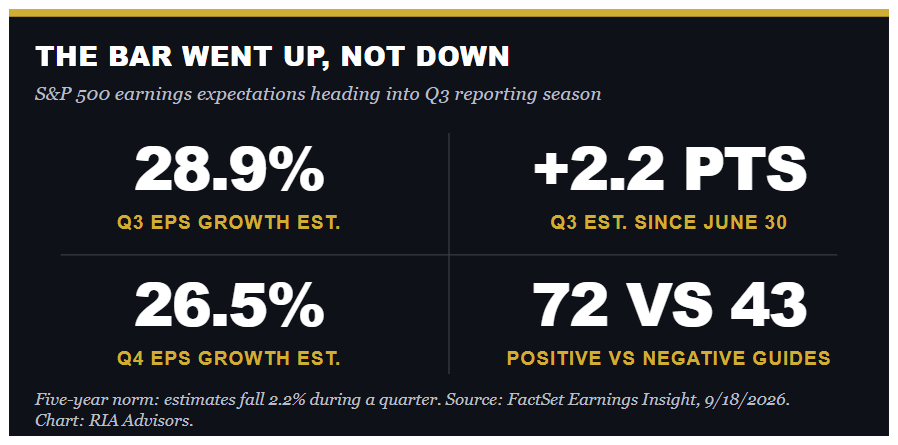
The fundamental case is where this quarter gets interesting. According toFactSet’s September 18 Earnings Insight, analysts expect Q3 earnings growth of 28.9% on revenue growth of 11.9%. On June 30, that estimate was 26.7%. Over the past five years, estimates have fallen by an average of 2.2% per quarter. This time, they climbed, and 72 companies issued positive guidance against 43 negative.
The track record argues for upside surprises. Q1 earnings grew 20% against an 11% consensus, and Q2 delivered 32% against 22%. The forward multiple has also compressed to 19x, roughly 15% below its 2026 high, as earnings outran price.
Q3 growth expectations rose from 26.7% to 28.9% during the quarter. Analysts see 26.5% growth in Q4.
We discussed the scale of this earnings run in our look at earnings and price breaking 90-year trends. The upshot for Q4 is simple. Rising estimates into the reporting season give companies room to beat, and beats are what restart the buyback machine. The trade-off is that the bar is higher, not lower. Rising expectations leave less room for the usual “beat by a penny” rally. Guidance will matter more than the headline print.
Buybacks, Liquidity, and Sentiment Are Turning Together
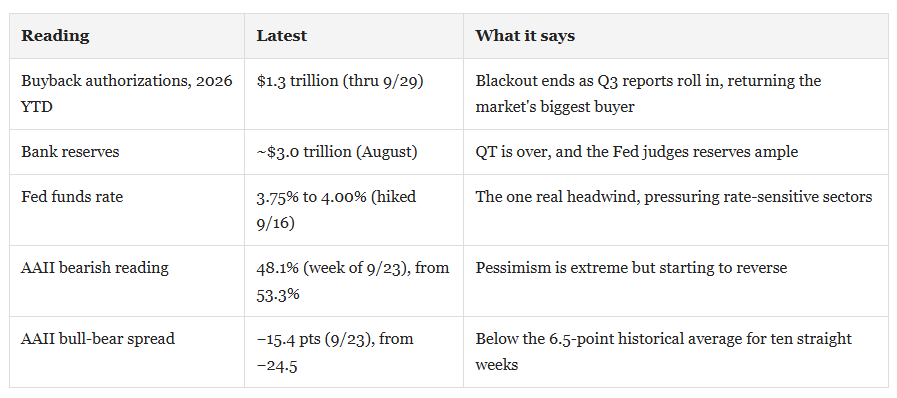
One thing missing over the last month has been corporate buybacks, which are the largest single buyers of U.S. stocks. Our prior analysis found the blackout period cuts corporate purchases by roughly 35%. That window reopens company by company as each one reports, starting with the banks in mid-October. The dry powder is there, too. According to Citadel Securities, U.S. companies authorized $1.3 trillion in buybacks through September 29, the most on record at this point in the year. Windows reopen around October 15, and execution has historically picked up into November.
Last week, an astute reader wrote to ask how I can remain constructive as the Fed hikes rates. It’s a perfectly logical question. To answer that question, let’s analyze the most crucial thing to markets: liquidity.
This past month, the Fed raised the Fed funds rate on September 16. This was the first increase since 2023, which increased the cost of money. Crucially, while the “cost” of money went up, the “quantity” of money isn’t shrinking. The Fed ended quantitative tightening on December 1, 2025. Then, the Fed bought roughly $160 billion in Treasury bills for reserve management in the first half of 2026, and bank reserves stood near $3 trillion in August. In other words, the price of liquidity rose while its supply held steady.
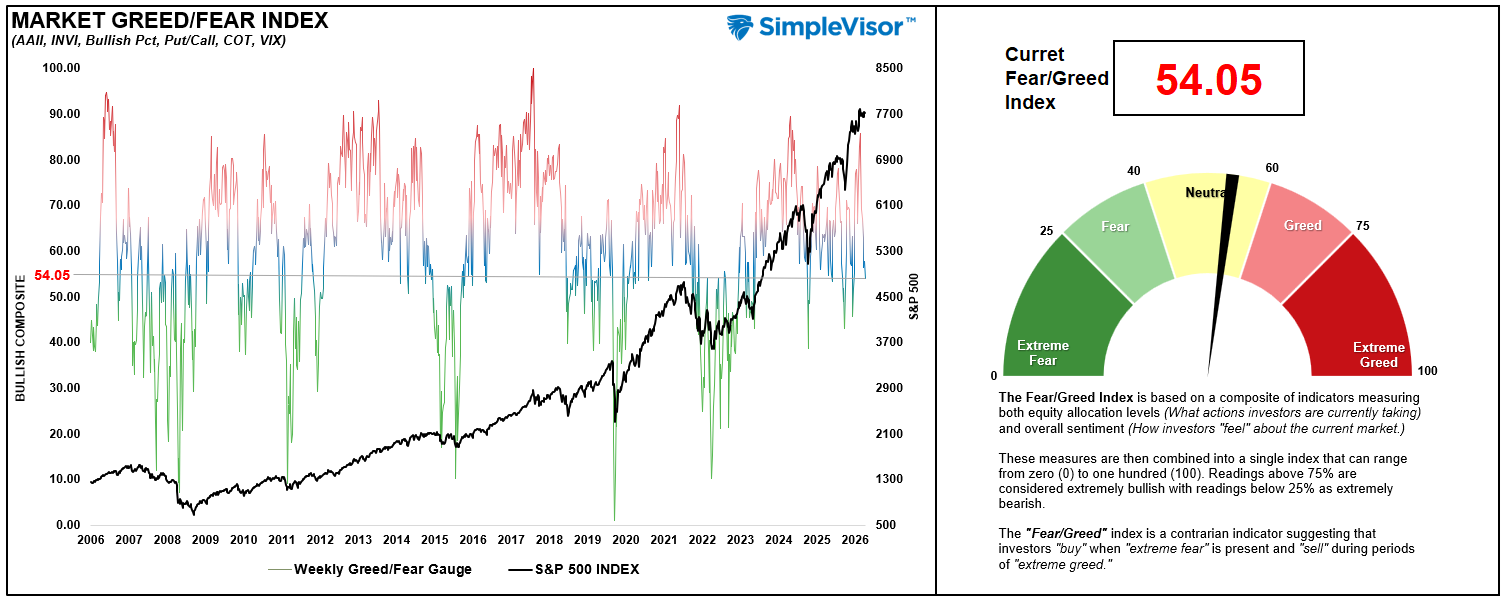
Then there’s sentiment, and it may be the most powerful fuel of all. In the week of September 18, AAII bears hit 53.3% with bulls at just 28.8%, the weakest reading in 16 months, even with the index only 2% from its high. One week later, bears slipped to 48.1%.
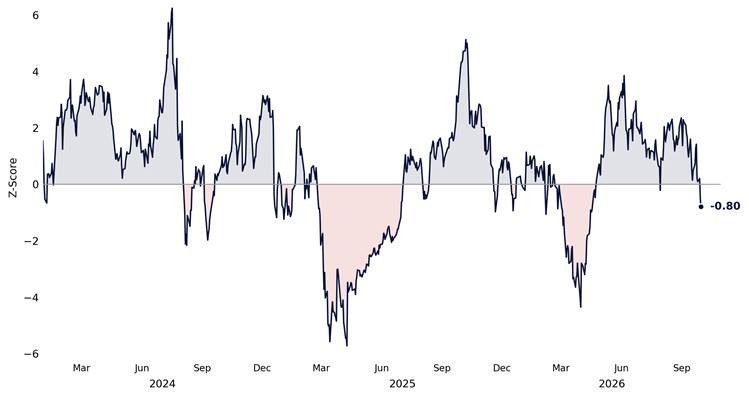
Professional money de-risked even faster. Citadel Securities estimates CTA equity positioning swung from +2.35 standard deviations at the end of August to −0.80 today, a three-sigma reversal in one month. Retail cash trading also fell to its lowest level of 2026 in September.
Meanwhile, as noted in Tuesday’s commentary, inflows to money-market ETFs reached levels that have coincided with market lows since 2018. Bob Farrell’s Rule #9 reminds us that when all the experts and forecasts agree, something else is going to happen. Right now, the consensus is bearish. Bearish investors hold cash, and that cash becomes a buyer when the mood turns.
The best setups for a strong fourth quarter are the ones nobody believes in. This looks like one of them.
Capex Is Carrying The Economy, And The ISM Shows It
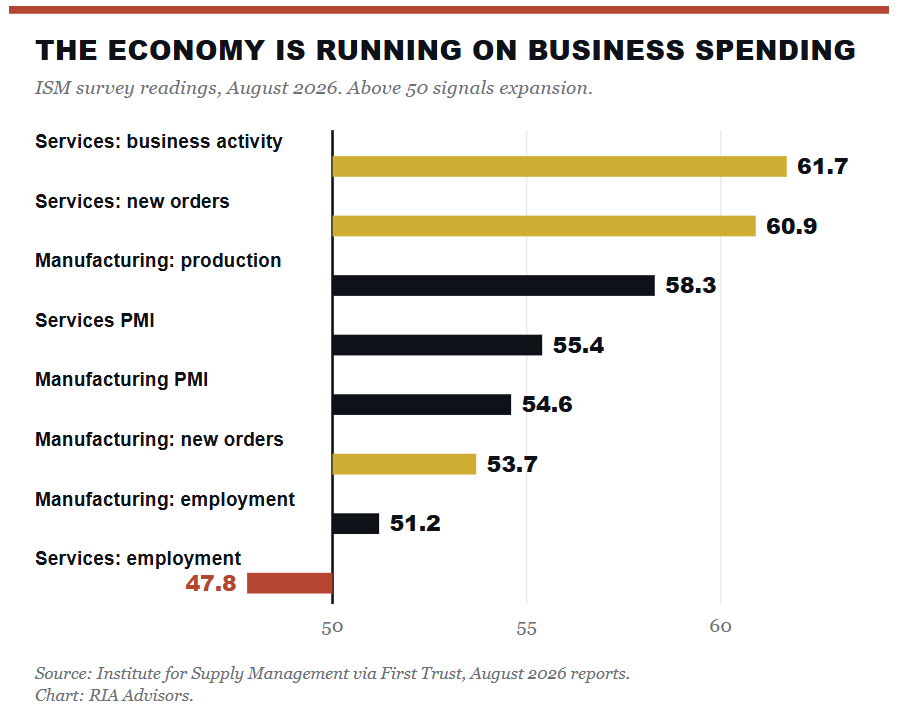
The economy is also doing better than the summer’s gloom implied. And the growth is coming from business investment rather than a stretched consumer. The August ISM manufacturing index printed 54.6, with production at 58.3. Employment expanded for a second month after nearly three years of contraction. The report credited AI-related capital investment, reshoring, and defense procurement. On the services side, business activity hit 61.7 and new orders 60.9, both three-year highs.
Seven of eight ISM readings sat above 50 in August, led by services activity at 61.7. Only services employment contracted, at 47.8.
The hard data agrees. Core capital goods shipments rose 11.4% from a year earlier in August. Computer and electronics orders are up 16.5% on data center spending. If shipments hold flat in September, business equipment investment will have grown at a 14.5% annualized pace in the third quarter. That’s a real growth engine. The catch is prices: the ISM price indexes are at 71.1 for manufacturing and 72.6 for services, which is why the Fed hiked. Strong growth with sticky prices is good for earnings and bad for anyone waiting on rate cuts. Expect the rate-sensitive corners of the market to keep lagging.
What Should Investors Do Now
While September has been very sloppy and range-bound, the weight of evidence favors a positive fourth quarter. Notably, timing will matter as much as direction. Citadel found that in 14 of 24 midterm years since 1930, the fourth-quarter low came in October. The median rally from that low into year-end was 10%. In other words, October weakness has historically rewarded investors who planned for it.
Seasonality, earnings, buybacks, and sentiment all lean the same way. But this is a narrow market. Only 25% of S&P 500 stocks trade above their 50-day moving average. In Q3, the index gained 2.1% while the equal-weight version fell 2.2%. Per Citadel, Nvidia alone now carries more index weight than the combined weight of the smallest 256 companies.
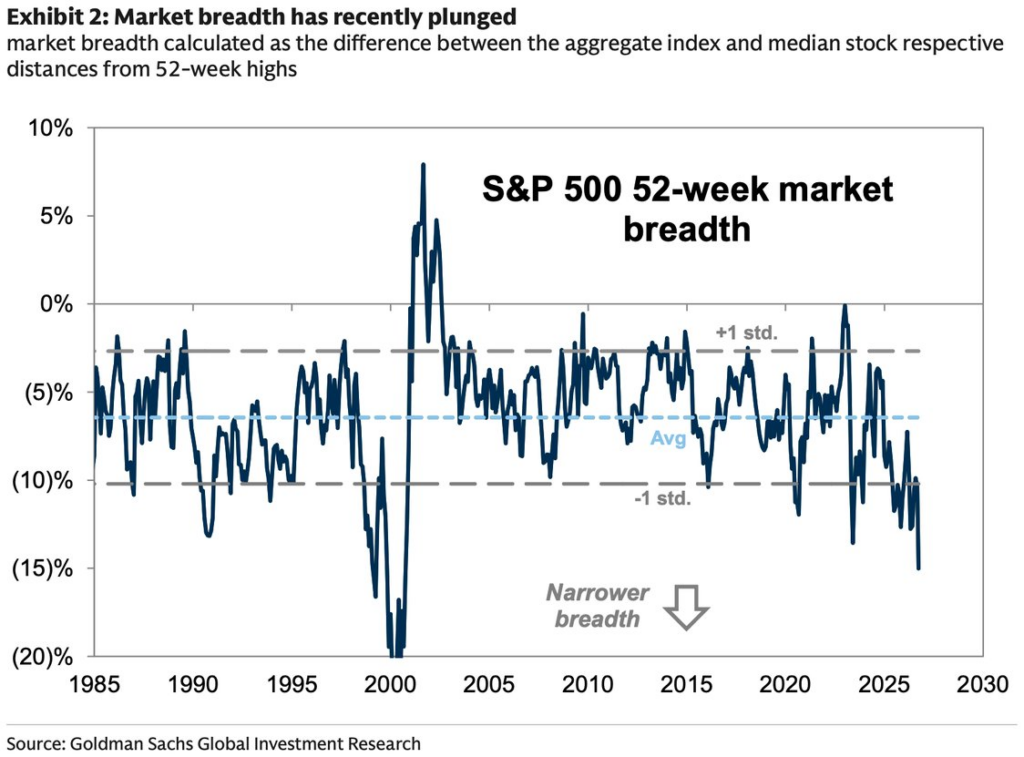
As is always the case, market statistics, averages, and historical trends don’t always prove accurate. This remains a narrow market, and as I showed this past Tuesday, Goldman Sachs’ breadth gauge sits near its weakest reading since 2000. However, one thing worth noting is that when previous breadth readings were this poor, it was just before a market reversal. One thing I have learned over the years is that when data registers more extreme bullish or bearish readings, it tends to be a better contrarian indicator.
With the Fed’s own projections showing no rate cuts until 2028, there seems to be no rescue coming if growth stumbles. Of course, given the Fed’s terrible track record of forecasts, the unanimous agreement among Fed members that there will be no economic weakness throughout next year is also likely a contrarian indicator in itself.
Nonetheless, given the current market backdrop, we suggest remaining invested. The most important thing for investors is to manage risk around levels that would indicate the summer range is breaking lower.
The calendar is on the Bulls’ side for the next three months, and the fundamentals are finally cooperating with it. Just remember that the calendar has missed three times in 21 tries, and it doesn’t manage your risk. You do.
🖊️ From Lance’s Desk
This week’s #MacroView blog explores a viral stat claiming credit card delinquencies have just hit their worst level since 2008. However, the New York Fed’s own data shows the opposite, and the real consumer credit stress is hiding exactly where the headlines aren’t looking.
Also Posted This Week:
📹 Watch & Listen
Treasury yields have spiked, with the 10-Year Treasury around 5.29%, but the technical picture suggests rates may be getting stretched. Historically, extreme deviations from longer-term trends have often been followed by a retracement in yields, potentially creating a short-term trading opportunity in longer-duration bonds.
Weekly technical overview across key sectors, risk indicators, and market internals
💸 Market & Sector X-Ray: Market Gains Ground
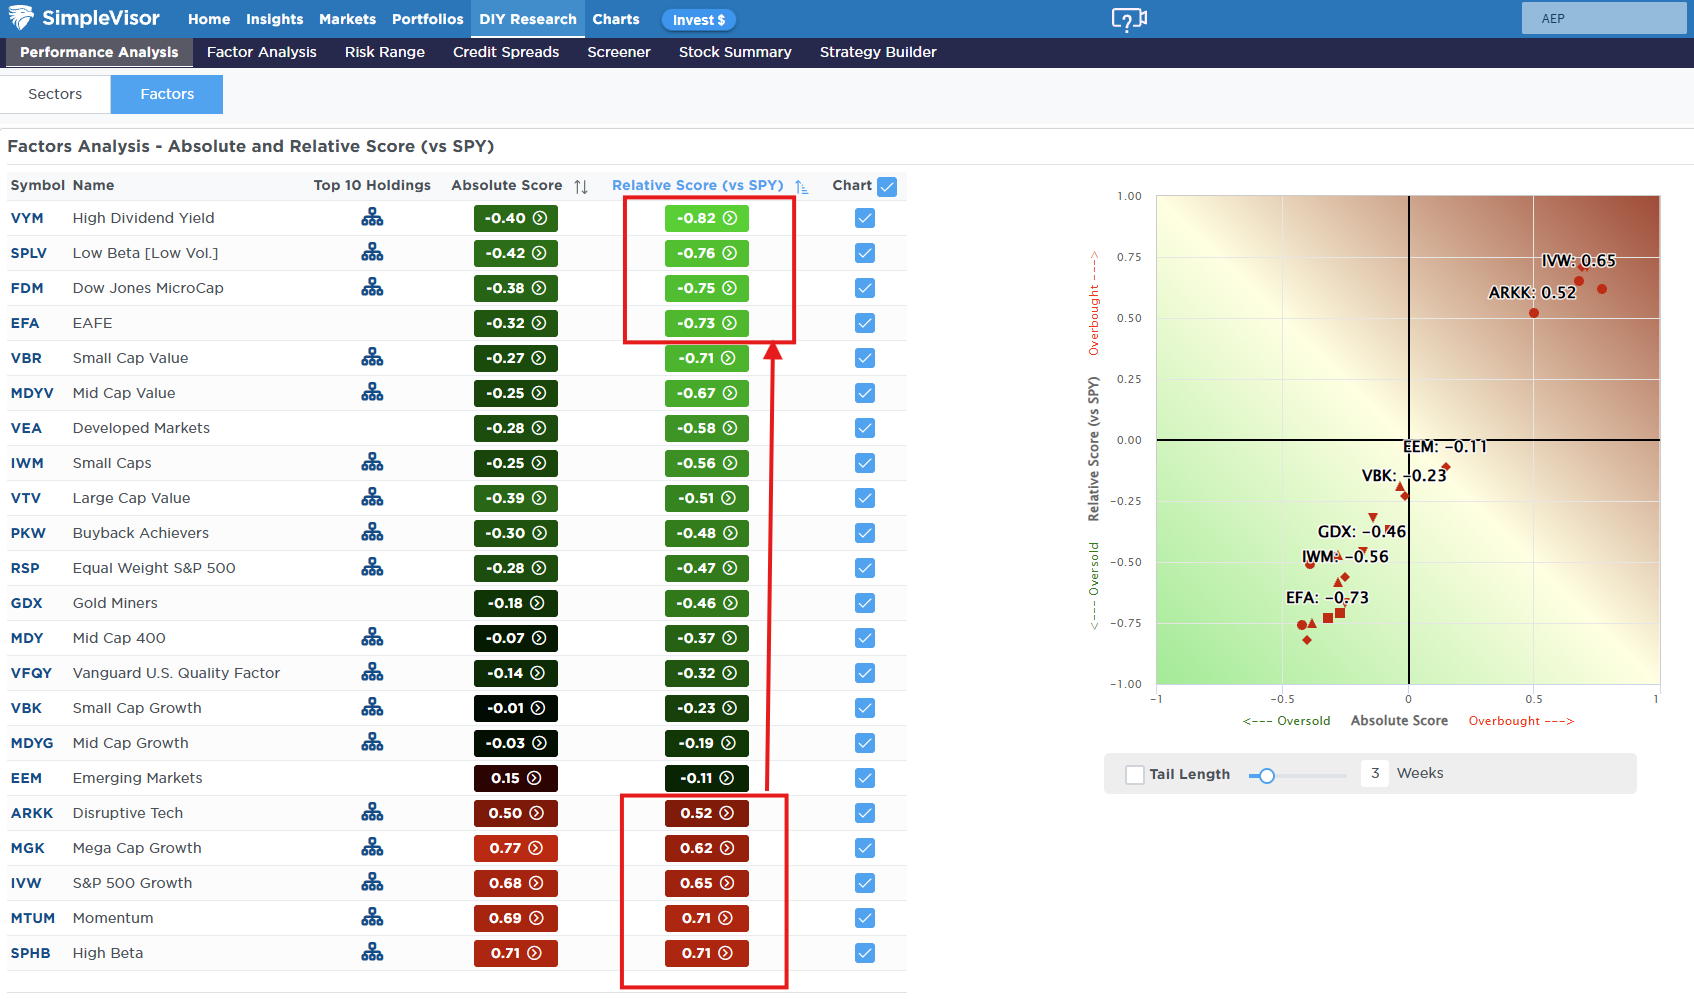
As we kick off Q4, Technology and Energy remain the key market drivers and are overbought relative to most other markets and sectors. This setup continues to suggest, as noted in the Factor Model below, that a market rotation from growth to value is becoming more likely heading into year-end.
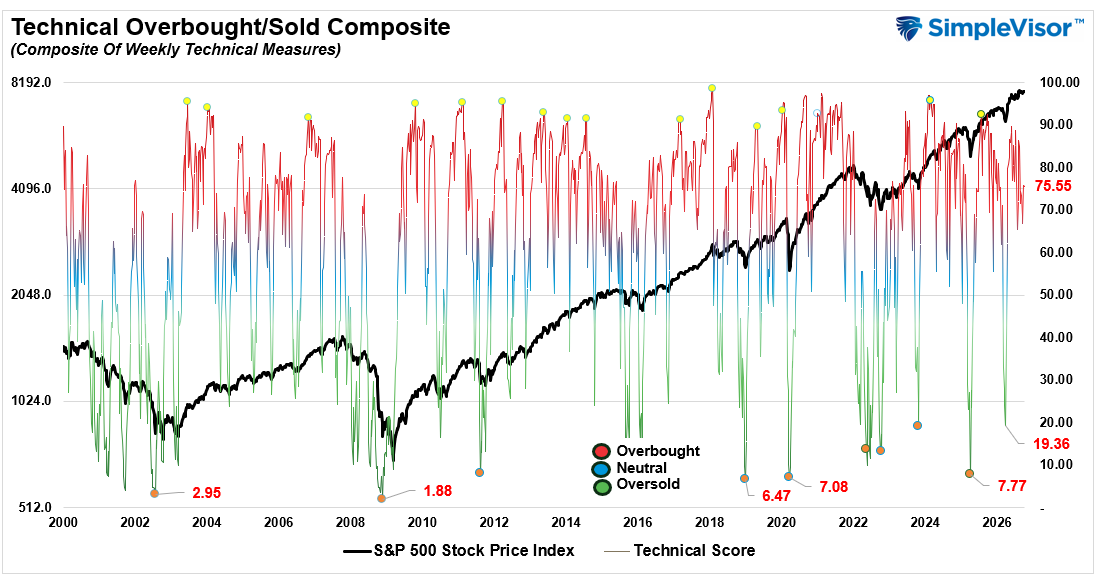
📐 Technical Composite: 75.55 – Decreased Slightly, Still Overbought
The technical condition dectreased slightly this past week. However, overall, the market remains technically overbought, and sentiment remains mostly bullish for nowwith no significant technical breaks. The indicator does suggest more struggles for the market next week.
Even though the market rose a bit last week, the underlying market allocation and sentiment remains more bearish. There was a continued drop in the Commitment of Traders equity allocations, and investor sentiment turned slightly more bearish last week. If the market can continue to hold up amid increasing bearishness, it could present a good buying opportunity over the next month or so.
🔁 Relative Factor Performance
Factor performance has diverged over the last couple of weeks, with Growth, Speculative Technology, and Megacaps now extremely overbought, while Value, Low Beta and Dividend Yield (interest rate sensitive sectors) now the most oversold. A risk-off rotation from seems highly probable. As noted below, this is a “risk aware” market currently and increasing controls seems logical.
📊 MFBR Index (Money Flow/Breadth Ratio Indicator)
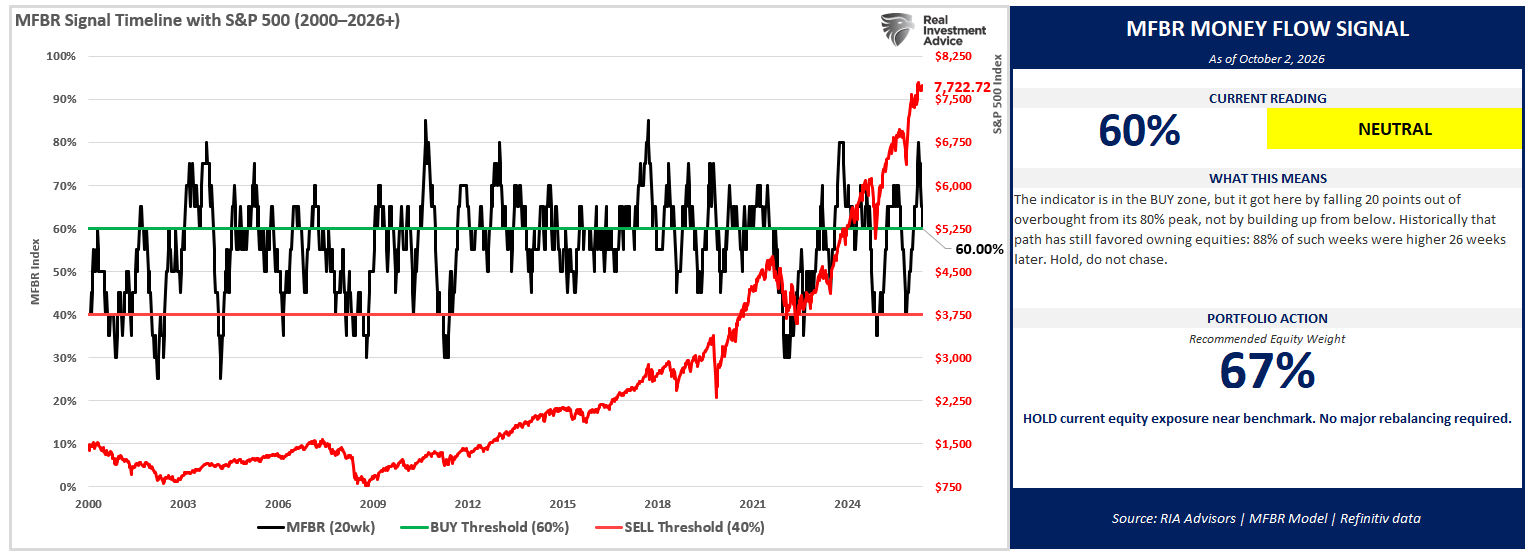
The Money Flow Breadth Ratio (MFBR) model is a rules-based equity allocation framework that uses weekly S&P 500 money flow data to generate buy, sell, and neutral signals. The MFBR systematically adjusts portfolio equity exposure in response to the direction and persistence of institutional capital flows. It aims to reduce drawdowns while capturing the majority of market upside.
“As of October 2, 2026, with the S&P 500 at 7,722.72, the Money Flow Breadth Ratio (MFBR) stands at 60%, down from a peak of 80% set 7 weeks ago and falling versus 65% the prior week. The trailing four-week change is still -15 percentage points, but the near-term trend has rolled over. This places the indicator in BUY territory (60-70%). The raw zone signal reads NEUTRAL, but the model still flags a TOP REVERSAL, with 20 points now off the peak. Read that NEUTRAL as a zone label, not as fresh confirmation – the model reached this band by falling out of overbought, not by building up from below.
Bottom line: hold the target weight. The roll-over off the 80% peak is real and worth watching, but it has carried the gauge into the band that has historically been the best place to own equities. This is neither a chase nor a de-risk. A sustained break below 60% would move the grid to an underweight; a move back above 70% would re-engage the contrarian trim.”
📊 Sector Model & Risk Ranges
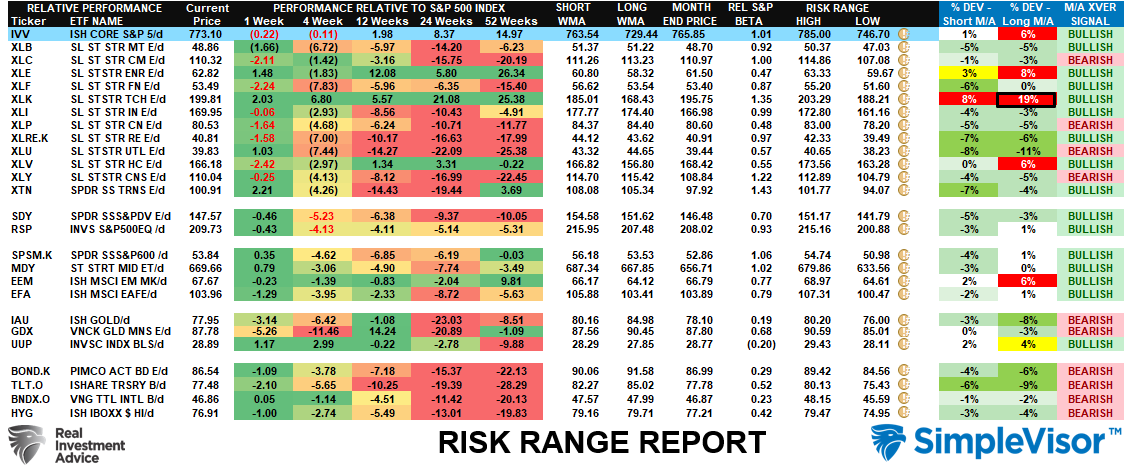
The Risk-Ranges for each sector and market reset on the 1st of the month, so there are not readings for this week. However, next week we will get updated numbers. For now, there are two important takeaways. First, the number of markets and sectors with bearish crossovers continues to expand to 10 this past week. Historically, this expansion of bearish crossovers precedes more difficult markets in the future. Secondly, Energy and Technology remain the most grossly exteneded sectors in the market, and a rotation to more “defensive” sectors continues to increase.