


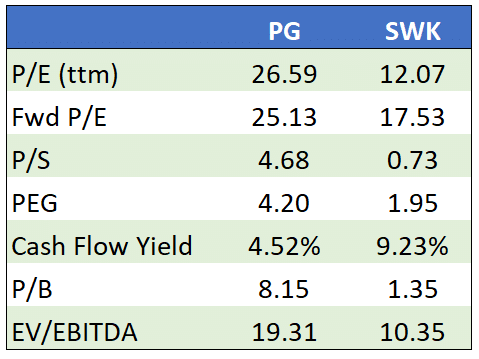
A shift to stocks that offer real value and dividends is one of our key investment themes to start the year. We say “real value” versus plain old “value” as the term value can be misused, especially by ETFs and mutual funds. In our recent article, Passive Value Investors Are Not Value Investors; we compare Proctor & Gamble (PG) with Stanley Black & Decker (SWK) to show how Wall Street “value” stacks up against a stock offering real value. The article shows that revenue and earnings growth trends clearly favor SWK. Further, as we highlight below, SWK is much cheaper across many valuation metrics. Despite the differences, PG is a top ten holding of most value ETFs, while SWK is often negligible.
The article makes a strong case that SWK offers more value for investors. However, we fully know that passive strategies have warped the investment environment. To wit, we start our summary as follows:
Any rational investor staring at valuations and fundamentals would likely choose SWK over PG. Any rational investor gauging where investor dollars flow would choose PG over SWK.
While stocks like SWK, offering real value, maybe the better value play versus companies like PG, if investors continue to chase what Wall Street conveniently deems value, then real value stocks may become even cheaper. Disclaimer- We currently own PG and SWK in our equity model.
What To Watch Today
Economy
- 8:30 a.m. ET: Chicago Fed Nat Activity Index, December (-0.05 prior)
- 8:30 a.m. ET: GDP Annualized, quarter-over-quarter, Q4 Advance (2.6% expected, 3.2% prior)
- 8:30 a.m. ET: Personal Consumption, quarter-over-quarter, Q4 Advance (2.8% expected, 2.3% prior)
- 8:30 a.m. ET: GDP Price Index, quarter-over-quarter, Q4 Advance (3.2% expected, 4.4% prior)
- 8:30 a.m. ET: Core PCE, quarter-over-quarter, Q4 Advance (3.9% expected, 4.7% prior)
- 8:30 a.m. ET: Advance Goods Trade Balance, December (-$88.5 billion expected, -$83.3 billion prior)
- 8:30 a.m. ET: Wholesale Inventories, MoM, December Preliminary (0.5% expected, 1.0% prior)
- 8:30 a.m. ET: Retail Inventories, month-over-month, December (0.2% expected, 0.1% prior)
- 8:30 a.m. ET: Initial Jobless Claims, week ended Jan. 21 (205,000 expected, 190,000 prior)
- 8:30 a.m. ET: Continuing Claims, week ended Jan. 14 (1.665 million expected, 1.647 million prior)
- 8:30 a.m. ET: Durable Goods Orders, December Preliminary (2.5% expected, -2.1% prior)
- 8:30 a.m. ET: Durables Excluding Transportation, December Preliminary (-0.2% expected, 0.1% prior)
- 8:30 a.m. ET: Non-Defense Cap Goods Orders Excl. Aircraft, December Prelim. (-0.2% expected, 0.1% prior)
- 8:30 a.m. ET: Non-Defense Cap Goods Shipments Excl. Aircraft, December Prelim. (-0.4% expected, 0.1% prior)
- 10:00 a.m. ET: New Home Sales, December (612,000 expected, 640,000 prior)
- 10:00 a.m. ET: New Home Sales, month-over-month, December (-4.4% expected, 5.8% prior)
- 10:00 a.m. ET: Kansas City Fed Manufacturing Activity, January (-8 expected, -9 prior)
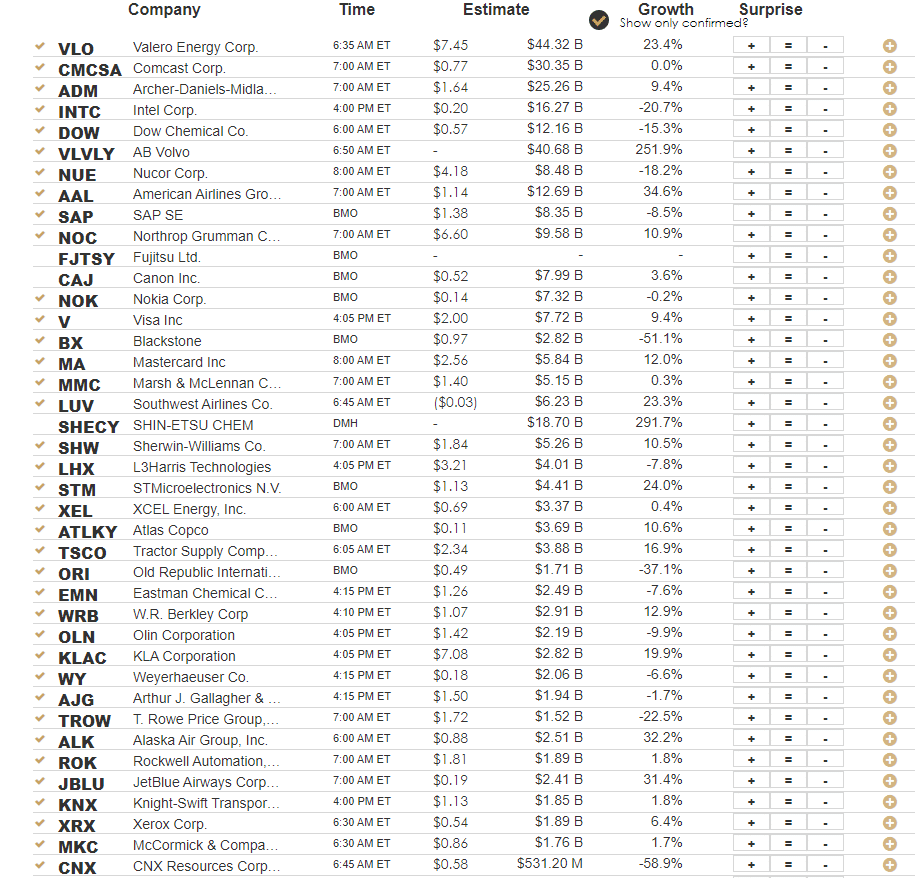
Earnings
Market Trading Update
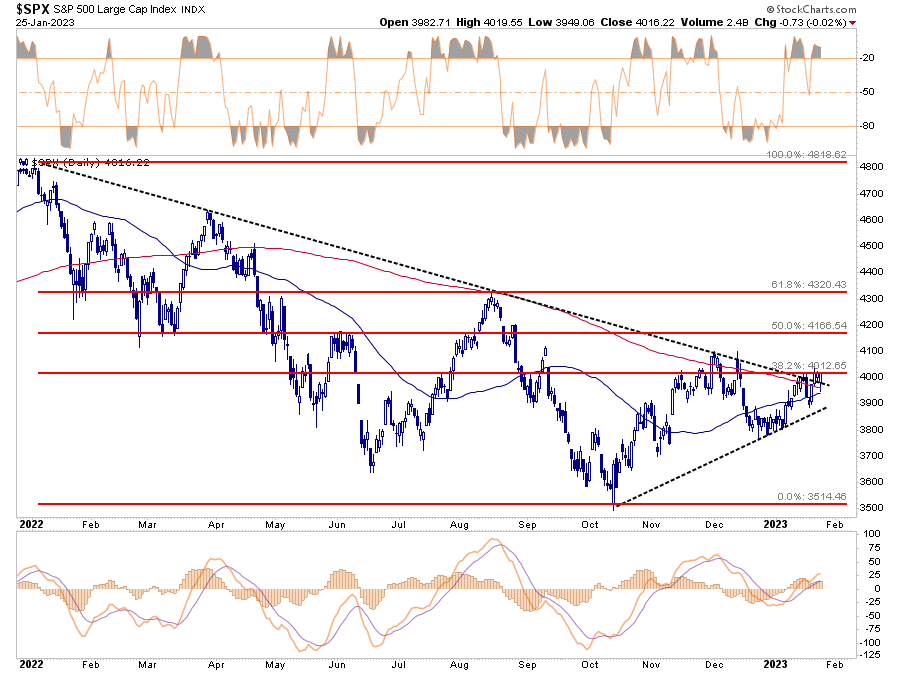
The bulls continued to “buy the dip” yesterday morning following disappointing guidance from Microsoft (MSFT.) Despite the still “bearish” attitude of investors, the market has successfully tested and held both the 200-DMA and the downtrend line from the January highs successfully over the last couple of days. With the markets overbought short-term (top indicator), this back-and-forth action is not surprising.
Furthermore, the market is struggling to break above the 38.2% Fibonacci retracement level from the January peak. A successful break of that level, and we should see an attempt at the 50% retracement at 4166. With the MACD “buy signal” intact, as stated yesterday, we recommend holding current equity exposure levels until the market firmly declares the downtrend is over. That hasn’t happened yet, so holding some extra cash as a hedge remains appropriate.
Credit Spreads and Financial Conditions
Yesterday’s Commentary noted that “stocks and credit spreads are not foreshadowing a recession.” Stock prices are easy to monitor. Credit spreads are a little more complicated. Therefore, let’s look at current spreads versus historical norms.
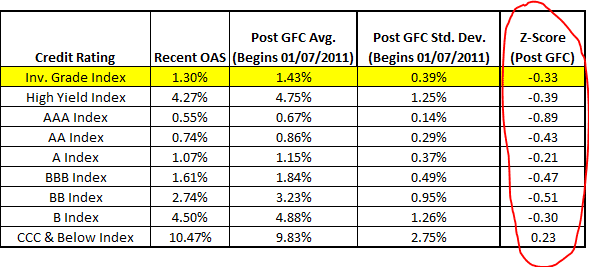
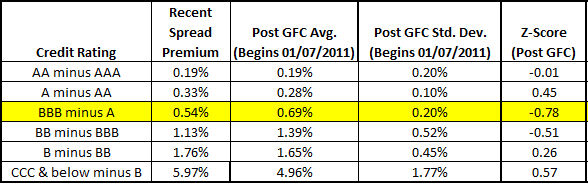
Credit spreads represent the difference between the yield on a corporate bond index and Treasury yields. The smaller the difference, the easier, or cheaper, lending conditions are for corporations. Often during recessions, credit spreads increase significantly as default risks rise. Despite rising odds of a recession, credit spreads are below historical averages.
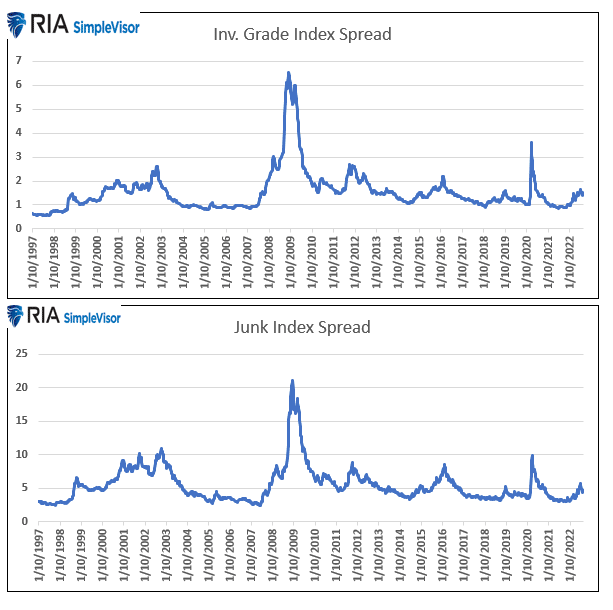
The first table shows that single B-rate corporate bonds and better quality bonds trade at spreads and z-scores below the post-GFC average. The second table highlights the spreads between corporate bond rating tiers are also below average, except in the case of B-rated bonds, and worse. In other words, investors are willing to accept a lower-than-average yield premium (i.e., take on more risk) over Treasuries to earn additional yield. In the graphs below the tables, note how spreads popped higher during the recessions of 2000, 2008, and 2020.
Volatility and the FOMC Meetings
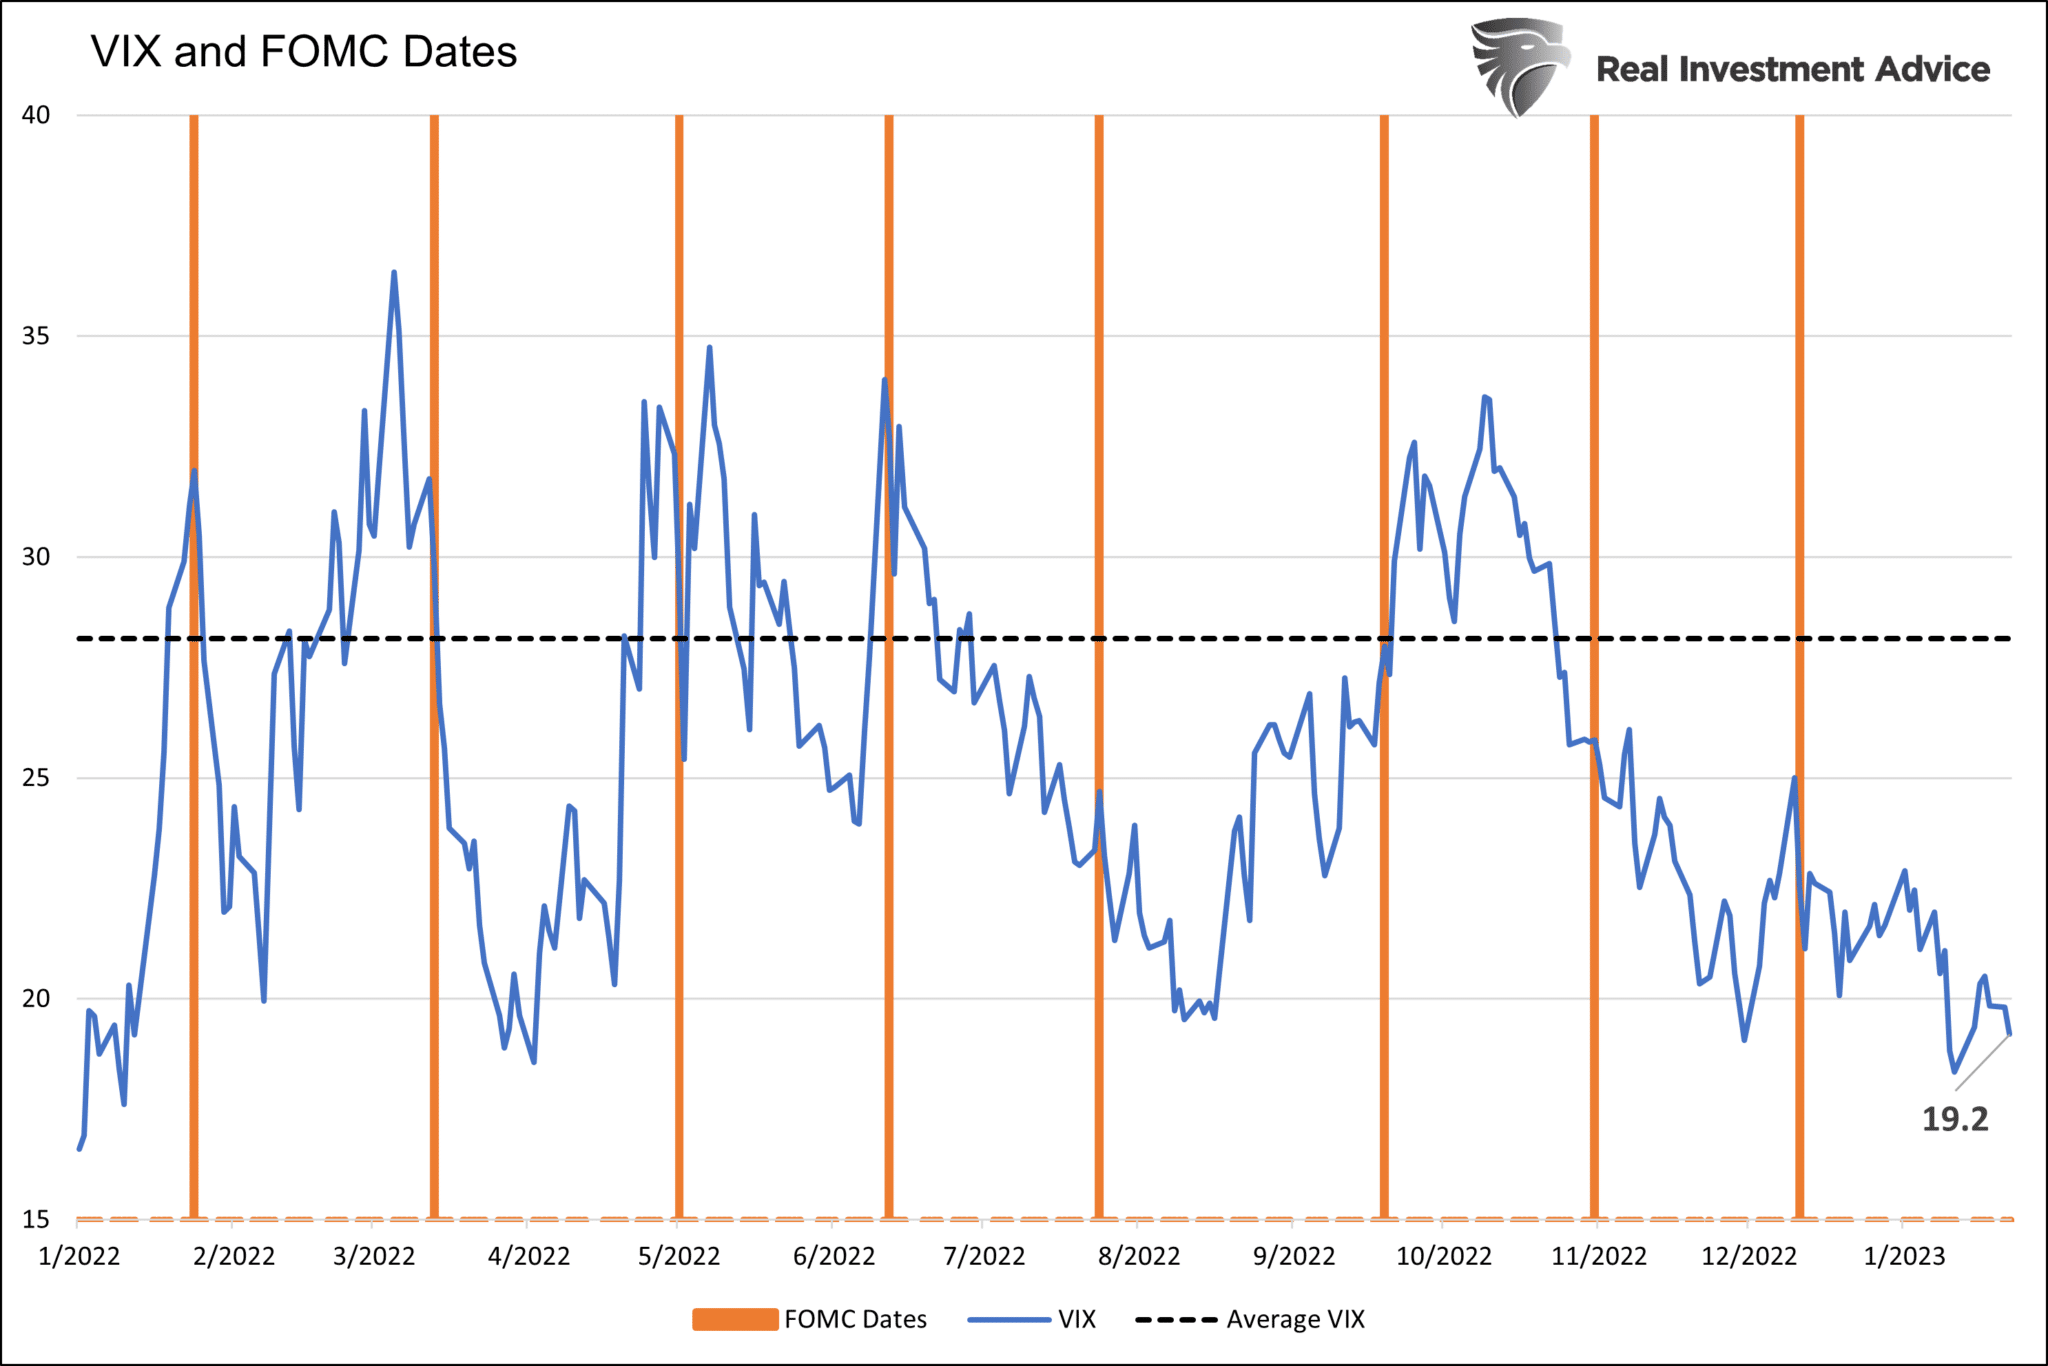
One of the hallmarks in 2022 was a heightened level of investor anxiety before Fed meetings. Such is not surprising given how closely the S&P 500 has correlated with Fed liquidity and its monetary policy rhetoric. The graph below shows implied volatility (VIX) averaged 28 on FOMC meeting days. The current implied VIX is 19.2, well below the average. As we head into next Wednesday’s FOMC meeting, will volatility spike again, or will investors in 2023 be less concerned about potential Fed actions?

Future Pension Funding Liabilities
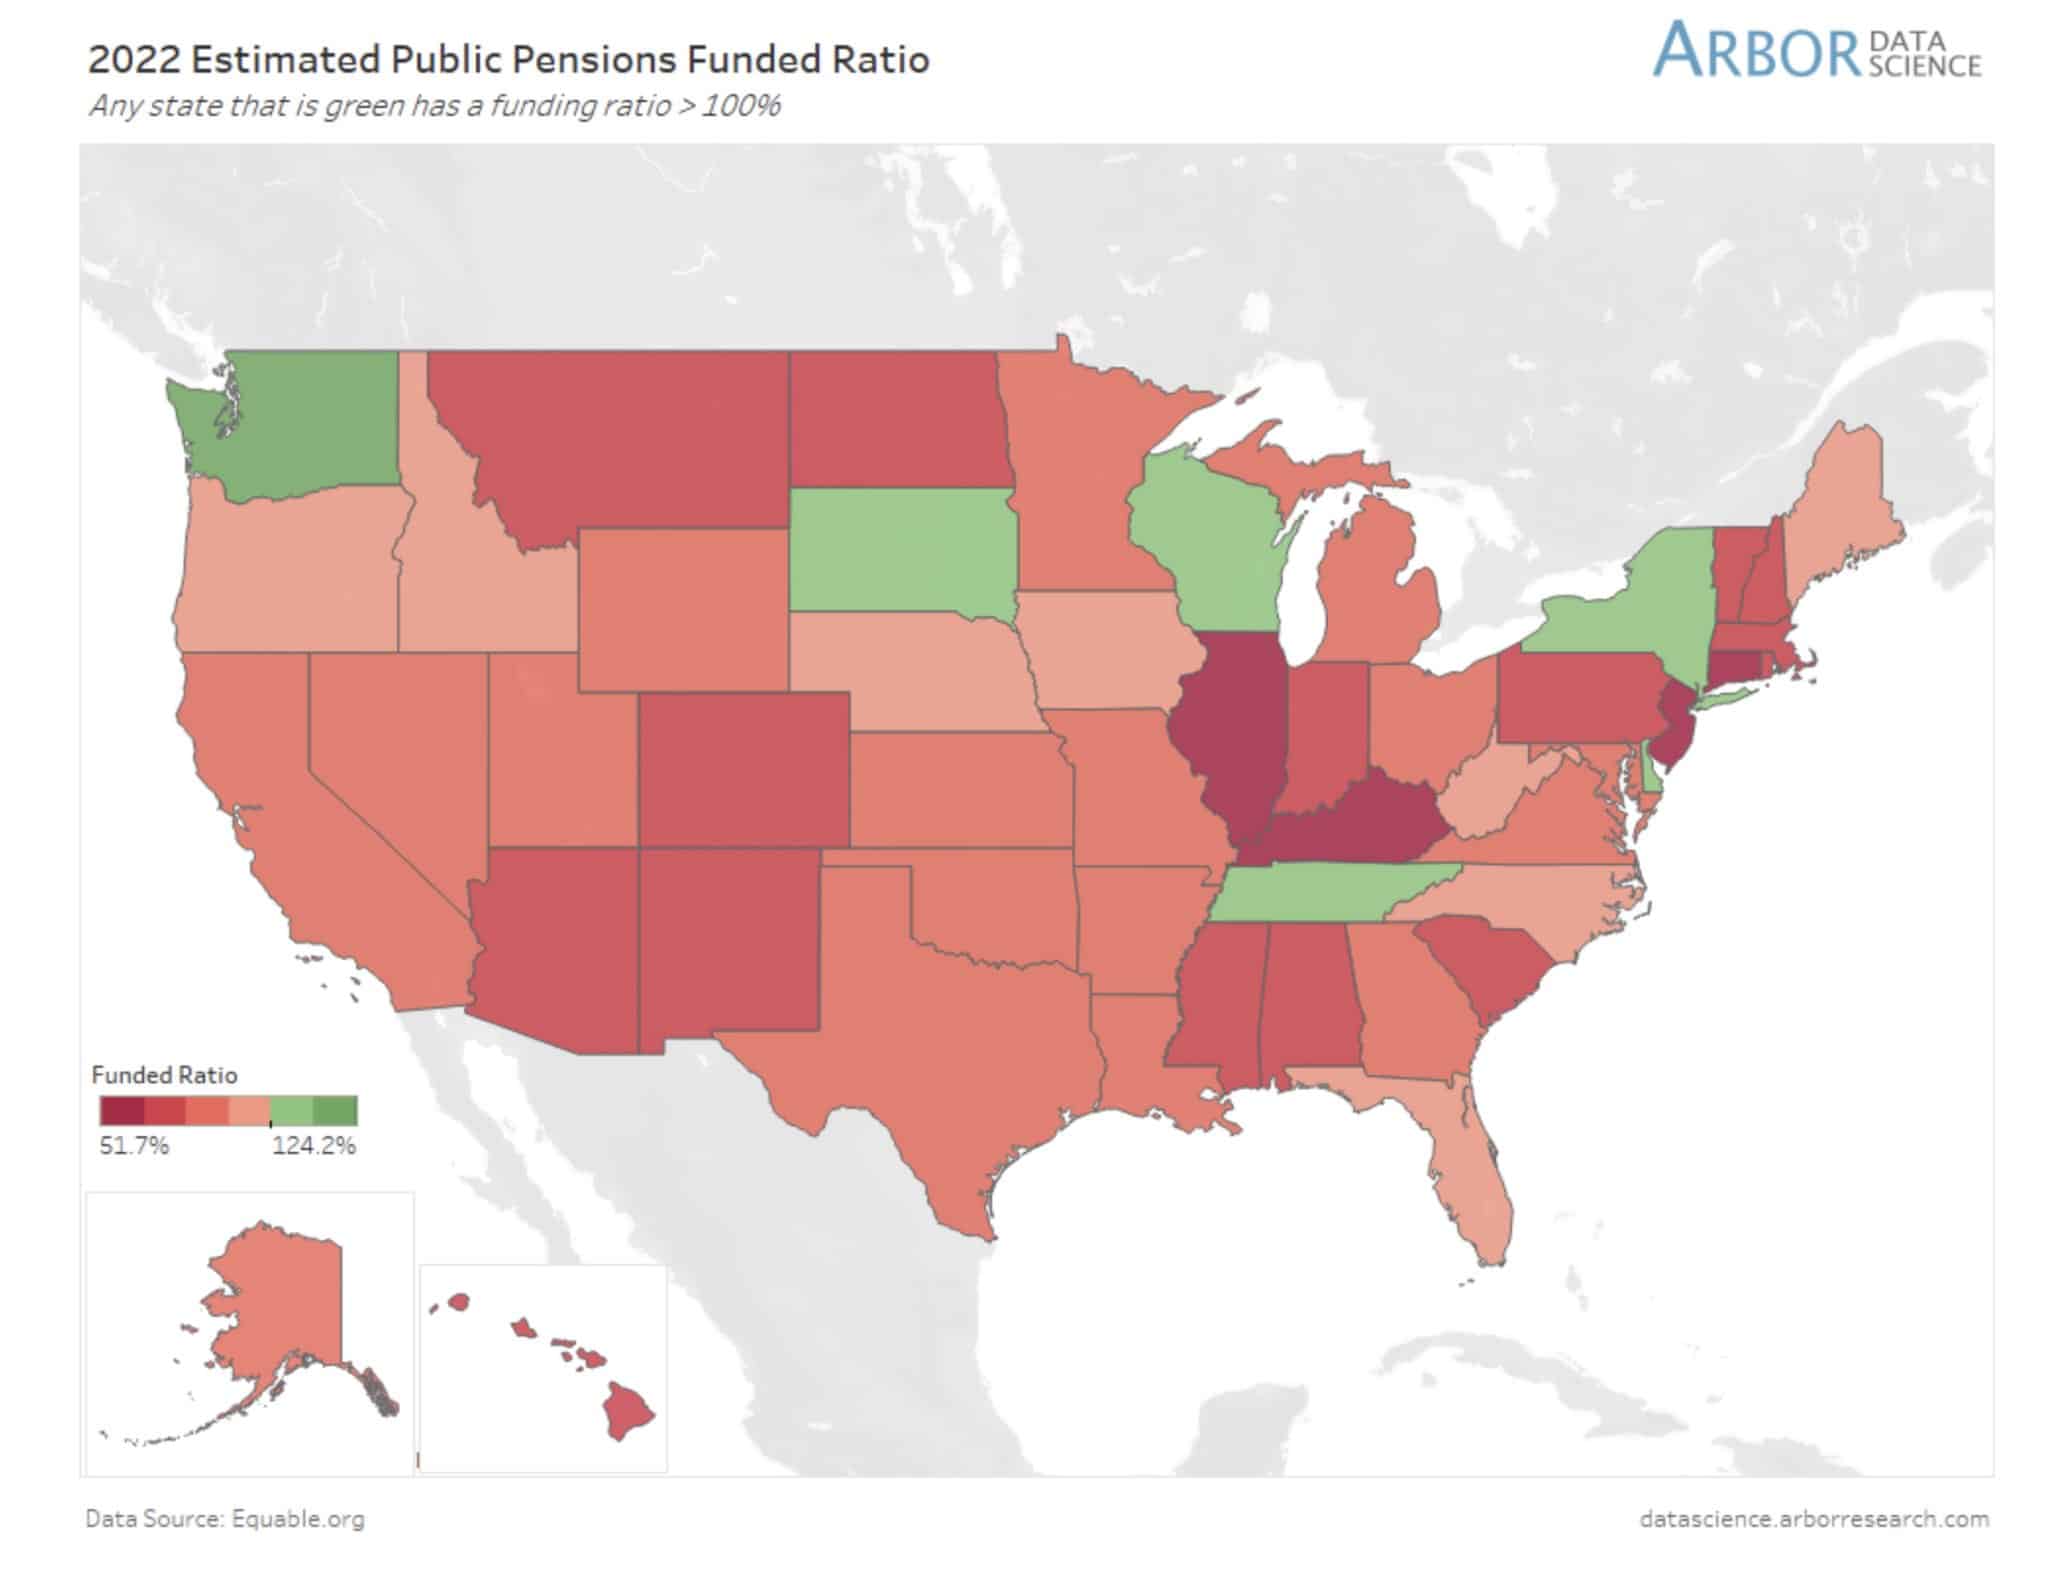
A lot is made of the U.S. government’s social security funding liability. The liability is the difference between the present value of future payments and the amount of money set aside for said payments. The same problem exists for many states regarding pension liabilities. There are only six states (green) that are fully funded. The remaining 44 states will have either to allocate more tax dollars to their pension funds or hope the value of their current invested assets rises quicker than the future liability. A longer-term bear market would be difficult for many states.
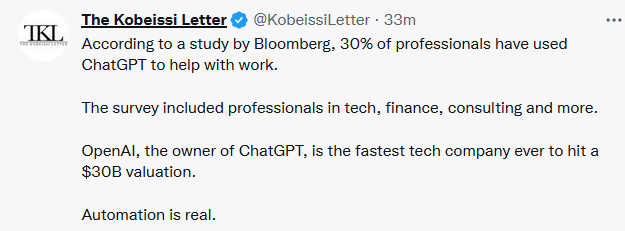
Tweet of the Day
Please subscribe to the daily commentary to receive these updates every morning before the opening bell.
If you found this blog useful, please send it to someone else, share it on social media, or contact us to set up a meeting.