


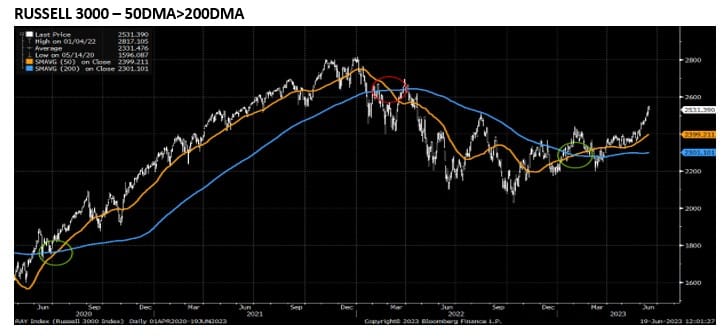
Russell 3000 50DMA cross above 200DMA historically means continued higher stock prices.
The Russell 3000 50DMA crossed above the 200DMA on 2/3/23. The Russell 3000 represents approximately 98% of the market cap of all publicly traded stocks. The index is now only 5.2% higher than it was on 2/3/23, primarily due to Small Cap weakness early on.
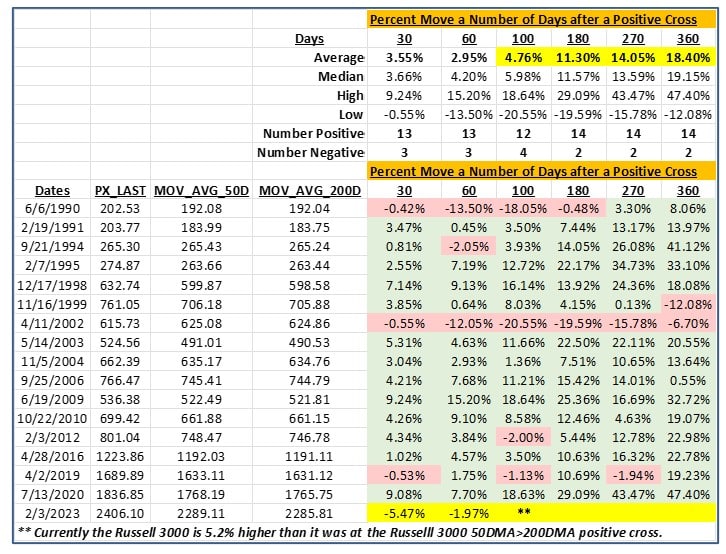
Looking back over the past 23 years, the Russell 3000 50DMA>200DMA cross has occurred 17 times. In the past 16 times, the average percentage change 30, 60, 100, 180, 270, and 360 days later is 3.55%, 2.95%, 4.76%, 11.30%, 14.05%, 18.40%. The Russell 300 was higher 13 out of 16 times and lower only two times in 23 years. The largest gain and loss 360 days later were+47% and -12%, respectively.
The worries about a narrow rally should be laid to rest since no broader index exists than the Russell 3000. The odds heavily favor higher stock prices until February 2024.


Jeff Marcus founded Turning Point Analytics (TPA) in 2009 after 25 years on trading desks and 13 years as a head trader to provide strategic and technical research to institutional clients. Turning Point Analytics (TPA) provides a unique strategy that works as an overlay to clients’ good fundamental analysis. After 10 years of serving only large institutions, TPA now offers its research services to mid and small managers, RIA’s, and wealthy sophisticated individuals looking for a way to increase their returns and outperform their peers.
Subscribe 2 Week Trial
Customer Relationship Summary (Form CRS)