


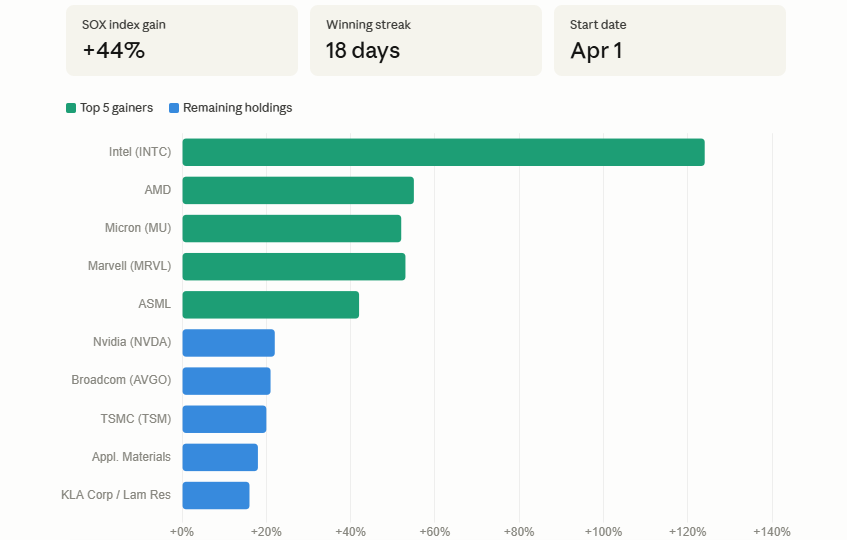
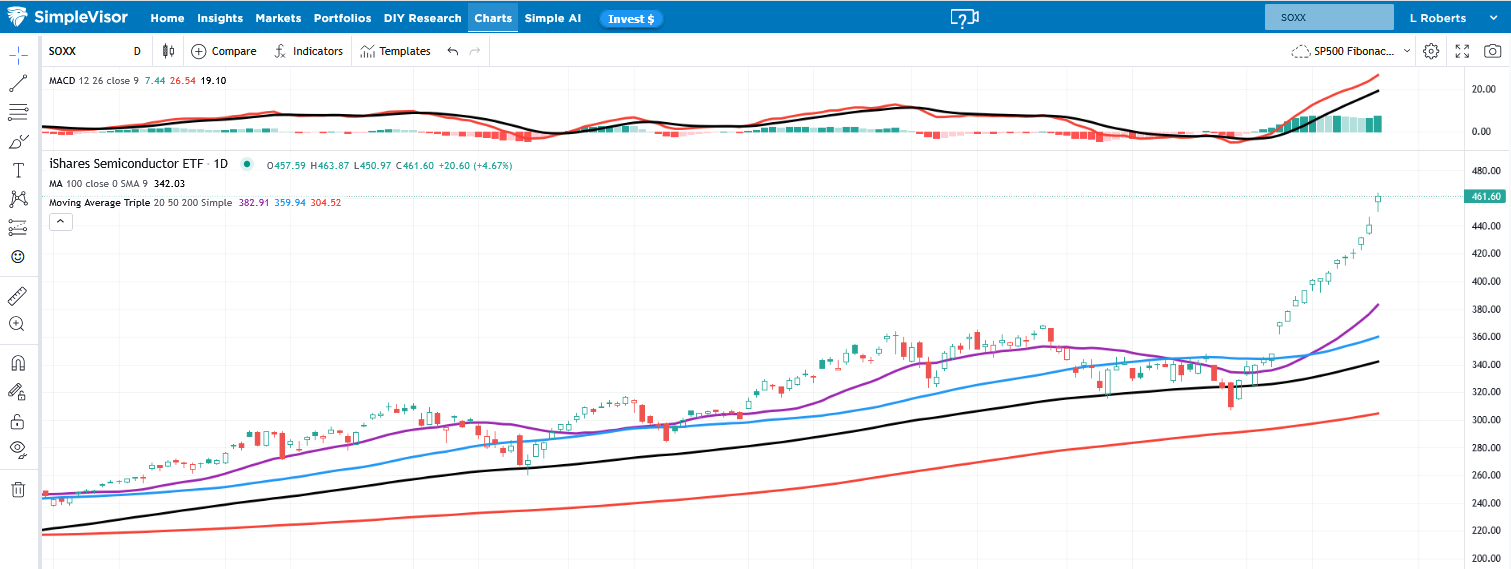
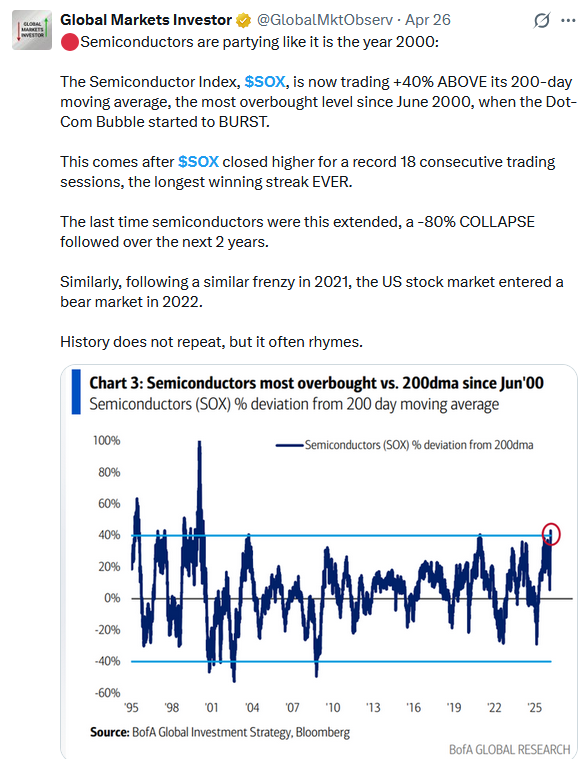
The Philadelphia Semiconductor Index (SOX) is on an incredible 18-day winning streak. Over this period, starting on March 31st, the SOX index has risen by 44%. This marks the longest winning streak in the index’s 32-year history. Moreover, it is now up 150% year over year, exceeding its 100% year-over-year gain during the dot-com boom. The Tweet of the day shows it is now the most extended versus its 200-day moving average since 2000. So what’s driving the incredible gains? The catalyst seems to be a combination of geopolitics, followed by yet another investor chase into a theme.
Throughout March, the U.S.-Iran conflict drove crude oil prices above $100 per barrel, leading to broadly weaker stocks, with an emphasis on the technology sector. At the end of the month, the market reversed course, forming a bottom. The burgeoning rally was boosted on April 7th by the two-week ceasefire. At the same large-cap growth and technology stocks started to lead the market higher. Oil prices stabilized and fell, risk assets rallied, and semiconductors, one of the most oversold sub-sectors, snapped back the hardest.
The SOX rebound has been turbocharged by investors chasing the AI theme. Fundamentals do support some strength in the rally. To wit, global semiconductor spending is projected to hit $1.3 trillion in 2026, a 64% year-over-year increase. However, the rally has driven the index and many underlying stocks to extremely overbought levels. A pullback, or at a minimum a consolidation, is likely at this point. Below, we share the gains since April 1 of the top ten SOX holdings.
What To Watch Today
Earnings

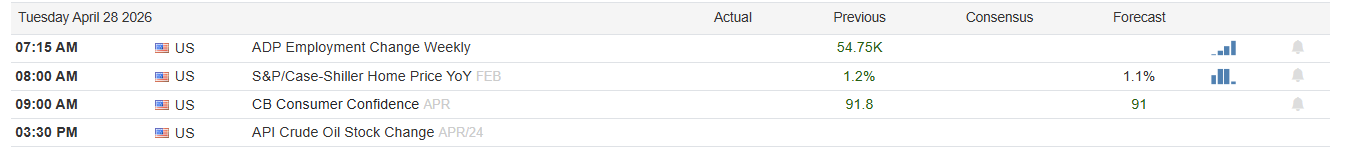
Economy
Market Trading Update
Yesterday, we reviewed the technical backdrop as we enter the last trading week of April. Notably, we are closing April with the S&P 500 carving out a sharp recovery from the conflict-driven correction lows, and traders are already asking the obvious question: “Is it time to sell in May and go away?” After watching the index push back into short-term overbought territory on the daily RSI, that question deserves a straight answer rather than the usual seasonal cliche.
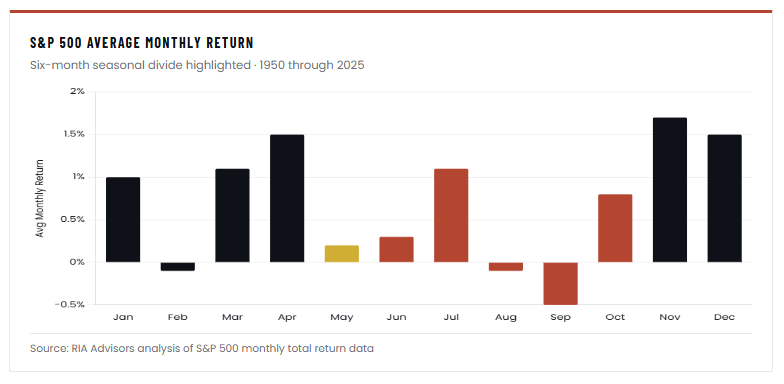
The data is clearer than most realize. Since 1950, May has averaged a return of roughly 0.2% for the S&P 500, essentially flat. That’s not the headline. The headline is what comes after. The May-through-October stretch has historically delivered an average gain near 1.7%, while the November-through-April period averages closer to 7%. The seasonal pattern isn’t superstition. It’s a real performance gap that has persisted across 7 decades of market data. However, as you will note in the chart below, it is the August and September weakness that spoils the summer fun, as May, June, and July tend to post positive returns, especially July.
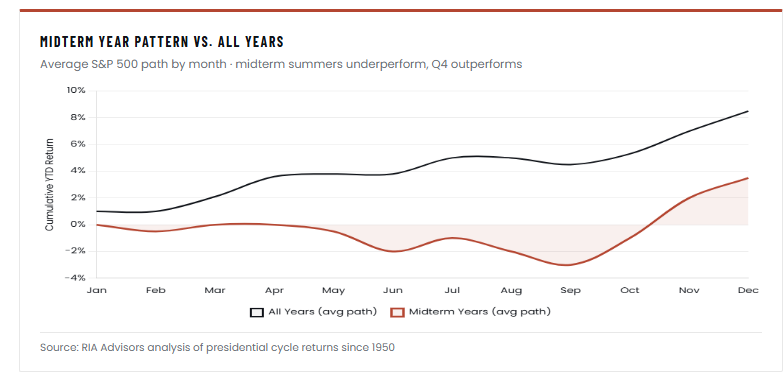
This year, the calendar matters more than usual. 2026 is a midterm election year, and midterm cycles carry their own seasonal fingerprint that overlays cleanly on the May weakness. Since 1950, the second and third quarters of midterm years have produced the worst stretch of the entire four-year presidential cycle. Average peak-to-trough drawdowns in this window range from 15% to 17%, with the cycle low typically forming in late September or October, followed by a sharp Q4 reversal. The year after a midterm has averaged a gain of more than 30%, which is exactly why patient traders treat midterm summer weakness as a setup, not a catastrophe.
Stack the two patterns together, a “Sell in May” period entering with the market already overbought, layered over a midterm year that historically chops sideways-to-down through autumn, and the right posture isn’t panic. It’s preparation. Trim positions where you have outsized gains. Raise stop levels on existing longs. Build a small cash reserve so you have ammunition when prices do come in. Watch the 50-day and 200-day moving averages carefully. They’ll tell you whether any pullback is corrective or something more concerning.
The seasonal headwinds are real, the midterm overlay sharpens them, and the market is overbought as we enter the worst six months of the year. None of that means dump everything. It means tightening the screws, keeping some powder dry, and respecting the pattern that has made September and October among the best buying opportunities of every four-year cycle.

Chipmakers Are Driving The Market
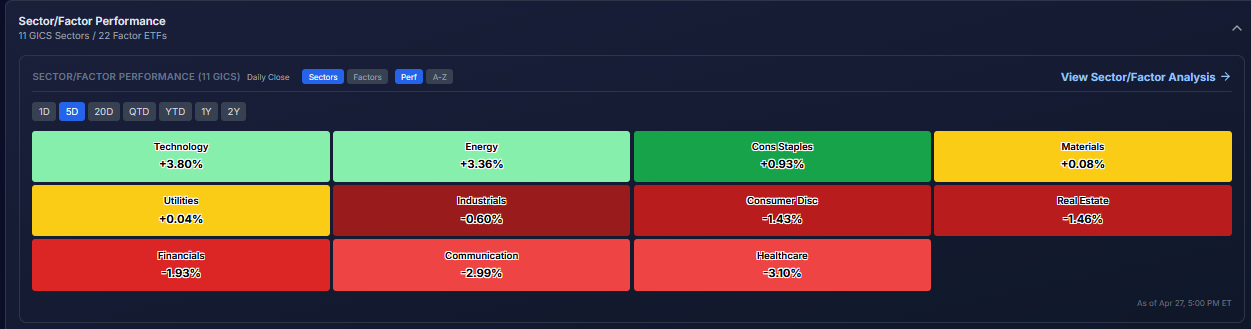
The graph below shows the sharp ascent in the SOX index ETF (SOXX) over the last 18 days. Given the rise and significant contribution of semiconductor stocks to the technology sector, the sector is now very overbought. The second graphic, courtesy of SimpleVisor, shows that technology is the only sector overbought relative to the S&P 500. The other sectors have all lagged in the recent market rally. The third graphic, from the “coming soon” new version of SimpleVisor, highlights the gross outperformance compared to almost all sectors over the last week.
As we note in the opening section, semiconductors are extremely overbought, and the broader technology sector is very overbought. Such outperformance relative to more value-oriented stocks prompted a change in our Factor Rotation model last week. The model now favors value over growth stocks.

Hormuz: Why Markets Are Shrugging Off The Oil Shock
As of this writing, the Strait of Hormuz remains effectively closed since February 28. Roughly 20% of the world’s seaborne oil stopped moving through the chokepoint. The International Energy Agency described the event as “the largest supply disruption in the history of the global oil market.” Gulf producers shut in nearly 9 million barrels a day of production. U.S. gasoline at the pump jumped from $2.98 to over $4.00.
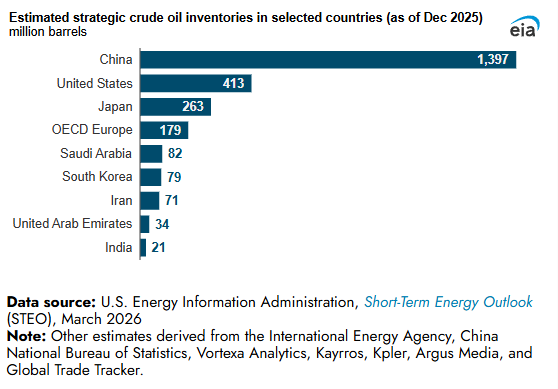
Every historical template for this kind of shock, 1973, 1979, 1990, pointed to a stagflationary body blow that breaks markets. After 30 years of watching cycles play out, I’ve learned that when the tape refuses to confirm a catastrophe narrative, it’s usually seeing something the headlines miss. That’s exactly what is happening with the Strait of Hormuz. Brent peaked near $120 and now sits around $96, well below the $132 the Dallas Fed modeled for a closure lasting three quarters. The S&P 500 is grinding higher. China, which takes roughly a third of its crude through the waterway, hasn’t buckled.
So the question isn’t why the catastrophists were wrong. It’s what they missed, and where the real risks now sit.
Tweet of the Day
“Want to achieve better long-term success in managing your portfolio? Here are our 15-trading rules for managing market risks.”
Please subscribe to the daily commentary to receive these updates every morning before the opening bell.
If you found this blog useful, please send it to someone else, share it on social media, or contact us to set up a meeting.