


Stocks are at an Oversold Extreme
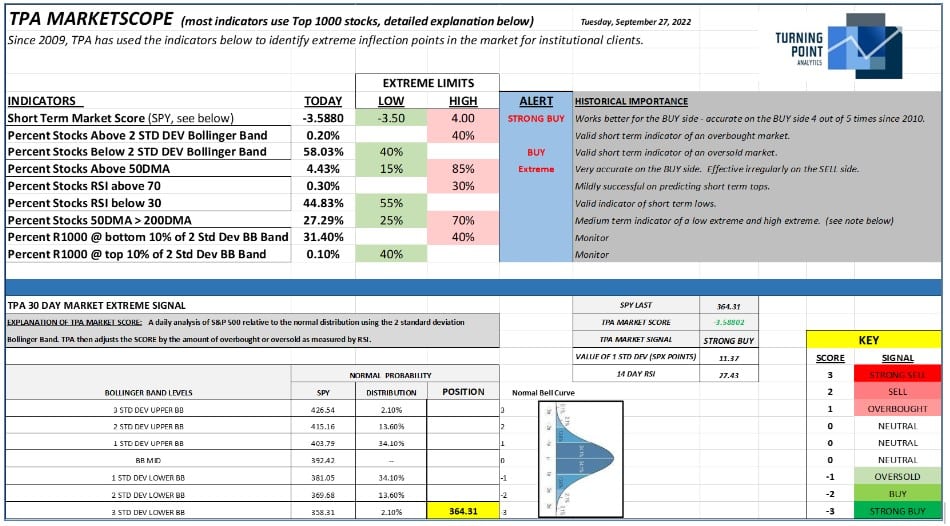
The TPA Marketscope shows that stocks are very oversold. The SPY is down 14% since 8/16/22 and the 14-day RSI is 27 (30 is oversold). In addition, 3 separate indicators are showing alerts that stocks are at an extreme:
- The Short-Term Market Score is -3.588. -3.5 is a Strong Buy. This score uses the S&P500 Standard Deviation weighted by the 14-day RSI and has been very accurate on the buy side.
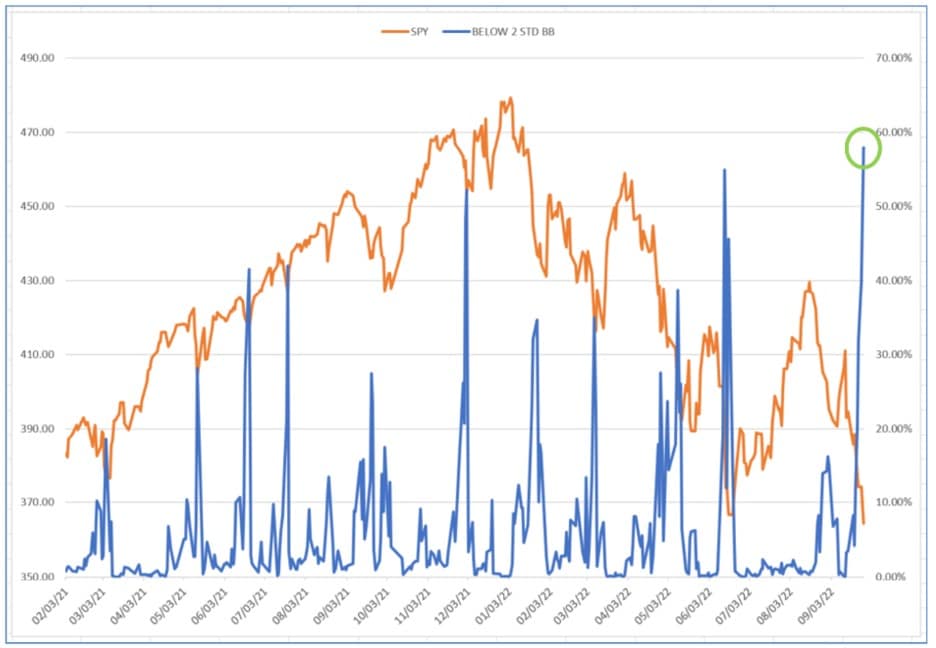
- 58% of Russell 1000 stocks are trading below their 2 standard deviation Bollinger Band. This is the highest reading, by a good distance, within the past 20 months. A reading above 40% is historically an extreme. (As a review, 95% of occurrences occur within 2 std dev). See chart below.
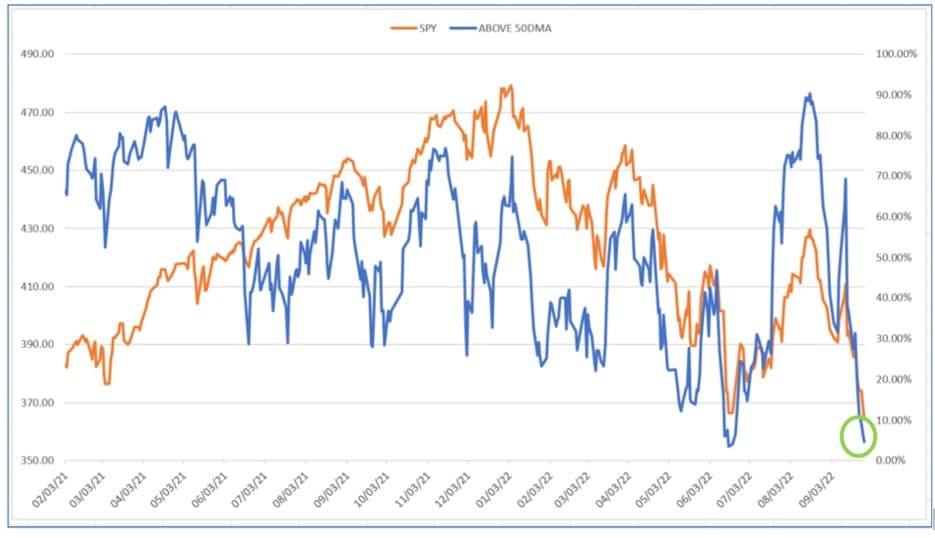
- Only 4.43% of Russell 1000 stocks are trading above their 50DMA. A reading below 15% is historically an extreme. See chart below.
Pair – Buy Bonds versus Stocks

Even though stocks are oversold, Bonds are very, very oversold. Yesterday, Deutsche Bank said that Global bonds are now in their first bear market in 76 years, after having dropped 20% from their peaks – using research dating back to 1786. The last time global bonds fared so poorly was in 1946 at the end of World War II.
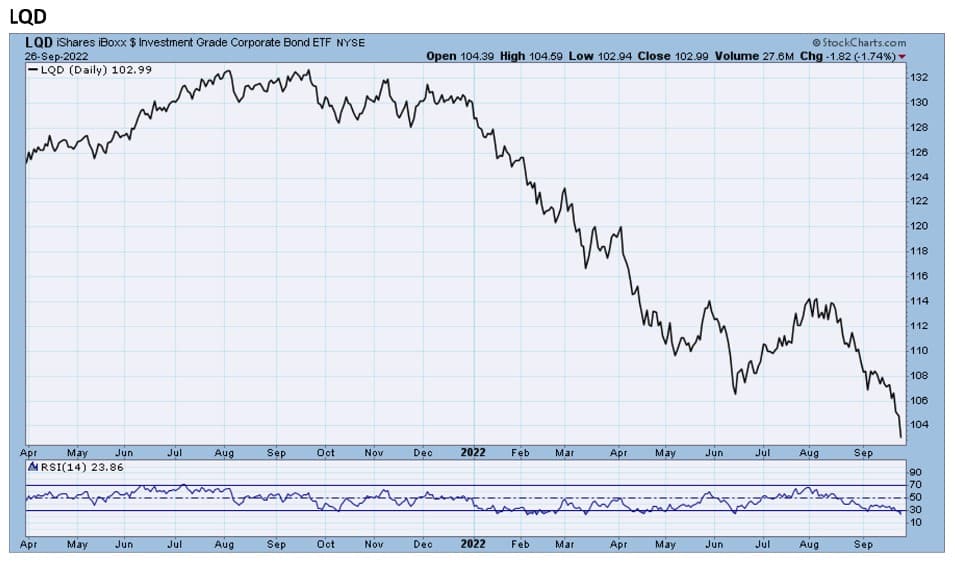
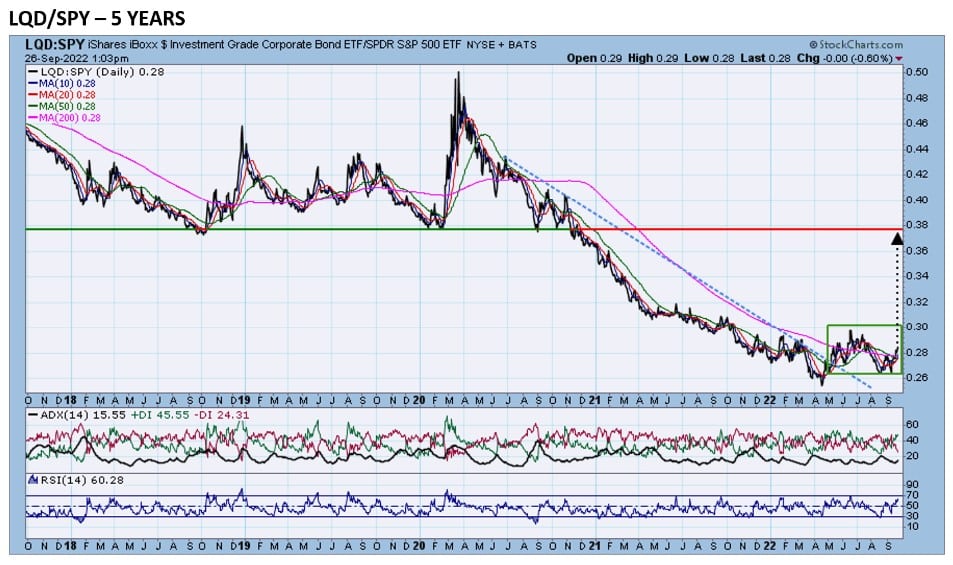
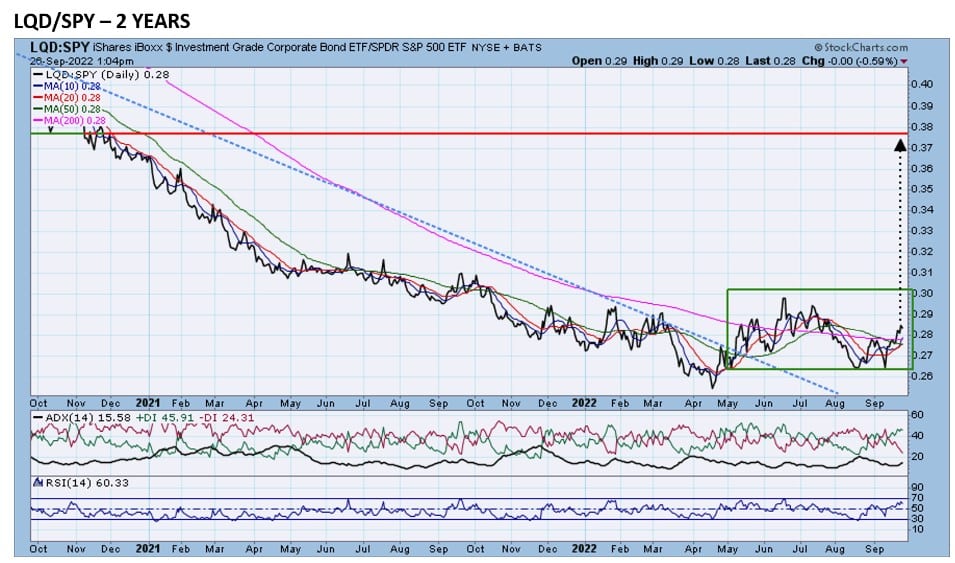
The first chart below shows Investment Grade Corporate Bonds (ETF-LQD) in the past 18 months. The RSI = 27. Chart 2 shows LQD versus the S&P500 (ETF-SPY). Note that LQD/SPY broke out of a 2-year downtrend in May and has held its breakout level for 4 months. The next level of long-term resistance is much higher just below the 0.38 level or 33% higher than Monday’s close (see chart 3).
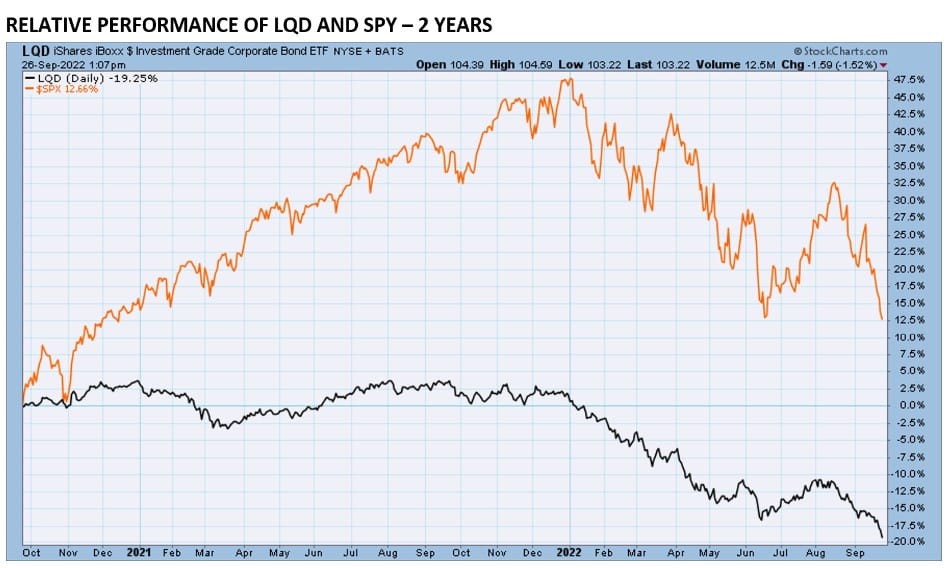
Chart 4 shows the relative performance of LQD and SPY over the past 2 years. SPY is still up 12%, but LQD is down 19%.


Jeff Marcus founded Turning Point Analytics (TPA) in 2009 after 25 years on trading desks and 13 years as a head trader to provide strategic and technical research to institutional clients. Turning Point Analytics (TPA) provides a unique strategy that works as an overlay to clients’ good fundamental analysis. After 10 years of serving only large institutions, TPA now offers its research services to mid and small managers, RIA’s, and wealthy sophisticated individuals looking for a way to increase their returns and outperform their peers.
Subscribe 2 Week Trial
Customer Relationship Summary (Form CRS)