


Quite often, year-end trading is not a function of recent economic trends, earnings projections, or other traditional economic/fundamental/geopolitical factors. Instead, window dressing, mutual fund rebalancing, tax loss selling, and other seasonal factors often take charge as December marches on. Accordingly, trading at the start of a new year is also heavily affected by the hangover or the reversal of year-end trades and tax gain selling. To help you appreciate why the new year makes a difference, consider the following question: If you can defer your capital gains liabilities (taxes) by a year just by waiting one trading day, why wouldn’t you?
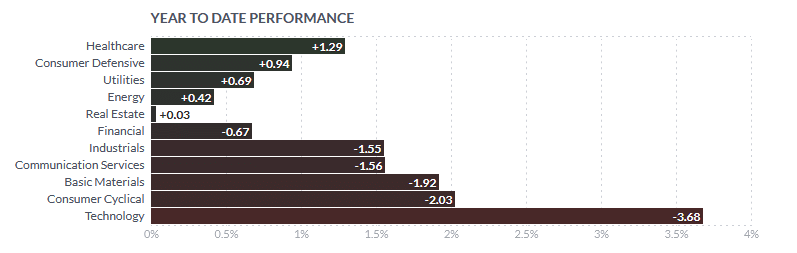
The question helps us appreciate why the Magnificent 7 and other stocks that grossly outperformed in 2023 largely fell flat on their faces to start 2024. Further, why last year’s underperformers, like healthcare, staples, and utilities, are 2024’s early winners. Entering 2024, our focus is on how investors deal with tax gains and remove any window dressing they don’t like. Such will probably greatly influence the markets for the next week or two. Afterward, the trends that were largely intact in 2023 will probably resume. However, at some point, a new narrative and a new set of stocks will lead the way. The bottom line is don’t mistake a new trend for tax gain selling and other year-end related trades.
What To Watch Today
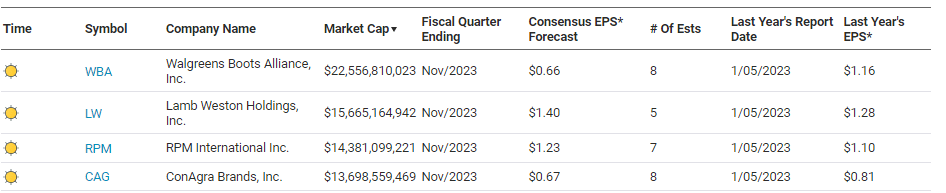
Earnings
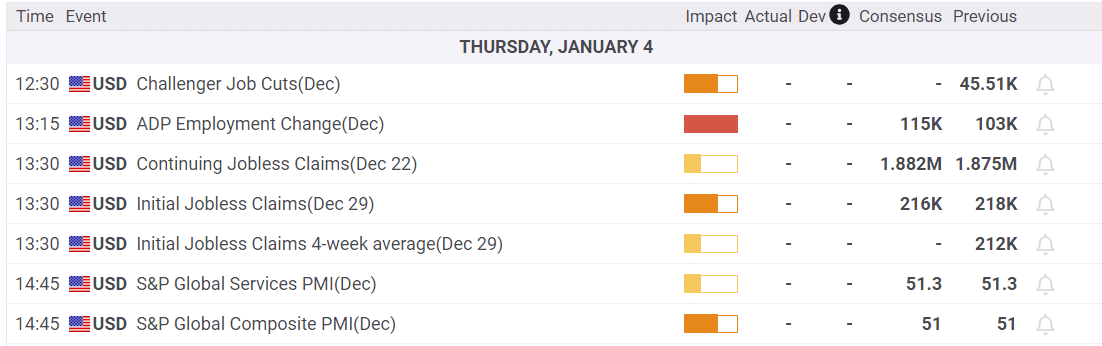
Economy
Investing Summit: Early Bird Registration Available Now
January 27th, we are hosting a live event featuring Greg Valliere to discuss investing in the 2024 presidential election. What will a new president mean for the markets, the risks, and where to invest through it all? Joining Greg will be Lance Roberts, Michael Lebowitz, and Adam Taggart for morning presentations covering everything you need to know for the New Year.
Register now, as there are only 150 seats. The session is a LIVE EVENT, and no recordings will be provided.

Market Trading Update
As we look forward to 2024, the question becomes, what will the markets do next? Will it be another year of Mega-cap stock dominance or a continued rotation into more defensive sectors? The answer to that question will be a function of whether we continue to see a disinflationary environment driven by slower economic growth or a rebound in activity. Also, what will the Federal Reserve do? Will it cut rates and ease monetary policy? These are all questions that we do not have answers to.
From a statistical perspective, the momentum and optimism from 2023 should carry into 2024. As shown in the table below, historically, when the market has a return of 20% or more, the following year tends to be positive.
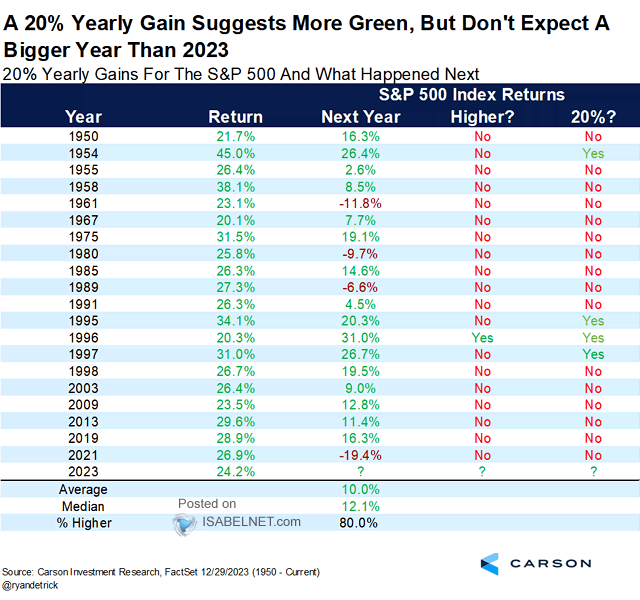
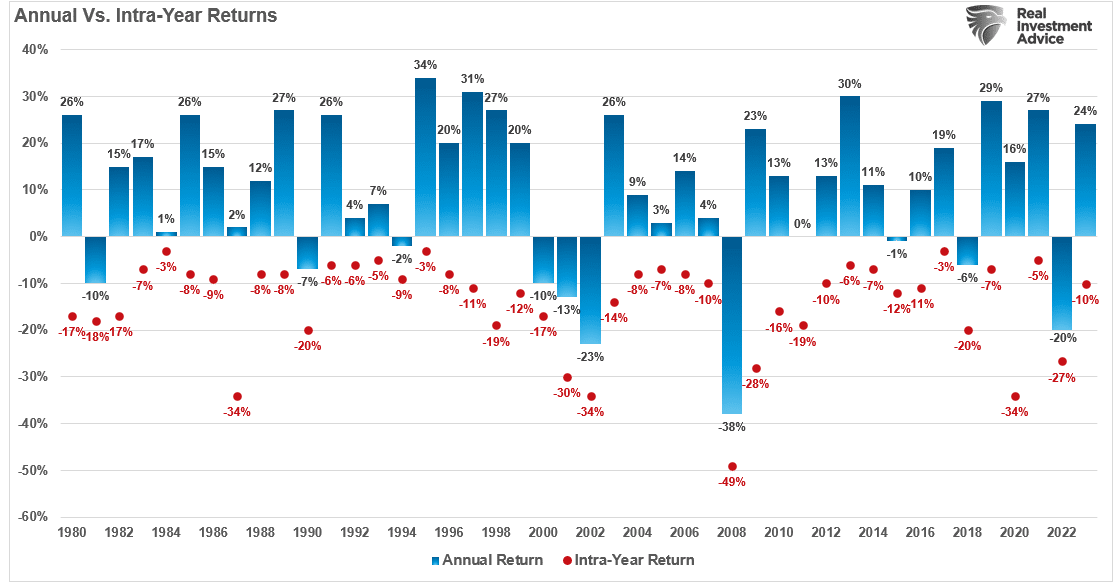
However, that does NOT mean there won’t be any bumps along the way. Just as in 2023, while the market sported a 24% return for the year, there was a 10% correction along the way, providing a better entry point for investors. As shown in the chart below, during every given year, there are corrections that are typically better buying opportunities.
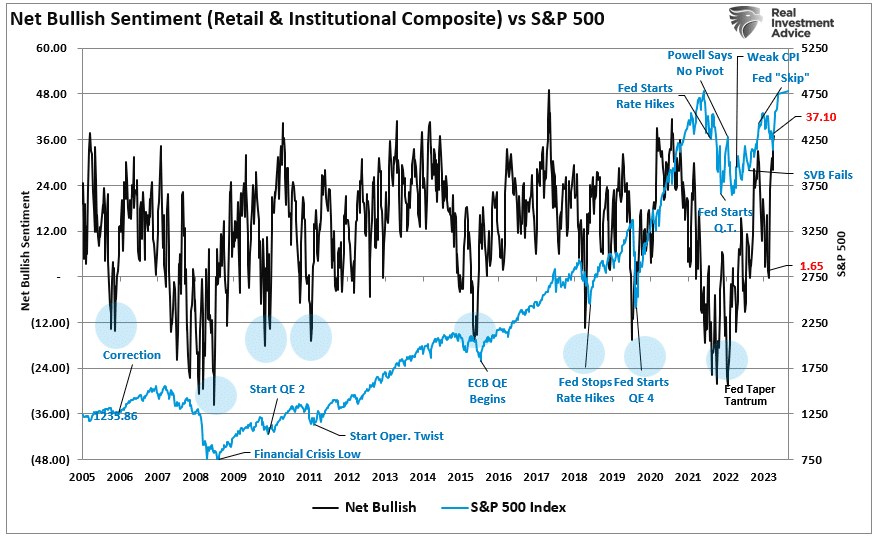
With investors currently very exuberant heading into 2024, the sell-off over the last couple of days was not only expected but needed to rebalance buyers and sellers. As shown, the Net Bullish Sentiment of both retail and professional investors reached levels that historically coincide with short-term corrections.
While there are currently very few reasons to bearish on the market, it does not mean that the market is entirely devoid of risks. And, as noted, investors should expect another 5-10% correction in 2024.

Demographics Matter
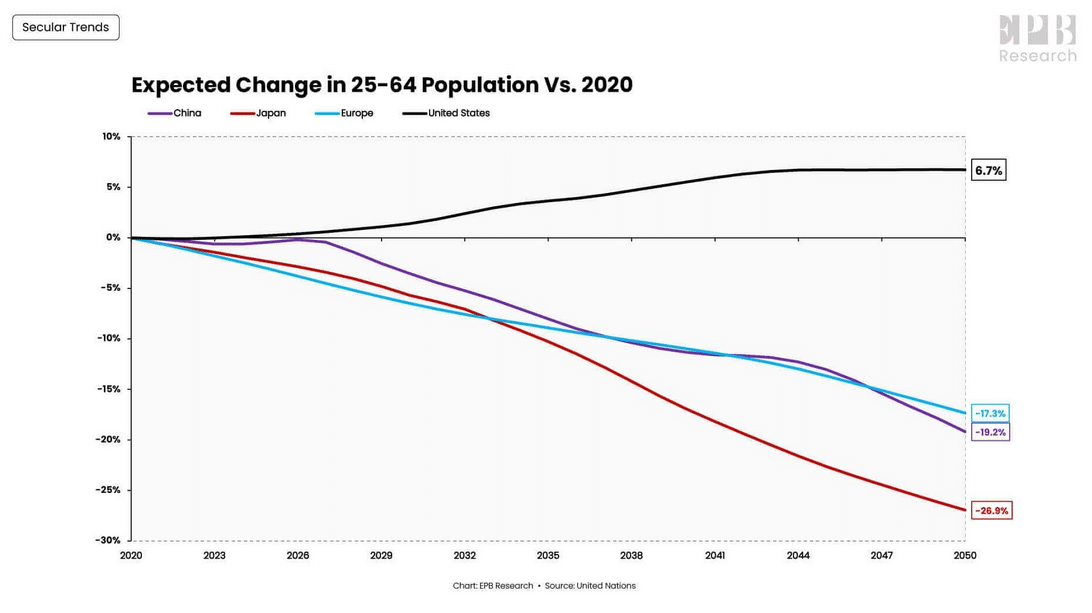
The first graph below from EPB Research shows that population projections since 2020 have changed favorably in the U.S., especially compared to China, Japan, and Europe. More growth of the working class population benefits economic activity and helps better support the elderly and children. On a relative basis, the data below, not including other vital factors like productivity and debt, provide a justification to expect more economic growth in the U.S. versus the rest of the developed world.
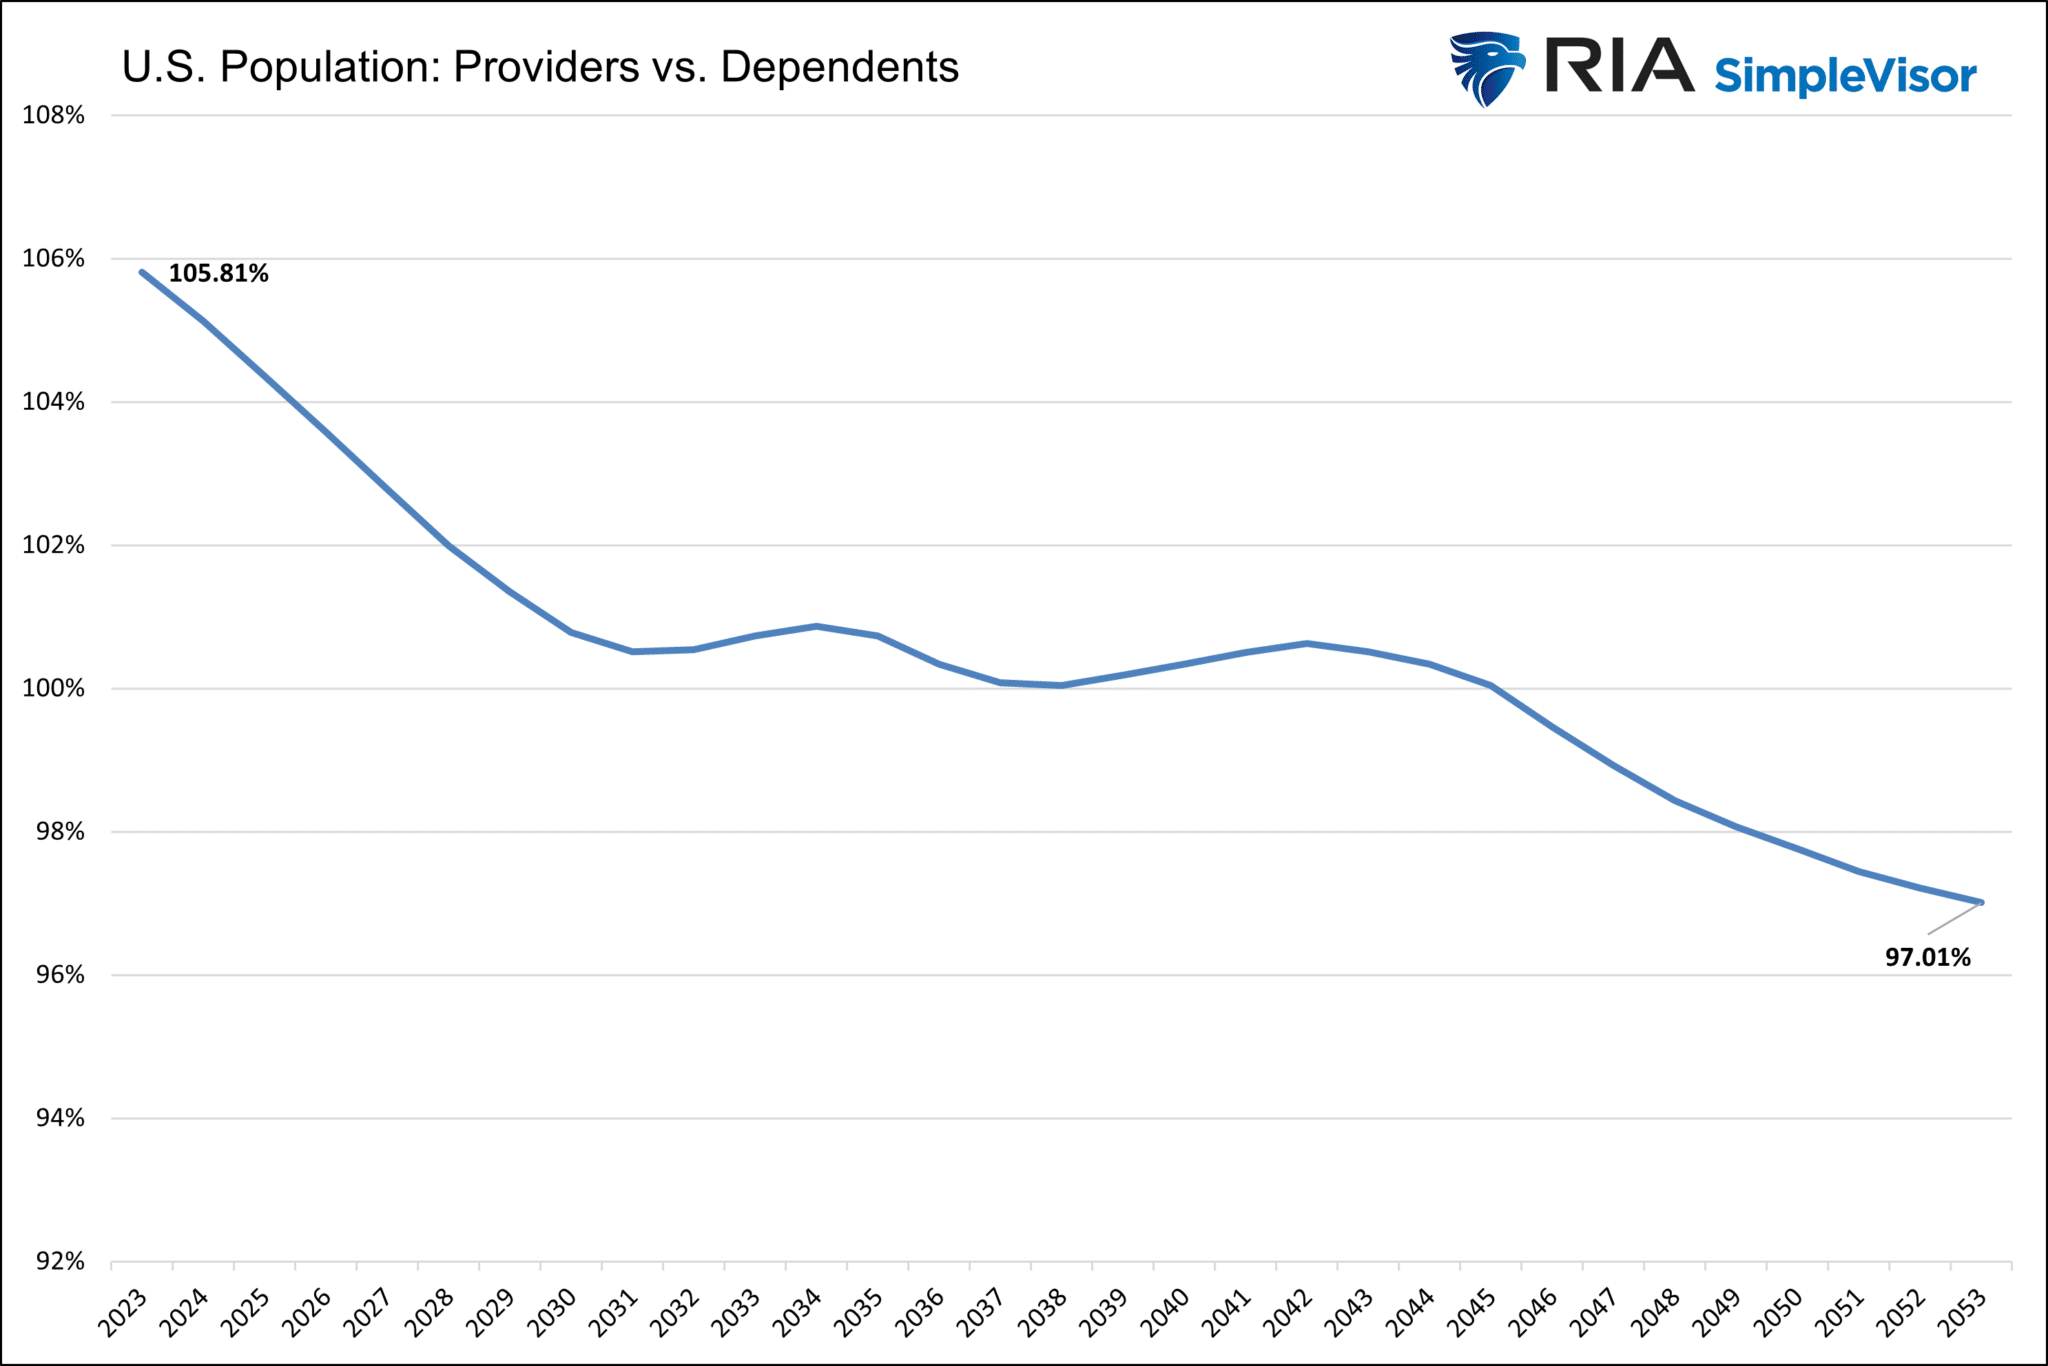
The argument’s flip side is that the graph and our comments above are relative compared to other nations. The following graph, with data from the CBO, shows that the percentage of people aged 25 to 64 is currently greater than those outside the age band. Generally, those aged 25-64 earn and spend the most. Simply, they provide the most economic activity. Further, in many cases, they support children and, in many cases, the elderly. Accordingly, the ratio of economic “providers” versus “dependents” is an important economic forecasting tool. The graph below shows that the ratio is expected to go from a net surplus of supporters to an even ratio by 2037. Afterward, the nation is forecasted to have more people needing economic support than providing it.
We want to stress the assumptions about who provides and who depends are generalizations. Plenty of those aged 65 and older support themselves and their kin in the 25 to 64 age group. We also appreciate that as time passes, inheritances from the older group will support the younger population.
JOLTS- A Preview Of Friday’s BLS Report
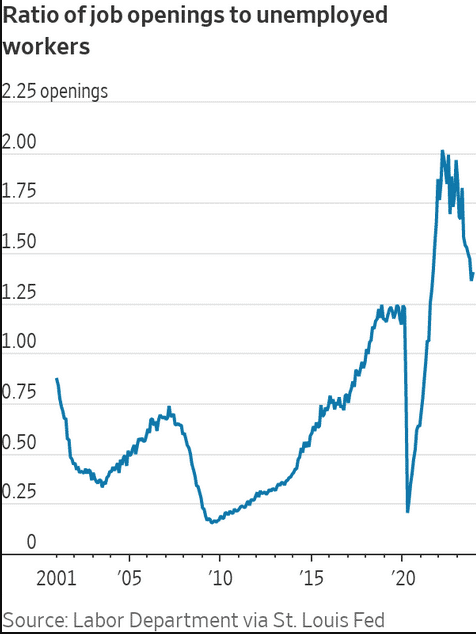
The latest Job Openings and Labor Turnover report, aka JOLTs, continues to paint a picture of a normalizing labor market. The number of job openings was little changed at 8.8 million, bringing the 3-month moving average below 9 million, the lowest in 2.5 years. Before the pandemic, the number of job openings were slightly over 7 million. Therefore, while the recent data may appear weak, they still reflect a robust labor market but one that is reverting slowly to historical norms.
Two data points in the report signal a more balanced labor market. First is the ratio of job openings to unemployed workers. As we share below, the ratio is near pre-pandemic levels and down significantly from the 2022 peak. Second, the quits rate is now back to its pre-pandemic levels. The quits rate increases when people are confident they can command a higher salary with a new job. The two points argue that wage pressures are subsiding rapidly. Therefore, the Fed should be a little more comfortable that inflationary pressures from higher wages are controlled.
While the report is generally good, there is one concern. Hiring rates in November are now below the levels seen in 2018-19.
Tweet of the Day
“Want to have better long-term success in managing your portfolio? Here are our 15-trading rules for managing market risks.”
Please subscribe to the daily commentary to receive these updates every morning before the opening bell.
If you found this blog useful, please send it to someone else, share it on social media, or contact us to set up a meeting.
Post Views: 5
2024/01/04