


The S&P 500 lost 8.6% this week and closed 6% below its 200-day average. Earnings haven’t cracked, which makes this a liquidity event. The question is whether the Fed blinks before the break hardens.
🏛️ Market Brief – Liquidation, Not A Crash
Last week, in VIX Spike: Complacency’s Bill Coming Due, we warned that low volatility eventually begets high volatility. That bill came due early. The S&P 500 fell 8.6% to 6,910, its seventh straight losing session and the longest losing streak since February 2020. The Nasdaq-100 dropped 10.4%, the Dow lost 8.0%, and the Russell 2000 slid 7.5%. At 11.6% below its October 6 record, the index is in “correction” territory, and the VIX nearly doubled to 37.
So was this a liquidation of leveraged positions due to margin calls? Partly, but not the way the headlines suggest. FINRA’s latest data put margin debt at $1.45 trillion in October, down 2.1% from September and 3.6% below June’s record. Margin borrowing was already easing before the week began.
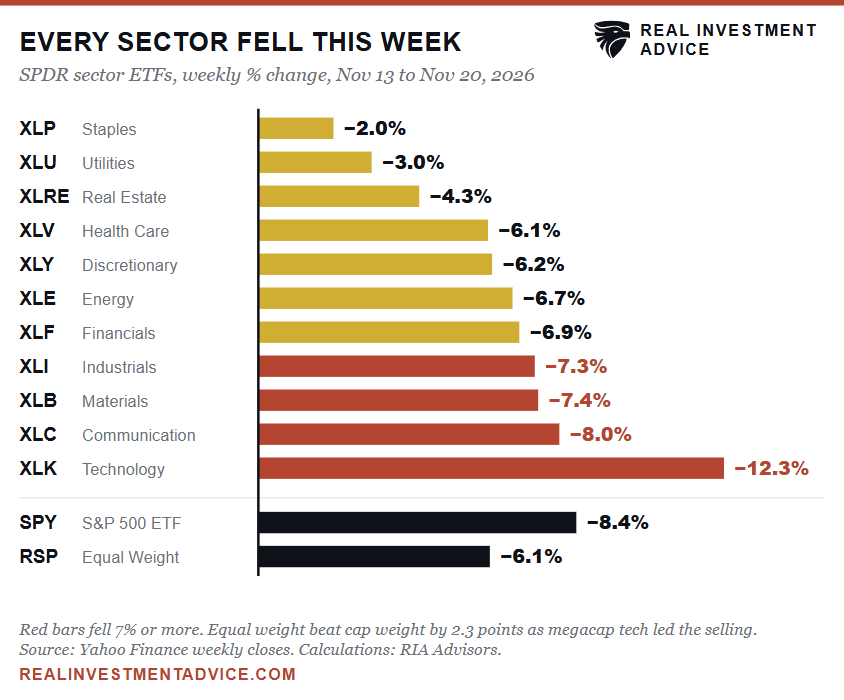
What we saw instead was mechanical deleveraging. On Thursday, just 38 S&P 500 stocks rose while 464 fell, and all 11 sectors finished lower, even staples. Goldman’s Rich Privorotsky called it “a pretty violent liquidation” in a note covered by ZeroHedge. Dealers were heavily short gamma into Friday’s monthly options expiration, which fed the afternoon selling. Desk chatter also had investors selling gold, copper, crypto and Nvidia to fund allocations in Anthropic’s IPO, which priced at $83 on Wednesday. Gold fell 9.5%, copper 10.2% and Bitcoin broke below $60,000.
Macro supplied the trigger. Fed Governor Christopher Waller called for a 50-basis-point hike at the December 8-9 meeting after a third straight 0.3% monthly gain in core CPI. The Commerce Department’s rule restricting remote access to advanced AI chips by Chinese firms took effect on Thursday, landing on the AI supply chain the same day. Meanwhile, the 10-year Treasury yield fell to 4.91% from 5.15%. The bond market is starting to price a growth problem, while the Fed is still fighting an inflation problem.
Here is the real question that needs an answer. “Have the fundamentals changed?” Not yet. Through FactSet’s November 13 update, analysts had raised fourth-quarter EPS estimates 1.1% since September 30, something that rarely happens mid-quarter, and third-quarter earnings grew 31.9%.
The Atlanta Fed’s GDPNow still tracks fourth-quarter growth at 3.4%, and initial jobless claims of 203,000 remain near historic lows. Cracks are showing only at the edges. The Philadelphia Fed index collapsed to 6.3 against expectations of 20, the Conference Board’s leading index fell 0.3%, and existing home sales hit their slowest pace since 2010. So far, this is a valuation and liquidity event, not an earnings recession. At 6,910, the S&P 500 trades near 16.6 times FactSet’s November 5 forward earnings estimate of $415.82, down from 17.7 times on that date.
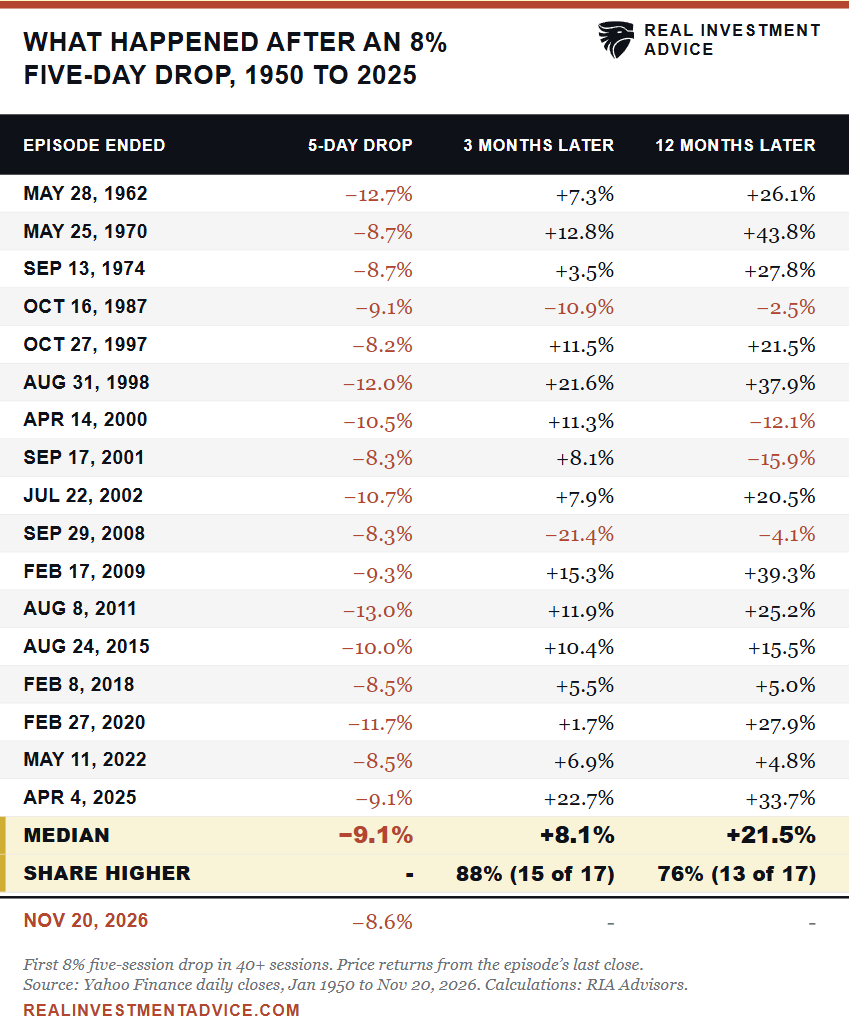
This suggests that the liquidation of positions is likely “overdone.” Since 1950, the S&P 500 has suffered 17 separate episodes in which it fell 8% or more over five sessions. It was higher three months later in 15 of them, with a median gain of 8.1%. The catch is that the median further drawdown along the way was 4.5%, so the bottom rarely arrives on schedule.
Next week, the main focus will be on the Federal Reserve. If Wednesday’s PCE data cools and Fed speakers soften, the setup for a reflexive rally is in place. If not, Privorotsky’s 2018 comparison, when the Fed kept hiking and stocks didn’t bottom until Christmas Eve, becomes the playbook.
📈Technical Backdrop – Oversold, Not Yet Repaired
The S&P 500 closed Friday, November 20, at 6,910.39, down 8.6% for the week. That leaves the index 6.0% below its 200-day average at 7,348.58 and 9.4% below its 50-day average at 7,625.25. It closed below the lower 2-standard-deviation Bollinger Band at 7,094. It also finished just 18 points above the lower 3-SD band at 6,892. To wit: the index ended the week 2.9 standard deviations below its 20-day mean.
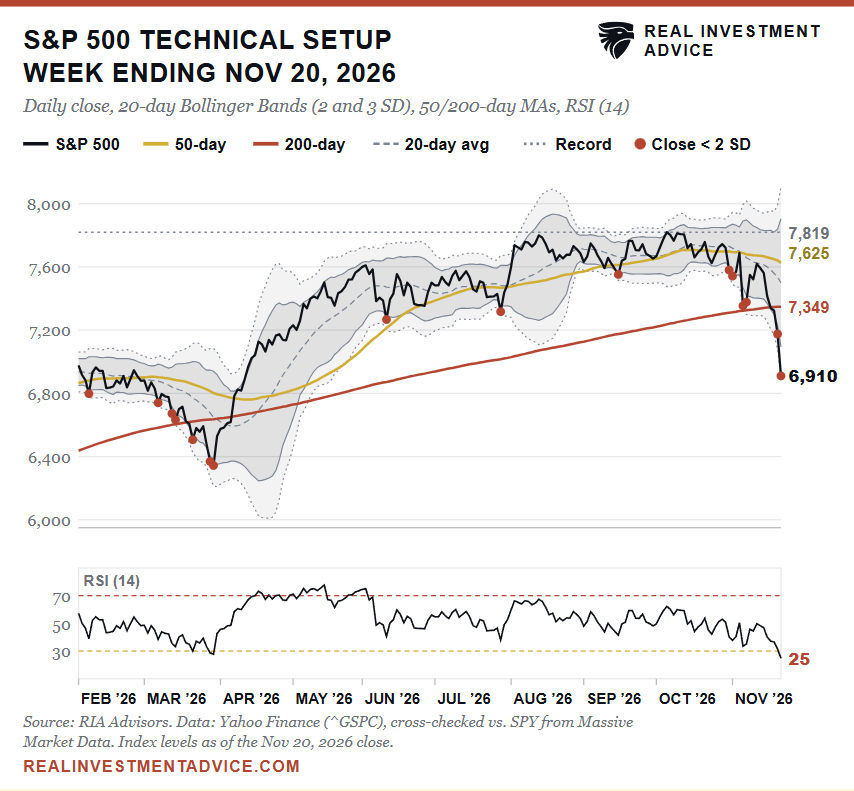
The technical backdrop is telling a more interesting story. First, momentum is confirming the extreme selling pressure this past week. On Friday, the 14-day RSI fell to 24.7. That is its lowest reading since April 8, 2025. That date is important as it marked the bottom of the tariff-driven selloff. Notably, during that selloff, the market was being priced for an impact on earnings growth from tariffs. However, currently, analysts continue to maintain or raise earnings estimates for the fourth quarter and next year.
Secondly, the MACD sits at −130 index points, well below its signal line at −75, and Williams %R is at −97. Such is what a forced-selling week looks like on a chart. Oversold is a condition, not a buy signal, and it can persist longer than anyone expects during a liquidation.
Third, breadth tells a more nuanced story. The equal-weight S&P 500 fell 6.1% against 8.4% for the cap-weighted S&P 500 index. The damage has been largely concentrated in the AI complex, with Technology falling 12.3%. However, semiconductors (SMH) dropped 17.8%, while Nvidia lost 22.9%.
Even the more defensive sectors couldn’t avoid the selling pressure. Staples and Utilities lost 2.0% and 3.0%, respectively. In other words, defensive stocks did their job of reducing the volatility, but they didn’t avoid it. The average stock is in better shape than the index, which helps any rebound broaden. But leadership is what broke, and leadership rarely heals in a week.
Volatility and bonds tell you what kind of selloff this is. The VIX closed at 37.24, nearly double last Friday’s 19.30. Meanwhile, the 10-year Treasury yield fell 24 basis points, and the long-bond ETF (TLT) gained 2.6% while nearly everything else fell. When bonds rally as stocks drop, investors are running from risk rather than scrambling for cash. Watch that relationship next week. If Treasuries start selling off alongside stocks, the liquidation has moved into a more dangerous phase.

In our portfolios, we used the decline to nibble on NVDA and PANW this week. However, these were very small additions, and something that we will likely continue to do into further weakness. Notably, these are NOT calls that the market has bottomed. Next week, we’ll trim value positions to raise cash. That keeps the dip buys from adding to overall equity exposure while the index sits below a level that matters this much. Our 7,000 risk line gave way on Friday, and we’re treating it that way.
For more aggressive traders, the playbook is to let the rubber band snap before acting. With the market at a 2.9-standard deviation (SD) extreme, a reflexive rally toward the lower 2-SD band near 7,094 should be expected. That is a tradeable reflex rally, but should be treated as a strict trade with defined exits.
The 200-day average at 7,349 is the first real test above the market currently. For now, use any rallies into that zone to rebalance and reduce risk rather than chase. However, on the downside, the 3-SD band at 6,892 is only a thin level of support. Any decisive break opens the April 7 close of 6,617, where the spring rally launched.
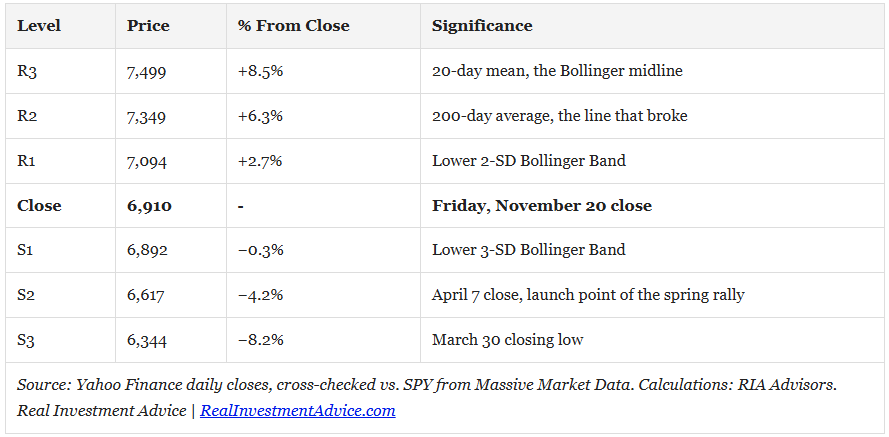
Next week, there is only one market level that really matters: 7,349. Any snapback toward the 200-day average would be normal from an oversold extreme this deep. What matters is whether the index can close and hold above it. That action will decide whether this break joins the healed ones or the deep breaks that keep going.
🔑 Key Catalysts Next Week
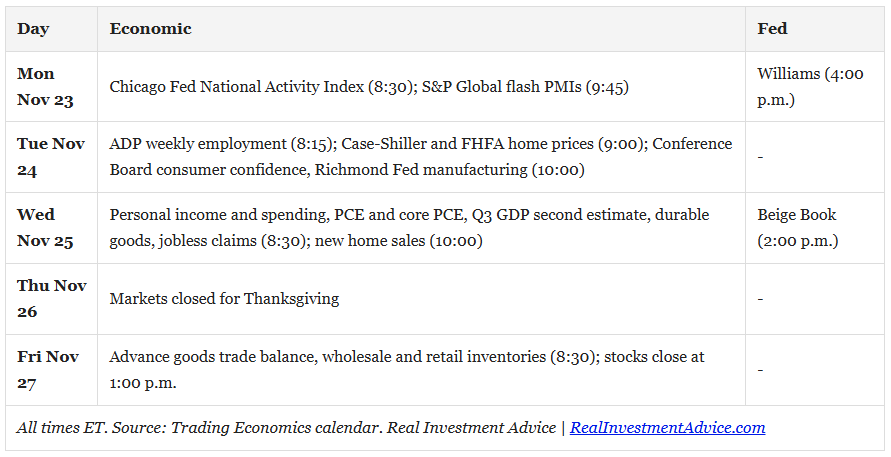
This coming week, Thanksgiving will compress everything into just three trading sessions. Markets are closed on Thursday, and then the market will close early at 1:00 p.m. ET on Friday. For investors, this is a week to turn off monitors and enjoy your family, as the thin holiday trading tends to magnify moves in both directions. With the VIX sitting at 37, this is where investors tend to make mistakes.
The dominant narrative is the Fed. Wednesday brings October personal income and spending. Economists expect core PCE to rise 0.3% for the month and 3.2% from a year ago. A hot print pushes the December debate from 25 basis points toward Waller’s 50. A soft one gives the doves cover. Futures already price in roughly a quarter-point December hike, so the debate is over size, not direction.
The Beige Book follows that afternoon, and New York Fed President John Williams speaks on Monday afternoon. As vice chair of the FOMC, Williams carries more weight than most. He pushed back on a half-point December hike on Tuesday, November 17. Any further sign of flexibility would land hard.
The second narrative is growth. Monday’s flash PMIs and Tuesday’s consumer confidence (expected at 92) will show whether the Philadelphia Fed’s collapse was a one-off. Wednesday also delivers the second estimate of third-quarter GDP, expected at 3.5%. Durable goods orders and weekly jobless claims are released on the same morning, with claims moved up a day due to the holiday.
Two wildcards sit outside the calendar. Anthropic fell 13% in its second session on Friday, according to Bloomberg, and how the largest IPO in history trades in its first full week will color AI sentiment into year-end. Geopolitics is the other. Wolfe Research’s Chris Senyek told Bloomberg that the absence of an Iran peace deal remains an overhang, alongside inflation and AI worries. Neither shows up on a release schedule. Both can move the tape in a holiday-thinned market.
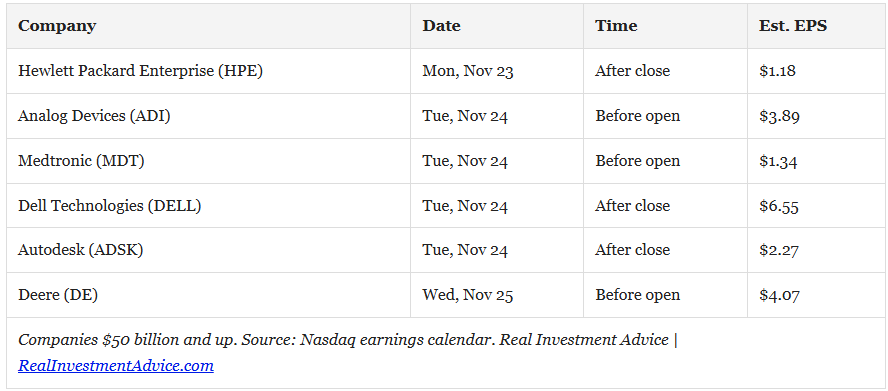
Earnings slow to a trickle, but the names that report matter for the AI debate. Dell and Hewlett Packard Enterprise offer a direct read on AI server demand after the new chip-access rules. Deere gives a check on the industrial and farm economy.
The single most important release is Wednesday’s core PCE. The asymmetric risk sits on the hot side. A 0.4% print would hand Waller his 50-basis-point argument going into a holiday weekend. That’s a dangerous mix with thin liquidity and a market already 6% below its 200-day average.
Need Help With Your Investing Strategy?
Are you looking for comprehensive financial, insurance, and estate planning services? Need a risk-managed portfolio management strategy to grow and protect your savings? Whatever your needs are, we are here to help.

💰 The 200-Day Average Broke. The Next 4 Weeks Are Critical
Here is a headline that caught my eye on Thursday: “Joachim Klement sold every stock he owned this week.” What is most interesting about that is that the Panmure Liberum strategist has kept his own retirement portfolio fully invested in equities for years. Earlier this week, however, he told clients that the index’s break below its 200-day average was his trigger, and Brett Arends reported on that for MarketWatch.
“The S&P 500 has now broken below its 200-day moving average, and hence, at the end of European trading, I will sell my personal holdings in stocks and move into long-term government bonds.”
Don’t mistake Klement for a perma-bear chasing headlines. He isn’t. Rather, Klement is widely respected and broadly cautious, and notably he conceded that the signal “is not foolproof.”
“While this indicator is not foolproof, market dynamics have turned decisively bearish, in our view. We have consistently warned of an AI bubble since May and have become more bearish since September.”
While the market rallied back above the 200-day average on Thursday, I thought the headline was worth walking through the importance of the 200-day average, as it will happen again, just as it did this past March. That break has been forgotten by the market, but when the Iran crisis erupted, the index broke below the 200-day average for the first time since May 2025. That was when I wrote The 200-DMA Just Broke: What Every Investor Should Know. That analysis found that 4 weeks was critical to deciding what to do next. Fortunately, that break in March only lasted 13 sessions. Six months later, the S&P 500 was 15.8% higher.
The point worth reviewing isn’t whether the 200-day average broke. It’s whether it stays broken.
The Break Started Small. It Didn’t Stay That Way
So, what happened this week that made Klement take action? On November 17, the S&P 500 closed at 7,340.53, four points under its 200-day average at 7,344.53. That ended a run of 155 straight closes above the average that began on April 8. The next session it closed at 7,323.63, just 0.31% below an average that is still rising. By Friday, November 20, it had closed at 6,910.39, 6.0% under the average at 7,348.58. Notice in the chart below that the average climbed all year, including 0.79% over the 20 sessions through November 20.
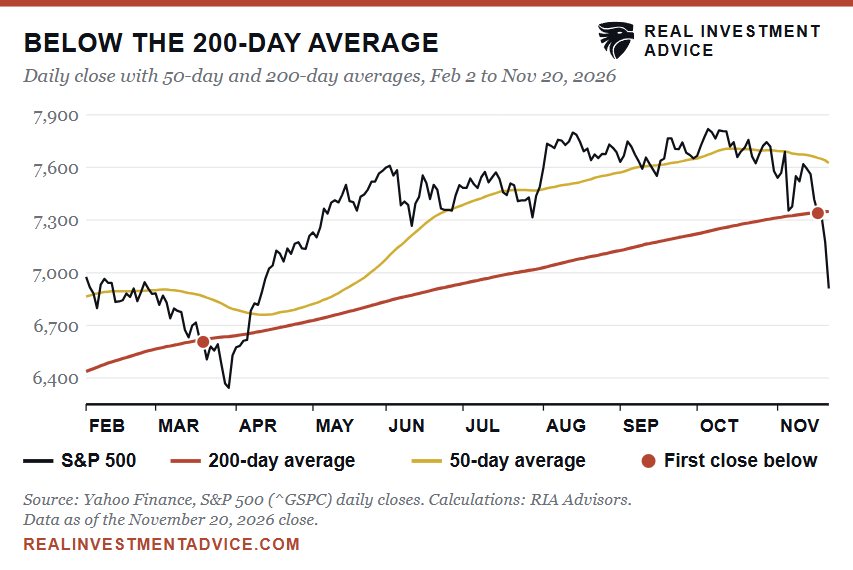
Such is the problem with treating a single close as a verdict. Everything else deteriorated quickly. The S&P 500 sits 11.6% below its October 6 record of 7,818.93, and the 50-day average is now more than 700 points higher at 7,625.25. The 200-day average tells you the long-term trend is being tested. It doesn’t tell you how the test ends.
One important note as we update the March analysis. Every one of the 34 first breaks since 1950 happened while the long-term average was rising, so its slope describes the setup rather than sorting the “whipsaws” from the real thing. That job falls to time.
Half Of 200-Day Average Breaks Don’t Last Four Weeks
Carson Investment Research circulated a table this week of every first close below the 200-day average after a run of 150 or more days above it. I rebuilt that analysis using Yahoo Finance daily closes, and the figures tie out row for row. (My series starts in January 1950, so the July 1950 signal falls inside the 200-day warmup, leaving 34 completed cases.) However, if we go one step further, we can split them by the question that actually matters. Was the S&P 500 back above its 200-day average 20 trading sessions later?
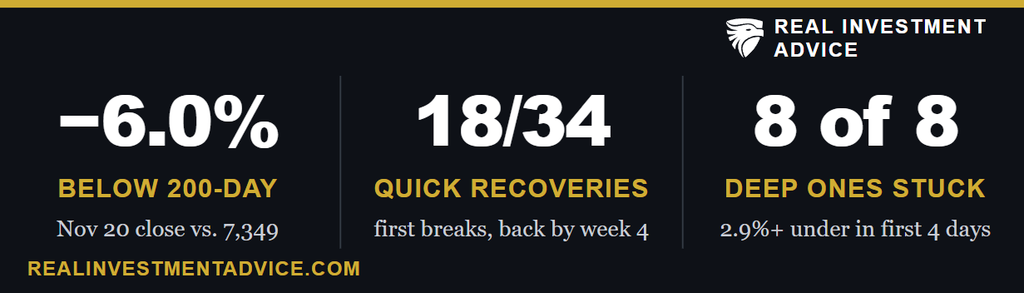
Eighteen of the 34 were.
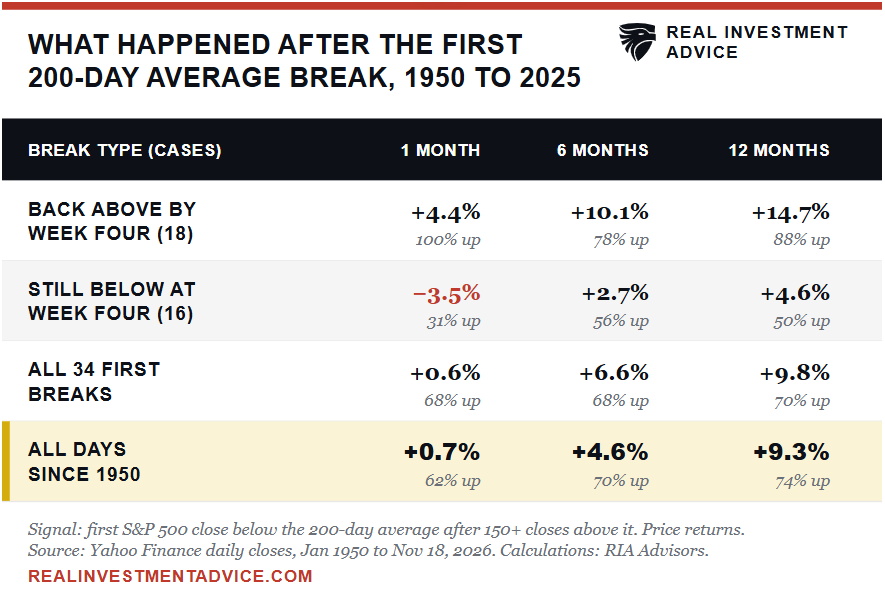
Those 18 “failed” breaks turned “sell everything fear” into buying opportunities. The index averaged 4.4% over the following month and was higher in all 18 cases. Twelve months out, the average gain was 14.7% with 88% of cases positive. That’s well ahead of the 9.3% average for any day since 1950.
However, and very importantly, the other 16 tell a different story. When the S&P 500 was still below the 200-day average four weeks later, the average one-month return was −3.5% and the 12-month return was a coin flip. Half were positive. The median was 0.0%.
Here is the problem. When you lump all 34 historical events together, the returns look almost exactly like a random day in the market, which is the whole point. The first close mixes two very different outcomes into one average. The next four weeks tell you which one you’re in.
Depth in the first few sessions has been the tell. All 8 first breaks that ran 2.9% or more below the 200-day average within four sessions were still below it at week four: 1969, 1987, 1990, 1994, 1998, 2011, 2020 and 2025. This break reached 6.0% below the average by its fourth session, on November 20. Every break that went this deep this fast was still below the line a month later.
The Pain Comes Early, And So Does The Whipsaw
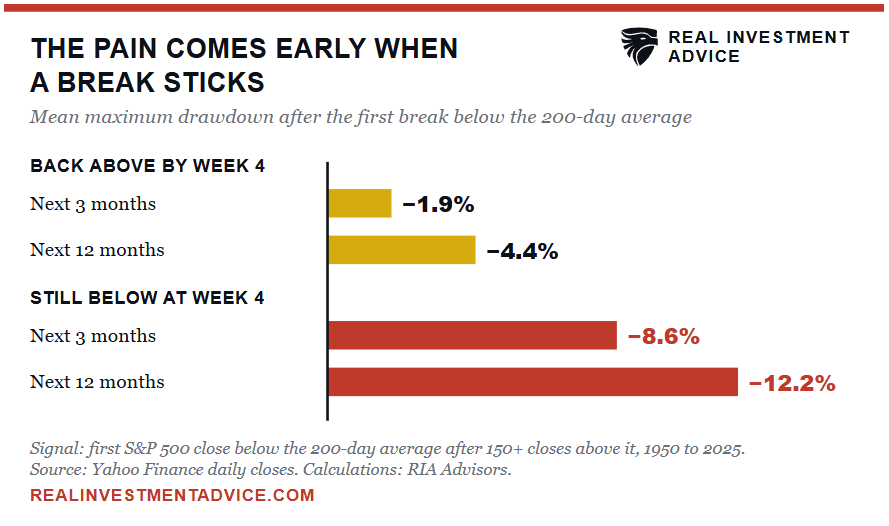
Notably, this is where Klement’s rule earns its keep. When the market breaks the 200-day average, and it sticks, the damage comes quickly. Over the next three months, the average maximum drawdown was −8.6%, against −1.9% for breaks that reversed. The worst cases came in 1962, October 1987, and February 2020. Each fell roughly 24% to 25% from the signal close within a year.
So, this is where someone will tell you that’s exactly why you sell on the first close below the 200-day average, and there is merit to that point. Meb Faber’s research on trend-following rules showed a moving-average discipline kept investors out of the worst of the dot-com bust and the financial crisis. However, and this is very critical, Faber’s model only checks the 10-month average once a month. Once a month equals 4 weeks, which filters out breaks below the 200-day average that didn’t stick.
I like Meb’s rule because a daily trigger pays a different toll. In the 18 breaks that reversed, the index closed back above the line within about five sessions. On average, that was 1.6% above where a seller got out. A strict crossover rule then fired another 1.4 sell signals, on average, over the next three months.
As Klement noted, he expects that churn, and that certainly goes to his credit. Bob Farrell’s Rule #8 explains why even real breaks chop: bear markets have three stages, a sharp decline, a reflexive rebound, and a drawn-out fundamental downtrend. In February 2020, the index regained the line two sessions after the break, then fell more than 25% from that rebound within three weeks.
One very important point is that a quick recovery isn’t an “all clear” either. In August 2007, the index was back above the line within a month, topped in October, and was 12.8% lower a year later.
However, here is the one detail that matters most. Measured from the four-week mark, the breaks that stuck still averaged a 9.0% gain over the next year. The breaks that reversed averaged 9.6%. Most of the asymmetry is decided in the first month, which is why the next four weeks matter more than the first close.
“Selling everything on the first close below the 200-day average isn’t risk management. It’s a coin flip with transaction costs.”
What Should Investors Do Now
As we noted last week in VIX Spike: Complacency’s Bill Coming Due, low volatility eventually begets high volatility, and this break fits the pattern. We’re not ignoring the signal, and we’re not liquidating portfolios on the basis of one week of forced selling either. We nibbled on NVDA and PANW as they declined this week. Next week, we will trim value positions to raise cash and reduce market exposure.
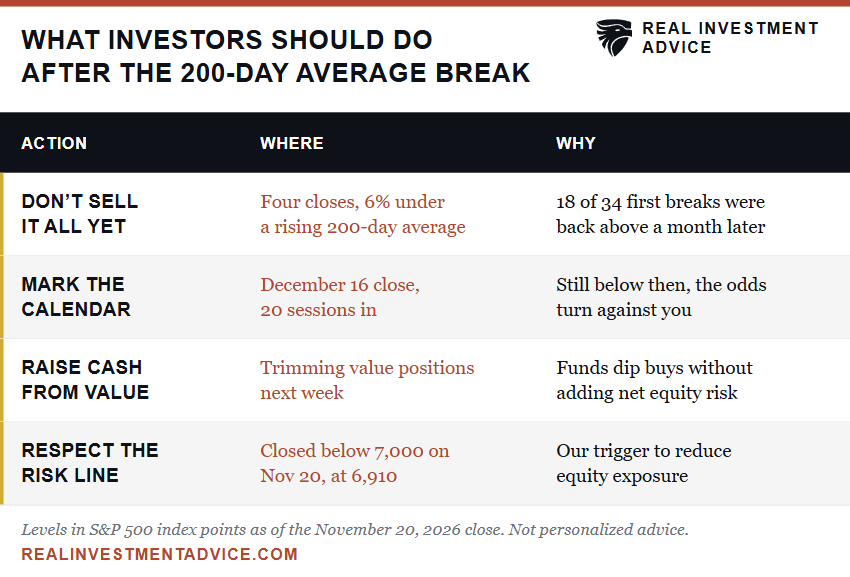
Here is the timing. The first market close below the 200-day average was on November 17th. That close started the four-week clock, which expires at the December 16th close. If the S&P 500 is back above its 200-day average by then, history suggests the break was noise rather than a top.
However, if we remain below the 200-day average, the odds shift, and equity exposure needs to adjust accordingly. In the meantime, trimming value positions raises cash without betting on either outcome. The S&P 500 closed below our 7,000 risk line on November 20, at 6,910, which is why that cash raise starts next week.
Klement may well be right about the “AI bubble.” Being right about the bubble and being right about the timing are NOT the same bet. A break of the line can flag the risk, but it takes a month to tell you whether the risk is real.
“So far, this is a valuation and liquidity event, not an earnings recession.”
The first close below the line is rarely where the damage gets done. The next four weeks are.
🖊️ From Lance’s Desk
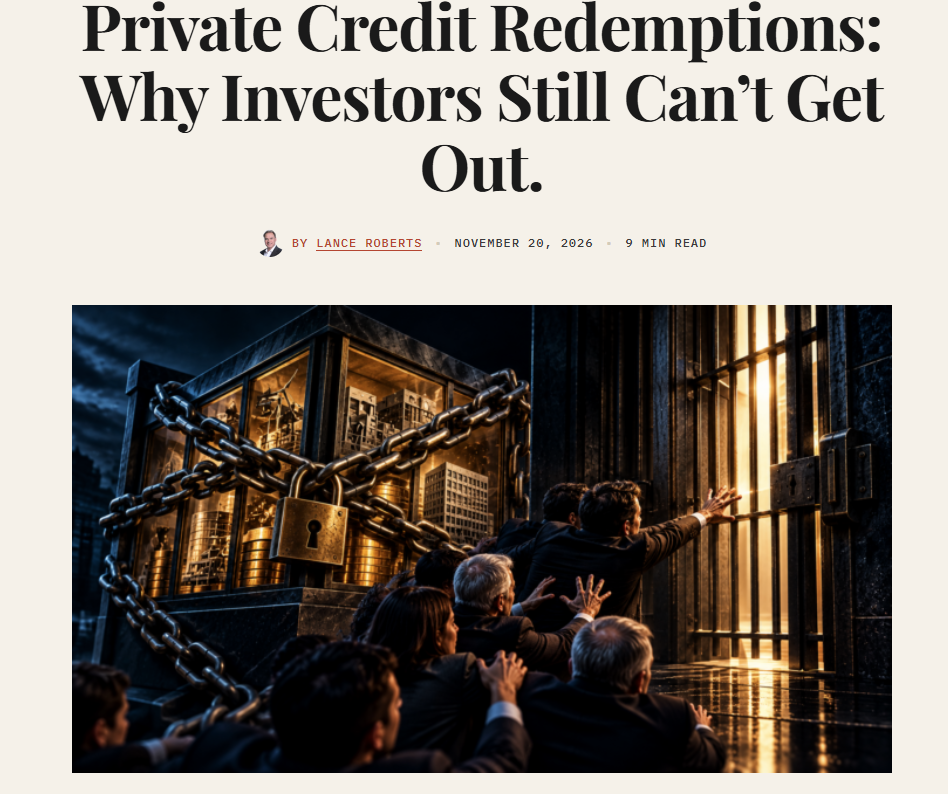
This week’s #MacroView blog explores the world of private credit, and while redemption requests are falling, most funds still return only 5% of shares per quarter.
Also Posted This Week:
📹 Watch & Listen
Stocks are poised to rebound after five consecutive days of selling, with NVIDIA, AMD, and other technology stocks leading the recovery. But is this the beginning of a sustainable market rally, or just a temporary bounce?
Subscribe To Our YouTube Channel To Get Notified Of All Our Videos
📊 The Weekly Market Dashboard
Weekly technical overview across key sectors, risk indicators, and market internals

💸 Market & Sector X-Ray: Market Gains Ground
Last week we noted that: “The successful test of the 200-dma is encouraging, but we need to see some follow through buying and a pick up in the Technology sector if we are going to move the markets higher into year-end.” That didn’t happen. The liquidation across all markets was brutal last week. Now, virtually all markets, as noted below, are extremely oversold which sets the market up for a strong reflexive bounce to sell into and rebalance risk for now.

📐 Technical Composite: 13.68 – Market Is Washed Out
The technical condition deteriorated sharply last week As noted below, the market is close to previous was out lows where strong buying opportunity have previously existed UNLESS we are in the process of a recession/credit related event with a full reversal of earnings expectations. That is not the case currently.

🤑 Fear/Greed Index: 42.96 – Sentiment Heading Lower
With the market sliding this past week, net positioning and sentiment have deteriorated further. Overall, sentiment and positiong remain in neutral territory but are sliding close toward complete “risk off” territory. As noted above, those more extreme levels tend to be associated with reduced earnings expectations, recession, or credit-related events which currently aren’t present.

🔁 Relative Sector Performance
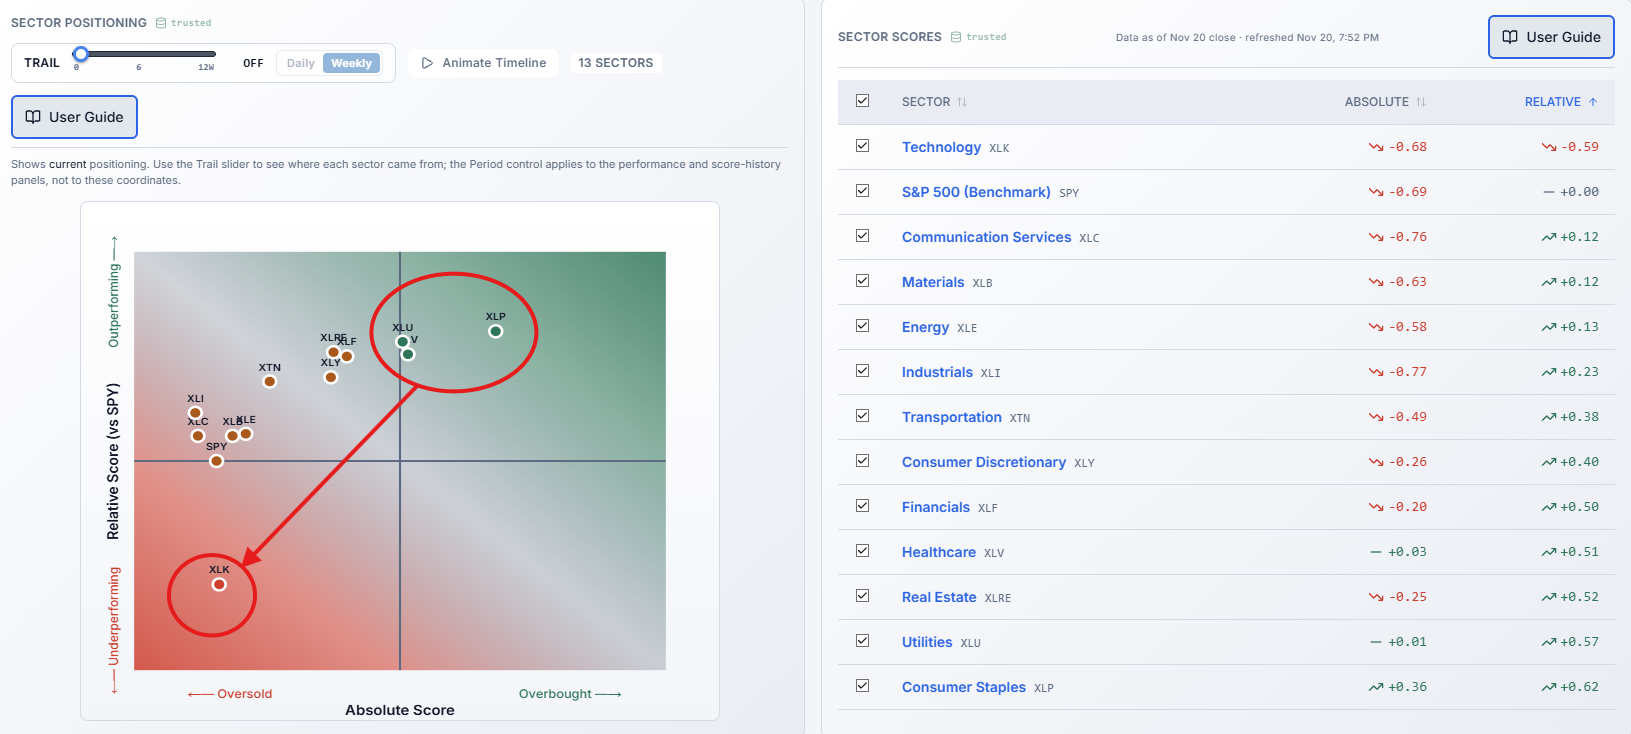
As shown below, the Healthcare, Staples, and Utilities remain more overbought, while the Technology is the most oversold. Historically, these more extreme deviations, as noted last week, have been a precursor to a rotation, while that didn’t happen this past week, doesn’t mean it won’t.
📊 MFBR Index (Money Flow/Breadth Ratio Indicator)
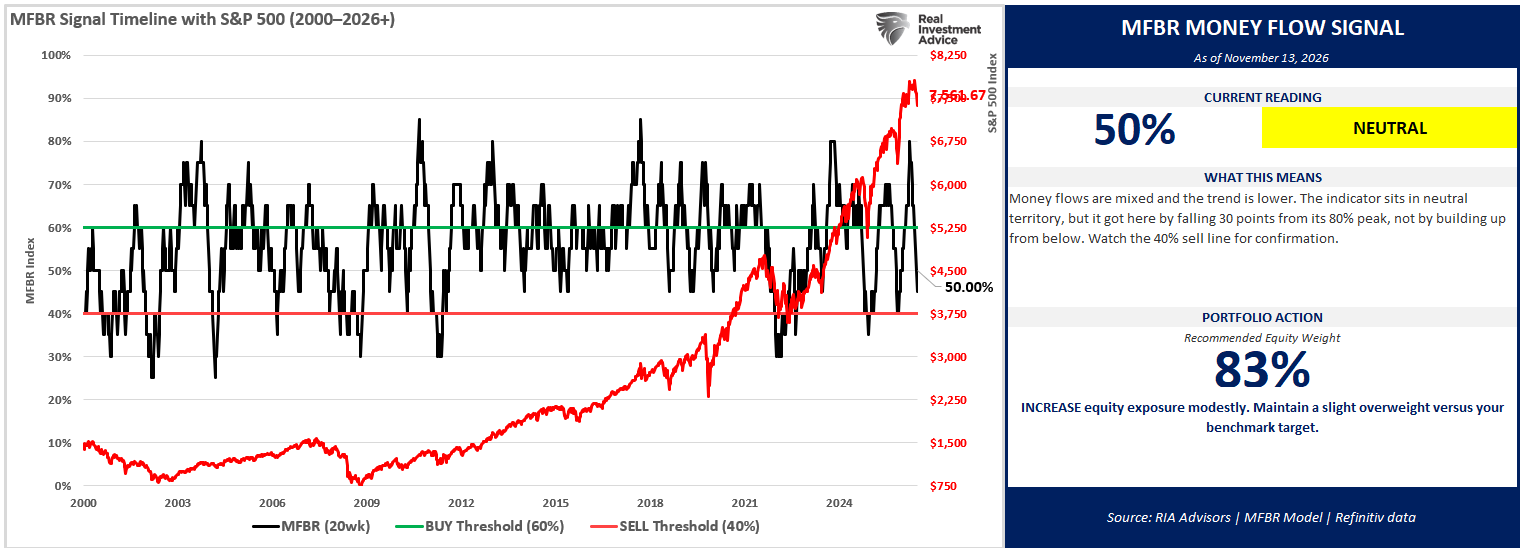
The Money Flow Breadth Ratio (MFBR) model is a rules-based equity allocation framework that uses weekly S&P 500 money flow data to generate buy, sell, and neutral signals. The MFBR systematically adjusts portfolio equity exposure in response to the direction and persistence of institutional capital flows. It aims to reduce drawdowns while capturing the majority of market upside.
“As of November 20, 2026, with the S&P 500 at 6,910.39, the Money Flow Breadth Ratio (MFBR) stands at 45%, down from a peak of 80% set 14 weeks ago and falling versus 50% the prior week. The trailing four-week change is -10 percentage points, and the near-term trend has rolled over. This places the indicator in neutral territory (40-50%). The raw zone signal reads NEUTRAL, but the model still flags a TOP REVERSAL, with 35 points now off the 80% peak. This is the lower half of the neutral band, and the path matters: the gauge is still sliding out of overbought, not bouncing off a low, and the 40% sell line is now just 5 points away.
Bottom line: hold the carried 83% target for now, but treat it as a weight already on the books, not a fresh buy. The roll-over off the 80% peak has now taken the gauge 35 points lower, into the lower half of the neutral band, where falling readings have averaged just +1.3% over 26 weeks. The 8-week hold keeps the target locked for 3 more weeks; unconstrained, the grid already reads 58%. A break below 40% would move the grid into the sell zone (25% if still falling); a turn back up would lift the grid to 75%, though the backtest flags rising readings in this band as a trap.”
📊 Sector Model & Risk Ranges
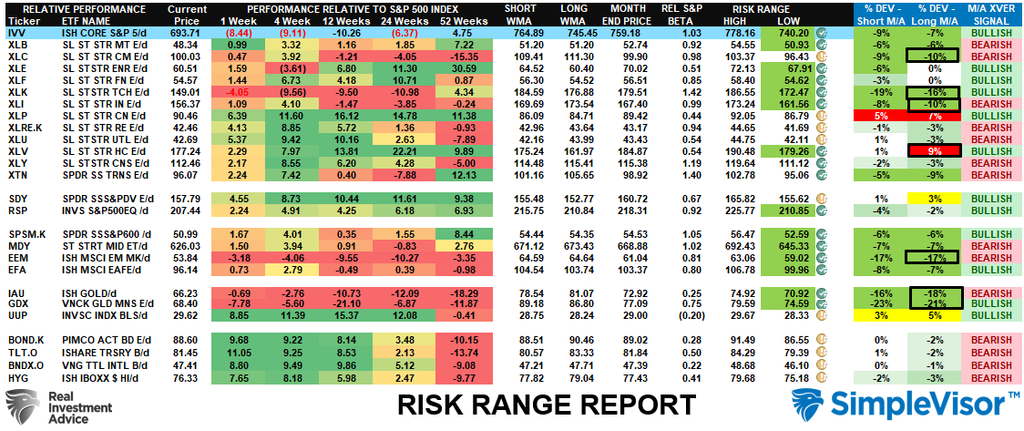
We noted last week that “Energy remains extremely elevated above long-term means, and Healthcare has now joined that club.” This past week, the market rout changed all of that. Communications, Financials, Technology, Emerging Markets, and Gold/Miners are now 10% below their long-term weekly means. These are historically extremely washed-out levels, which provide much better entry points for future returns.
Have a great week.
Lance Roberts, CIO, RIA Advisors

Lance Roberts is a Chief Portfolio Strategist/Economist for RIA Advisors. He is also the host of “The Lance Roberts Podcast” and Chief Editor of the “Real Investment Advice” website and author of “Real Investment Daily” blog and “Real Investment Report“. Follow Lance on Facebook, Twitter, Linked-In and YouTube
Customer Relationship Summary (Form CRS)