


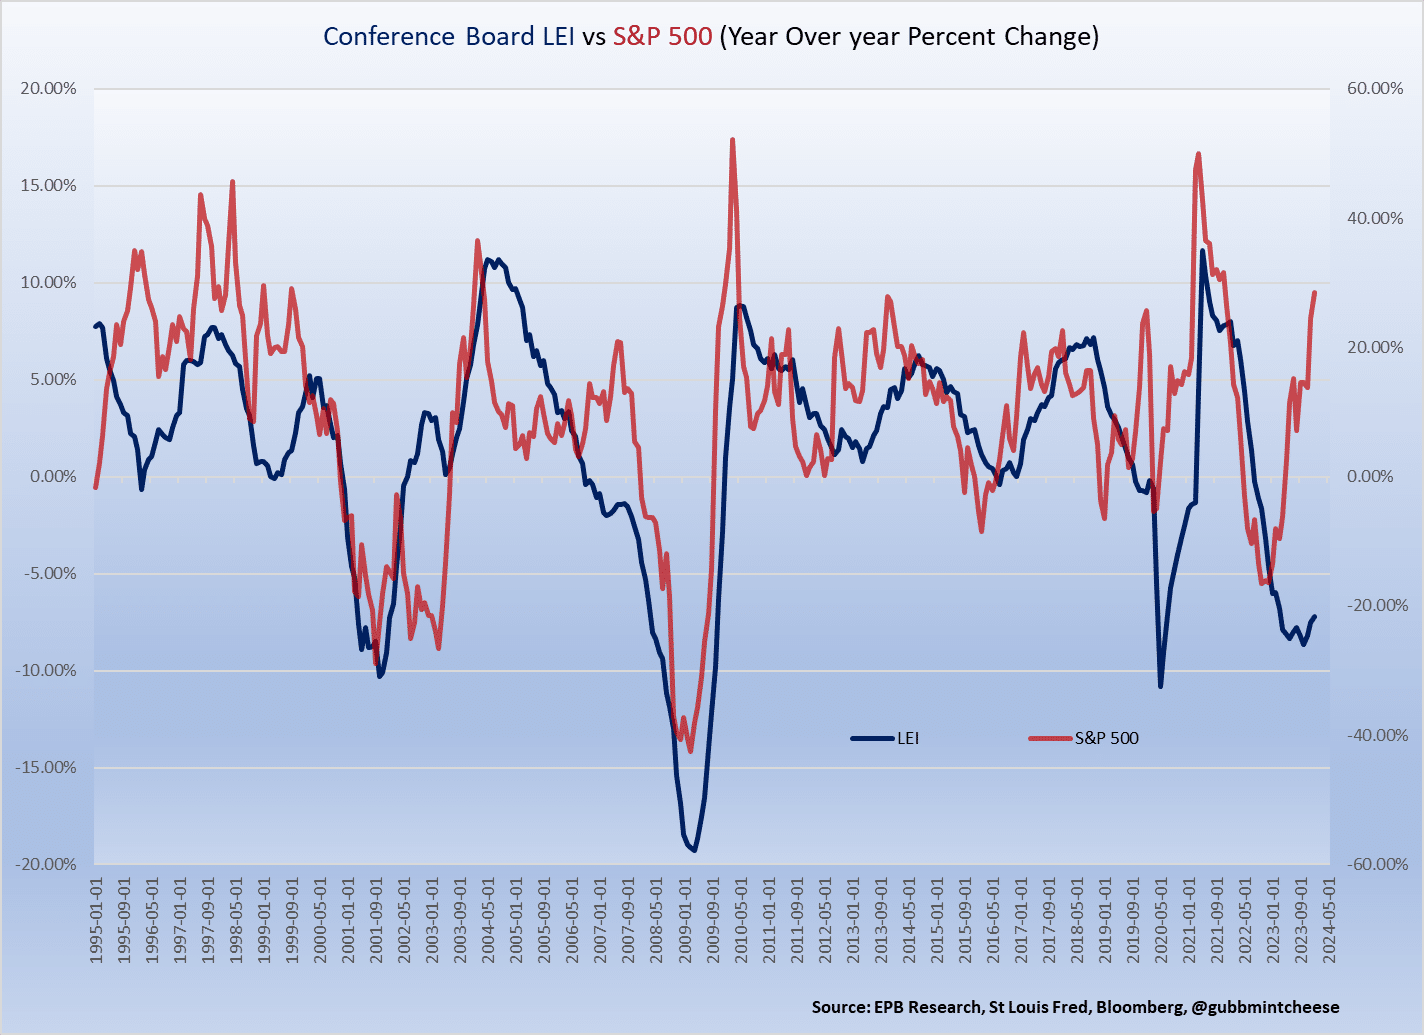
As we noted in our current Weekly Newsletter, Conference Board Scraps Its Recession Call, the Conference Board, publisher of the well-followed leading economic indicators (LEI), has rescinded its recession prediction. As we wrote: “According to the Conference Board, the reason for the retraction of the recession call was the improvement in underlying indicators.” While it’s tempting to think we are out of the woods on the economic front, the graph below, courtesy of @gubbmintcheese, warns of a significant divergence between LEI and the S&P 500.
The obvious takeaway from the graph is that the Conference Board’s LEI and S&P 500 are historically well correlated. Such makes a lot of sense. Corporate earnings tend to grow when the economy is doing well; thus, their stock prices rise. While the correlation is strong, there are periods where the S&P 500 leads LEI, such as 2020, 2013, and 2017. There are other times when LEI led the S&P 500, such as the lead-up to the 2008 financial crisis. Who’s leading who is a very important question today. As the graph shows, the divergence between the LEI and the S&P 500 is among the largest since 1995. Is LEI set to turn significantly positive, as the Conference Board must believe, or will the market catch down to LEI?
What To Watch Today
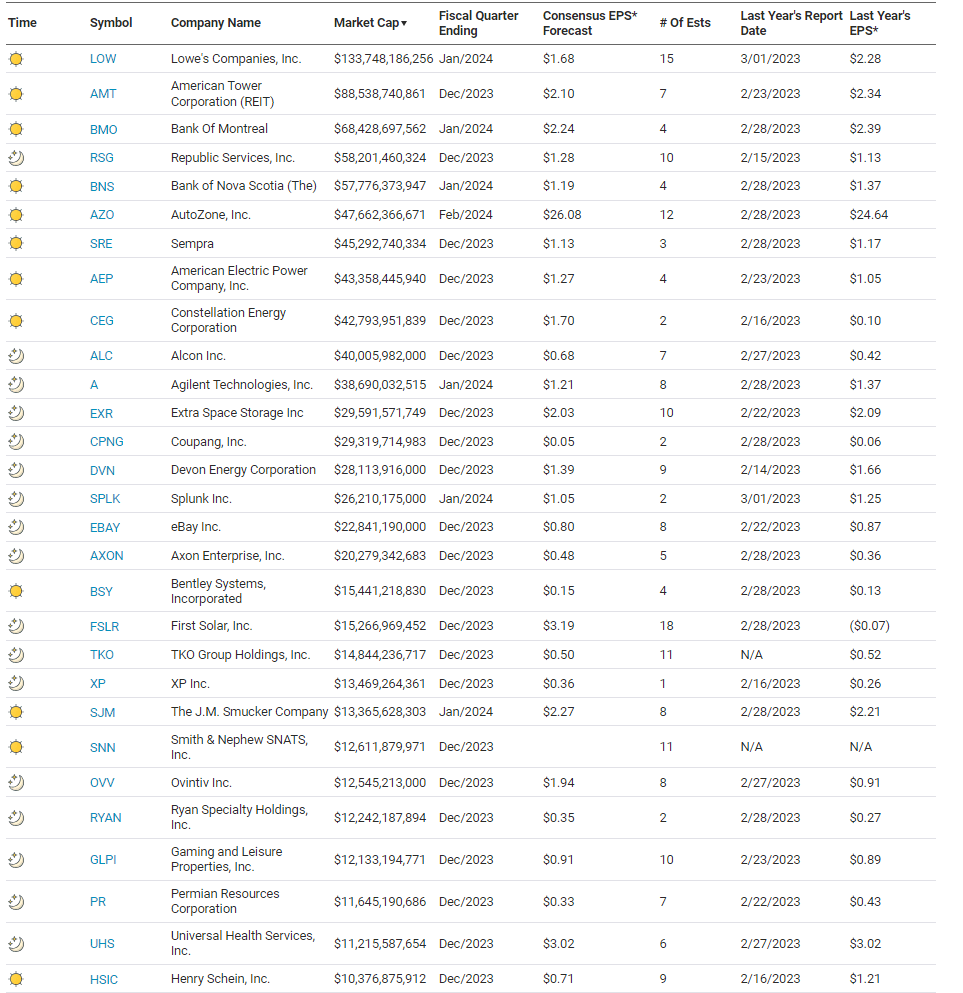
Earnings
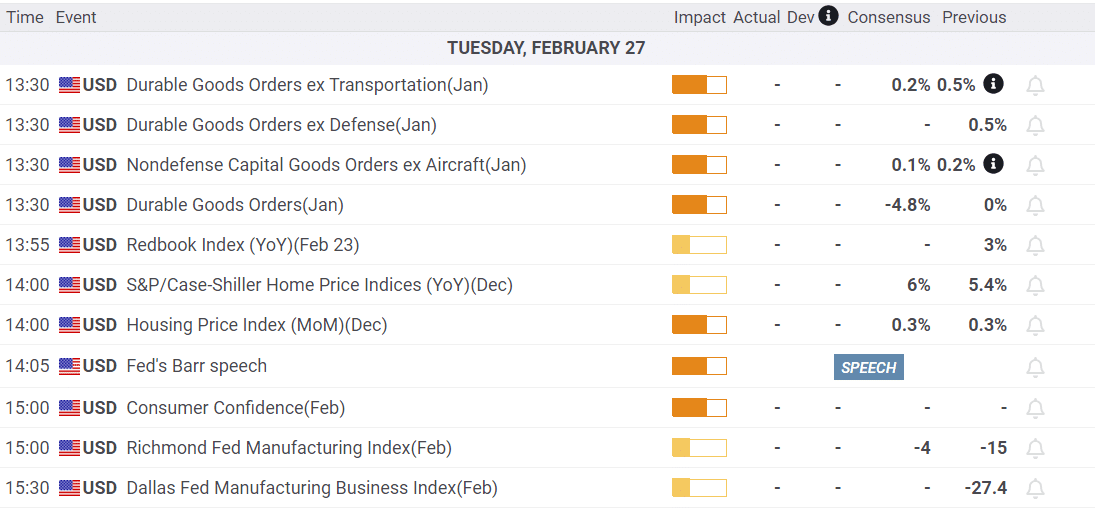
Economy
Market Trading Update
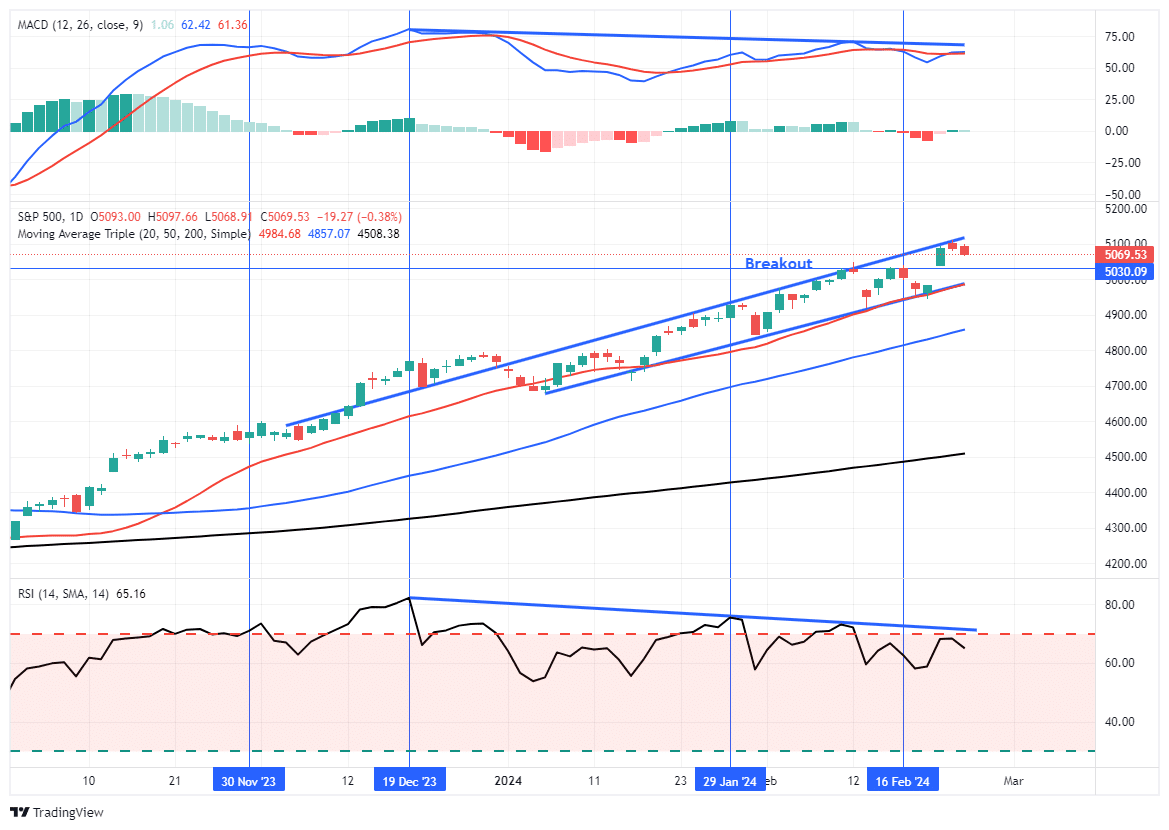
The market remains confined to a very defined trading range. With support at the 20-DMA and a clear channel that began in November. The market failed at the top of that range yesterday, and with a slew of economic data out this week, a retest of the 20-DMA is possible. The negative divergence of the MACD and RSI indicators suggests risk to the current market trend. The good news is that we are seeing some rotation in the market from the previous leaders to other sectors of the market on a relative basis. That rotation could sustain this rally a while longer. However, the rally that began in November is getting very long in terms of duration. As noted yesterday, we suspect the next big move for the market will be lower, therefore, continue to manage risk according

Warren Buffett Is Accumulating Cash
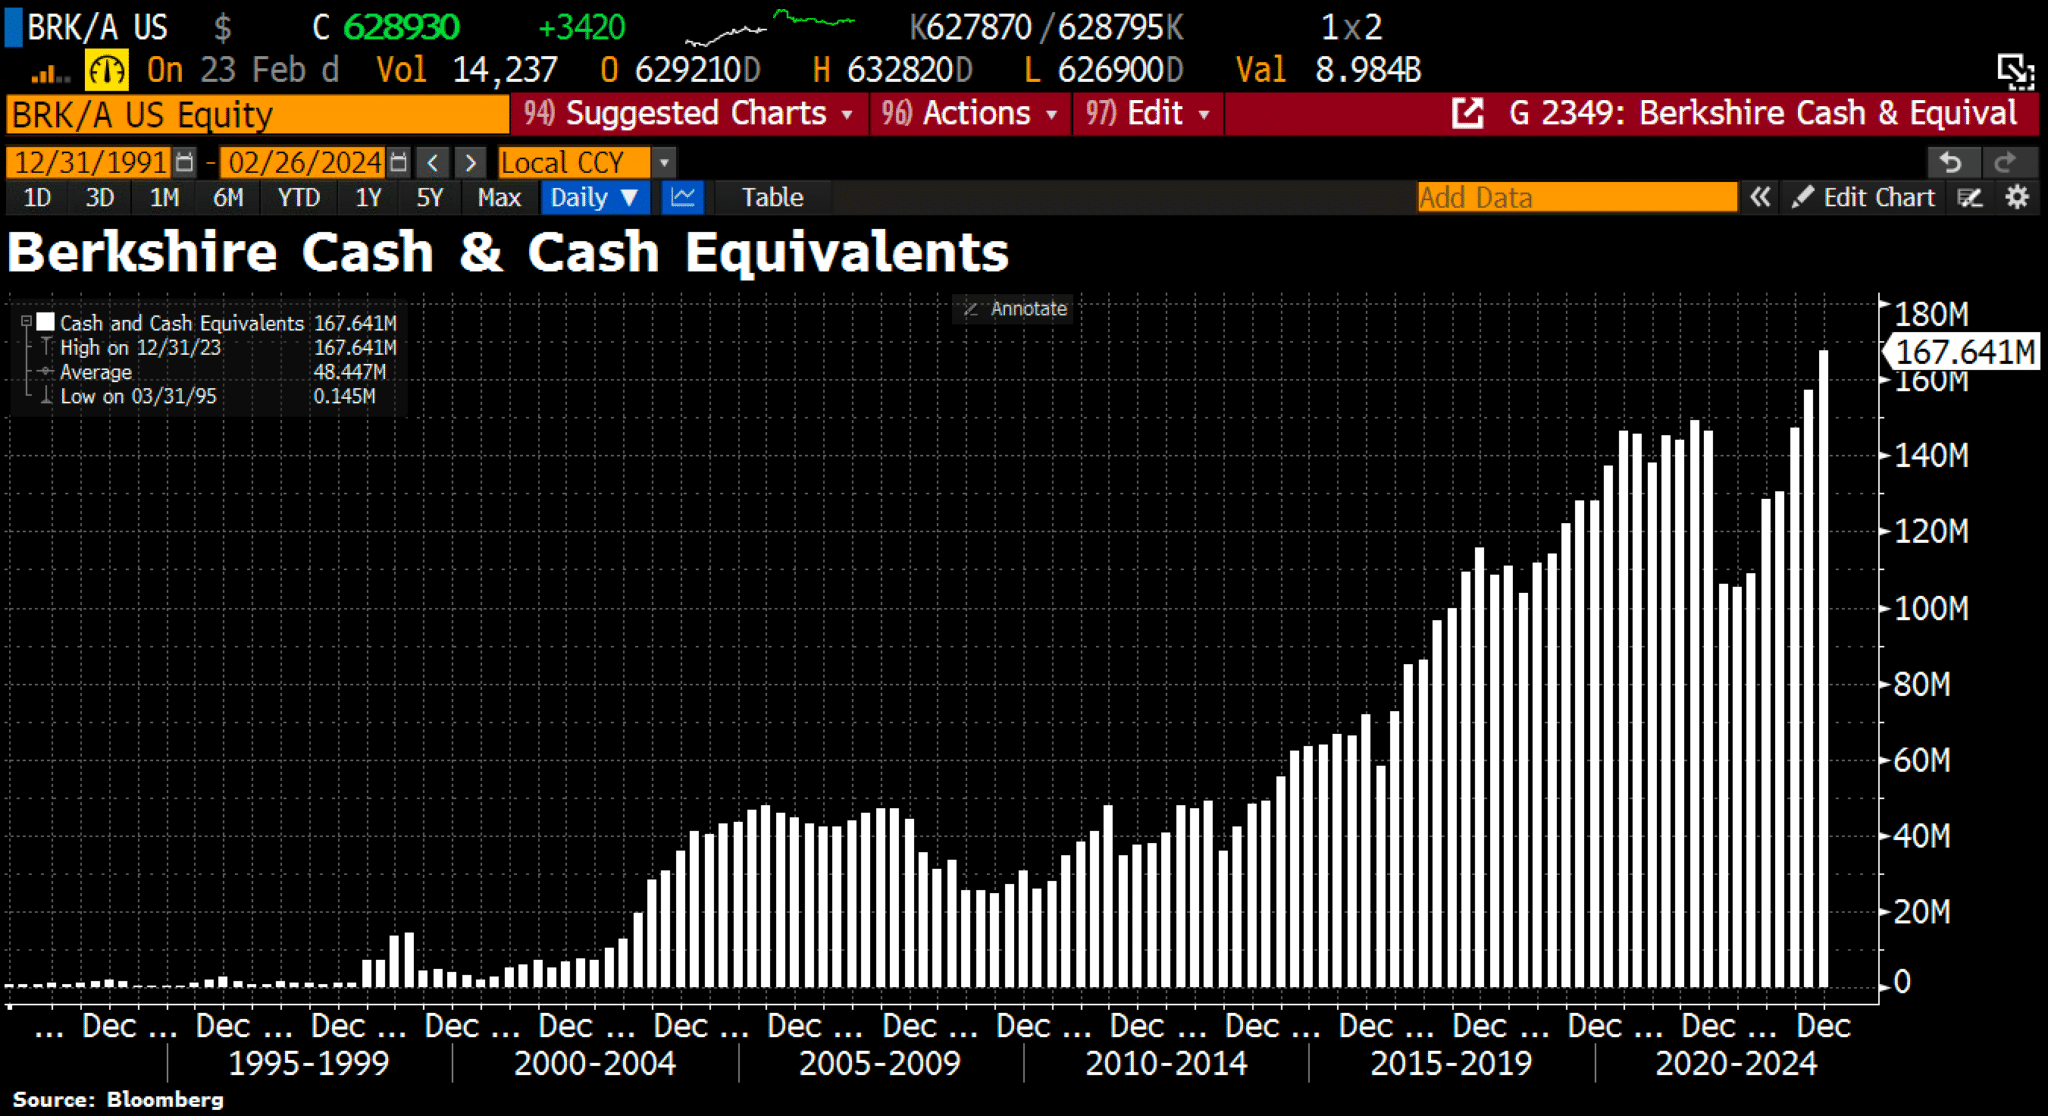
This past weekend at the Berkshire Hathaway annual meeting, Warren Buffett offered concern about high valuations in the equity markets. Consequently, as the Bloomberg graph below shows, Berkshire’s cash balance is at a new record high of $167 billion. As Warren Buffet shares in the quote below, he cannot find stocks that are both attractive and large enough for their portfolio.
“There remain only a handful of companies in this country capable of truly moving the needle at Berkshire, and they have been endlessly picked over by us and by others. Outside the US, there are essentially no candidates that are meaningful options for capital deployment at Berkshire. All in all, we have no possibility of eye-popping performance,”– Warren Buffett.
Jim Coquitt’s Bullish And Bearish Bond Takes
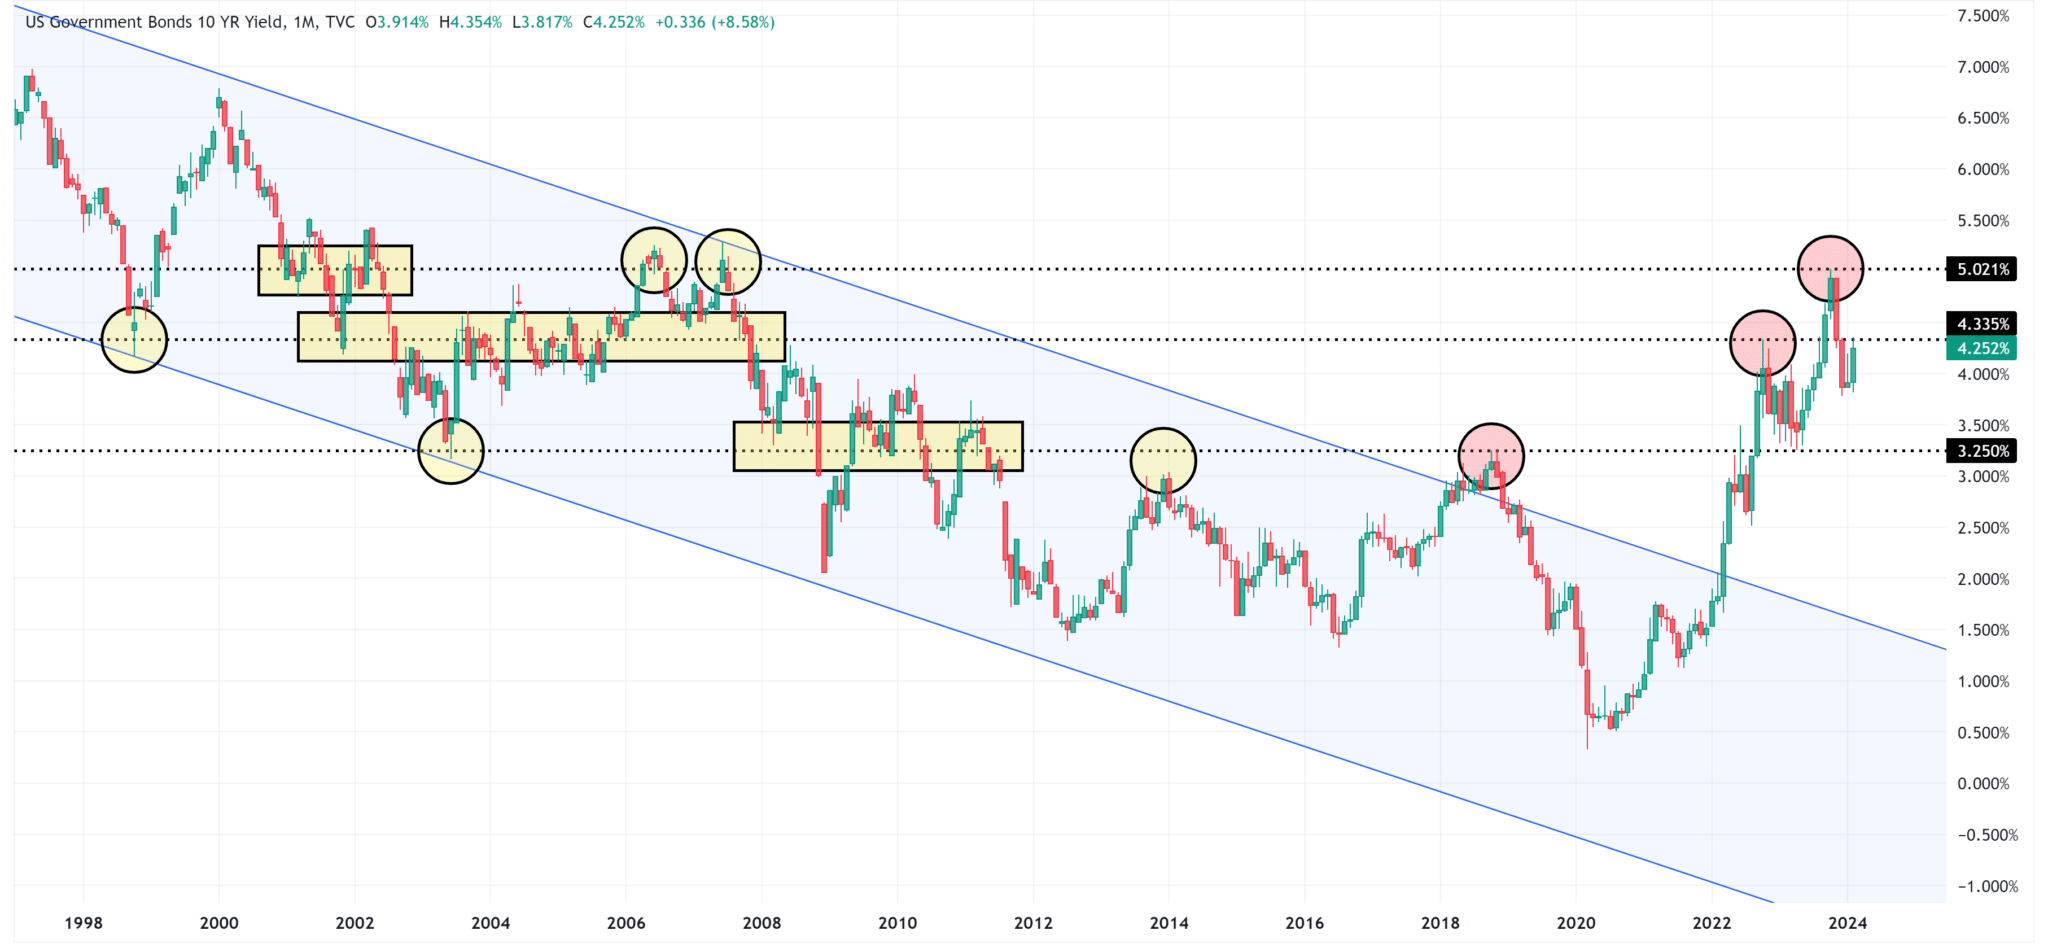
Jim Colquitt of Skillman Grove Research recently published a technical outlook for Treasury bond yields to his Substack subscribers. He leads with the following long-term graph, highlighting critical technical levels. As he shows, the recent high yield of 5% matches two prior highs in 2006 and 2007, as well as a period of consolidation in 2001 and 2002.
His bullish takeaway is as follows:
The Bull Case (i.e., UST 10-year yields decline) would suggest that the 5.021% we saw in October 2023 is probably the current cycle top. If so, we could be in the process of forming a Head & Shoulders topping pattern.
If we are forming a Head & Shoulders pattern, it is possible that we could see the UST 10-year trade down to the neckline (3.25%), then move higher to form the right shoulder before breaking down and through the neckline towards the target of 1.479%.
I find it fascinating how perfectly the target value matches up with other historical turning/pivot points (see green circles) thus giving further validity to the target we have computed.
The “bullish” case (i.e., one where we reach the target of 1.479%) for the UST 10-year, likely happens as a result of a recessionary environment for the US economy and US equities.
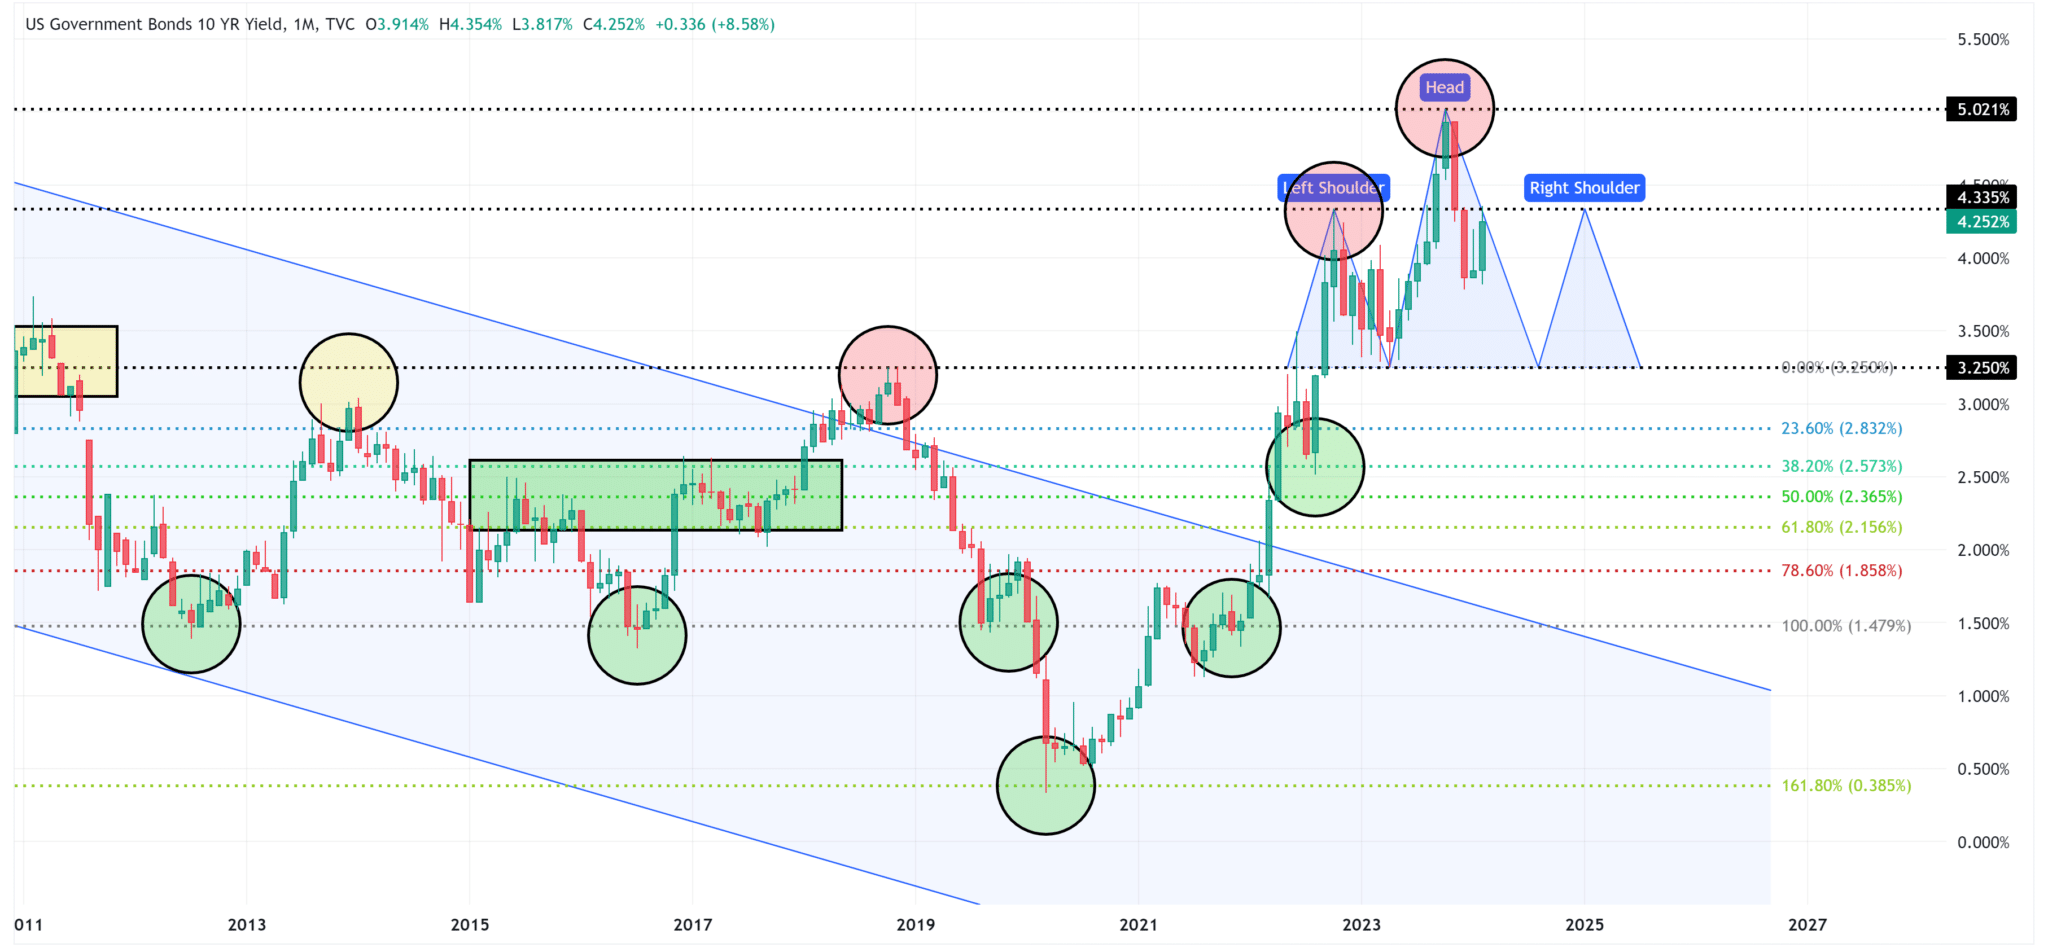
Jim warns, however, that if the left shoulder is broken, “I would suggest that if we clear the high side of the left shoulder (4.335%) and sustain it, you probably want to have your antenna up for a further move higher in yields.” A break above the head argues for higher yields, in his opinion. Per Jim-
“If we break above 5.021%, the following levels are possibilities: 5.522%, 6.06%, 6.79%, and 8.033%.”
Jim favors the bullish case, but his technical road map is worth appreciating as no one can be assured of what the future holds. You can follow Jim’s work at Skilman Grove Research on Substack.
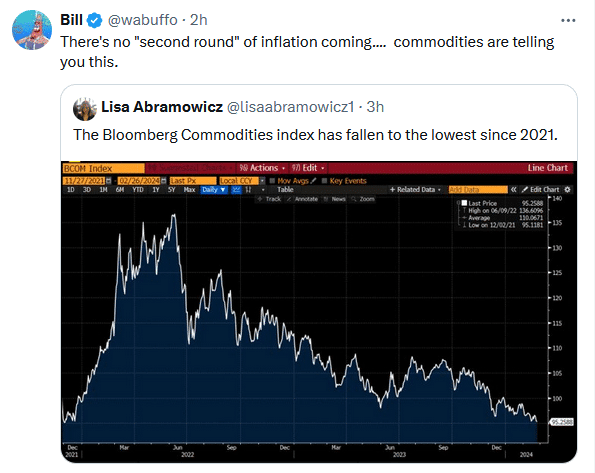
Tweet of the Day
“Want to have better long-term success in managing your portfolio? Here are our 15-trading rules for managing market risks.”
Please subscribe to the daily commentary to receive these updates every morning before the opening bell.
If you found this blog useful, please send it to someone else, share it on social media, or contact us to set up a meeting.
Post Views: 0
2024/02/27