


Simple math suggests that tomorrow’s CPI report for May will likely continue to show high inflation. To compute CPI, the BLS measures gasoline prices during the first three weeks of the reference month. Thus, May CPI will capture gasoline prices from roughly May 1–21, when national averages were still running at recent peaks. The graph below shows that the highest prices for gasoline futures occurred during the first three weeks of May. The recent easing of gasoline prices will not show up until the June report at the earliest.
It’s worth explaining the math behind CPI and monthly price changes. Gasoline accounts for roughly 3.5% of the CPI basket. Thus, a 10% increase in gasoline prices adds approximately 0.35% to the total CPI. When prices surge by over 40%, as they have recently, gas prices have a significant impact. But, importantly, CPI math works equally powerfully in reverse.
Bond investors, who drove yields sharply higher on energy-related inflation fears, appear to be sensing that the worst may be behind us. Long yields have begun to stabilize even as CPI and CPI forecasts remain elevated. This is a signal that fixed-income investors are starting to look through the current data toward how the math might impact CPI in the opposite direction in the coming months.
Bear in mind, it’s not just falling energy prices that will reduce CPI. Flat oil prices over a month will produce a zero percent monthly contribution from energy to CPI. If oil prices ease modestly from current levels, as they have recently, the energy component becomes a disinflationary force in this summer’s CPI reports. To wit, consider that gasoline futures prices imply a decline by about 20%, from $3.15 to $2.50, by year’s end. Per the math, that would reduce CPI by 0.70%.

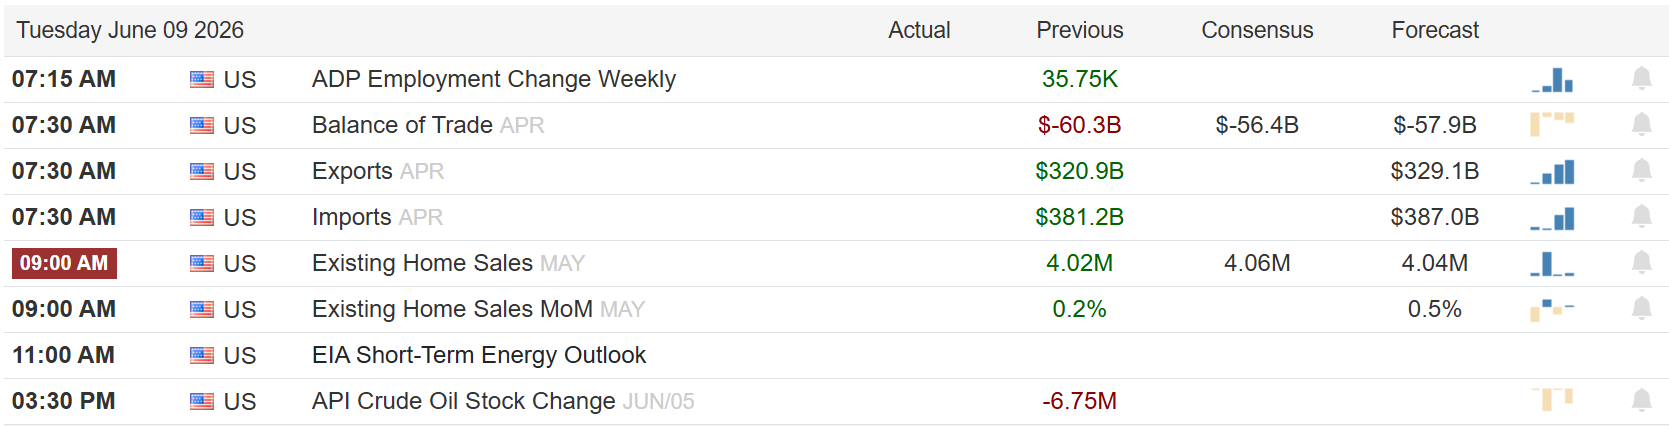
What To Watch Today
Earnings

Economy
Market Trading Update
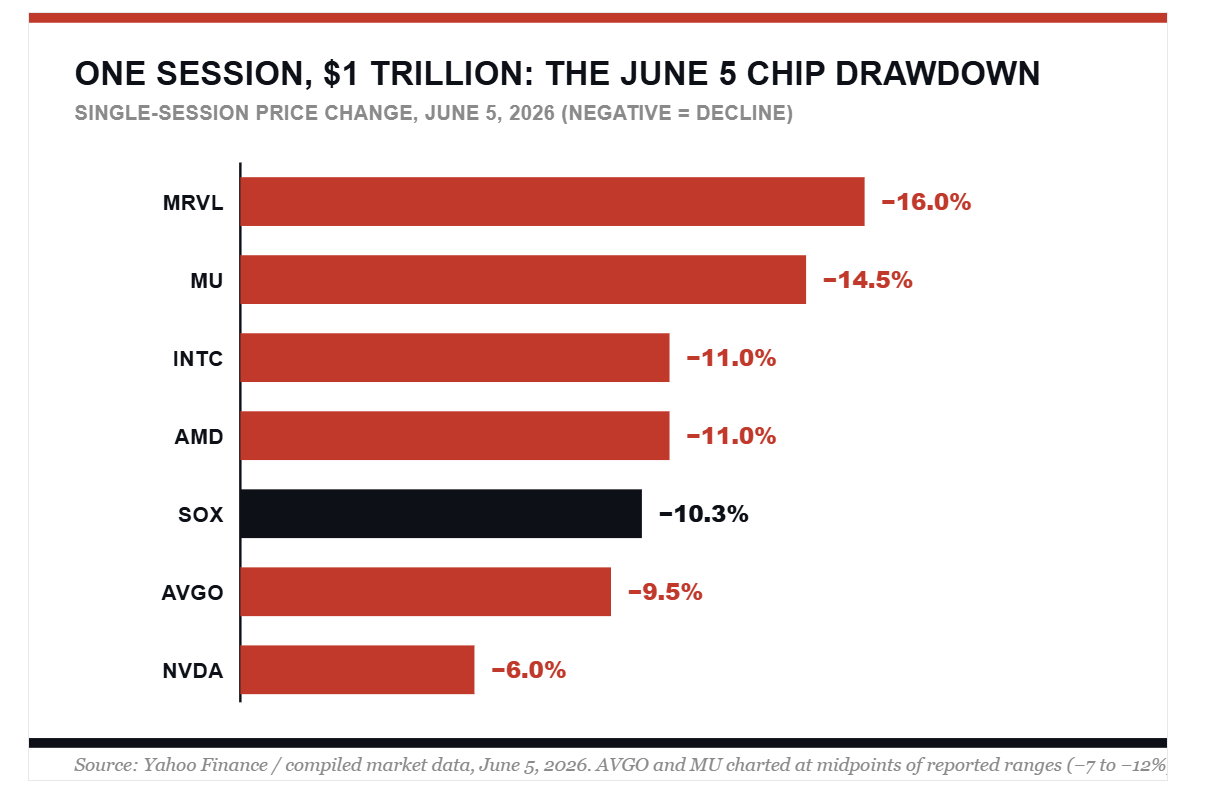
Yesterday, we discussed the technical backdrop following Friday’s selloff, which was the first since the April 2025 tariff shock. The chip complex shed better than 10% in a single session and dragged about a trillion dollars of market value out the door with it. By Monday’s opening, the buyers were back, scooping up nearly everything that got hit. So which is it? Was Friday’s semiconductor selloff the first real crack in a two-month melt-up, or just another dip the bulls were always going to buy? The honest answer sits between those two stories. And the tape is quietly telling you which way to lean.
Friday’s trigger wasn’t a miss. It was the absence of a beat-and-raise. Broadcom reported on June 3 and actually topped estimates on both revenue and earnings. But its Q3 guide for AI chip sales came in at $16 billion against a $17.2 billion consensus, and the company pointedly declined to lift its full-year AI forecast. That matters more than it sounds. This entire trade was built on a drumbeat of upward revisions. When the marginal upgrade stops, a multiple that discounted perpetual acceleration has nothing left to lean on.
Then the macro lit the fuse. May payrolls printed 172,000 against an 80,000 consensus, and the bond market repriced in a hurry. Two-year yields jumped as much as 13 basis points to 4.17%, the biggest one-day move since the April 2025 tariff rout, and the ten-year pushed to 4.55%. Traders now fully price a Fed hike by year-end, with roughly 60% odds pinned on October. Most of Wall Street has scrapped its 2026 rate-cut calls entirely. Read that twice. The Fed put just got repriced in the wrong direction.
I want you to look past the index and into the internals, because that’s where Friday and Monday actually diverge. Here’s the neighborhood-by-neighborhood read.
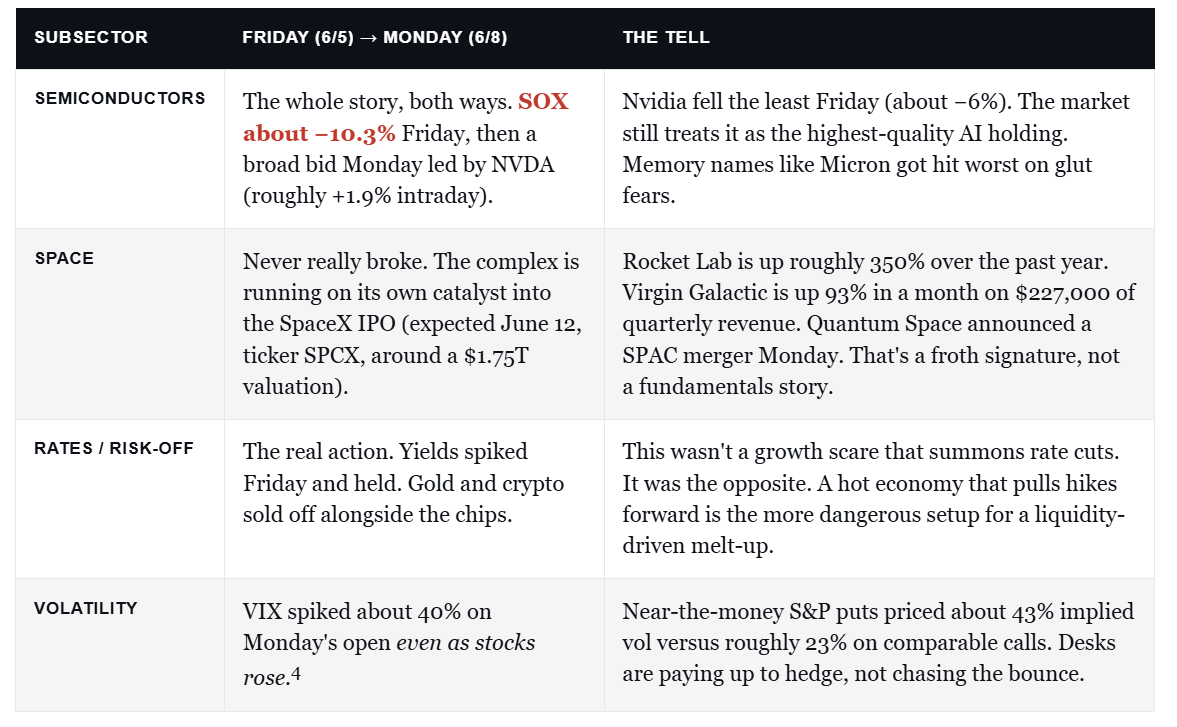
Space is the cleanest tell in that table. When pre-commercial names with rounding-error revenue go vertical into a marquee IPO, you’re watching positioning, not analysis. Notice in the chart below how concentrated Friday actually was. This was a sector-wide repricing, not a single-company blowup, and the spread between the best and worst names tells you what the market was actually selling.
Now here’s the part most of Monday’s green-screen coverage skipped. The bounce showed up in price, but the options market wasn’t buying it. While the S&P rose, the VIX still spiked about 40%, and the skew told the real story: traders were paying nearly double the implied volatility for downside protection that they were paying for upside.

I’m not in the business of selling fear, so let me steel-man the other side, because it’s stronger than the permabears admit. The demand story for AI compute did not break on Friday. Broadcom reiterated. It didn’t cut. Nvidia fell the least of any major chip name, which tells you the market sold the periphery and protected the core. Monday’s de-escalation out of the Middle East lifted a real overhang. And we’re sitting roughly 3% off an all-time high. A 2.6% index pullback that gets fully bought inside one session is textbook bull-market behavior, not a top.
Here’s the problem with that argument, though. The catalyst was fundamental, not technical, and the regime financing the whole move just turned. A dip-buy reflex that worked all year worked because liquidity was abundant and the next Fed move was assumed to be a cut. Strip that assumption out and the same reflex is now operating into a tightening bias. Stanley Druckenmiller has spent a career making one point louder than the rest: it’s the liquidity that moves markets, not the earnings. The liquidity just got more expensive.
So what do you actually do? You respect the bounce without chasing it. That means treating Monday’s strength as a window to manage risk rather than a green light to add beta. Trim the names that ran the furthest on the thinnest fundamentals. Upgrade quality inside your equity sleeve. Hold the hedges you have. Howard Marks framed the cycle question better than anyone: the riskiest thing in the market is the widespread belief that there’s no risk. Buying every dip with no margin of safety is precisely that belief, expressed as a trade.

Sell Off Or Rotation?
We received a few emails over the weekend asking what caused the sharp decline in the markets on Friday. The easy answer is that some of the technology stocks that were soaring had a correction. That is partially correct. The top two screenshots from SimpleVisorAI (coming soon) also tell the story of a massive rotation that occurred on Friday. The market style grid shows that large-cap growth stocks were down nearly 3x as much as large-cap value stocks on Friday. Similar discrepancies occurred across mid and small-cap stocks. Below it, notice that five sectors were higher on the day, despite the S&P 500 closing lower by 2.5% and the Nasdaq by more than 5%.
The second graphic, the heat map, paints a similar picture. Note how many stocks were green or yellow, denoting they were up or flat for the day. The heat map and style grid have shown significant dispersion over the last few weeks. Friday’s activity was similar, but with the laggards winning and the outperformers lagging.
The third graphic shows that the relative and absolute scores for utilities and technology trended in opposite directions over the last two weeks. The technology sector, which had absolute and relative scores in the 80s and low 90s, corrected sharply, almost solely due to Friday’s decline. While the sector remains overbought, it is far more stable than it was late last week. The question we need to ponder is whether the rotational correction was a restbit in the outperformance of technology versus most other sectors or a turning point.


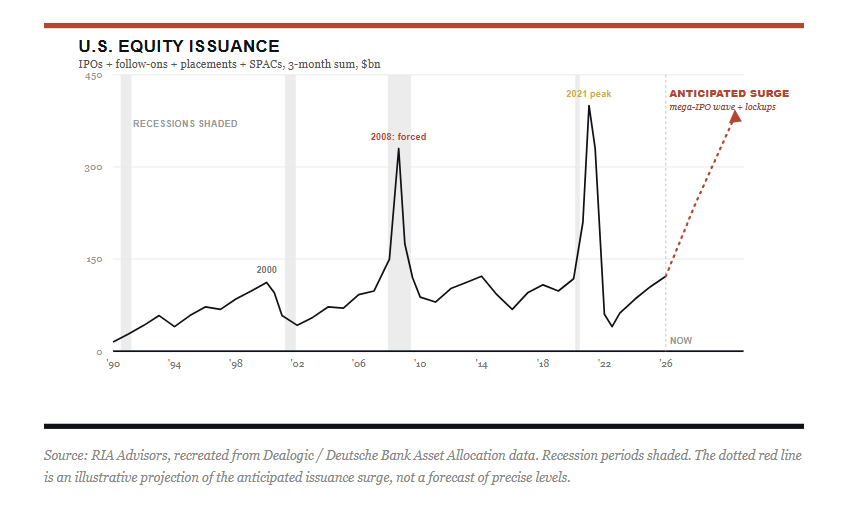
Equity Supply Surge: What Historically Comes Next
This past week, the market hit an all-time high. At the same time, Alphabet (GOOG) told investors it would raise $80 billion by selling stock to fund its AI buildout, and the shares fell about 4% on the news. Within days, SpaceX is reportedly set to price one of the largest IPOs ever attempted. If you want a live picture of an equity supply surge meeting a market priced for perfection, you’re looking at it. The question isn’t whether the equity supply is coming. It’s what happens after it lands.

Tweet of the Day

New UPDATED Trading Rules With Desktop Printout
“Want to achieve better long-term success in managing your portfolio? Here are our 15-trading rules for managing market risks.”
Please subscribe to the daily commentary to receive these updates every morning before the opening bell.
If you found this blog useful, please send it to someone else, share it on social media, or contact us to set up a meeting.