


Months ago, the financial headlines were littered with stern warnings that the dollar was depreciating rapidly. There was a popular narrative drawing fear that a dollar demise was imminent. A few short months later, the dollar narrative has flipped. According to today’s headlines and narratives, the tide has turned for the dollar. To wit: we saw a popular financial pundit claiming that the strengthening dollar was “steamrolling” the world. With this new bullish dollar narrative, let’s explore how a strengthening dollar affects the US economy and foreign economies.
For the US, a stronger dollar is a mixed blessing. On the positive side, it suppresses inflation by lowering the price of imported goods, which is particularly relevant today, given the Fed’s battle to return CPI to 2%. For travelers, a strong dollar stretches further abroad. However, a stronger dollar makes US exports more expensive in foreign markets, squeezing the revenues of multinationals. When those foreign earnings are converted back into dollars, they are worth less and can be a headwind for S&P 500 earnings. Roughly 40% of S&P 500 revenues come from outside the United States.
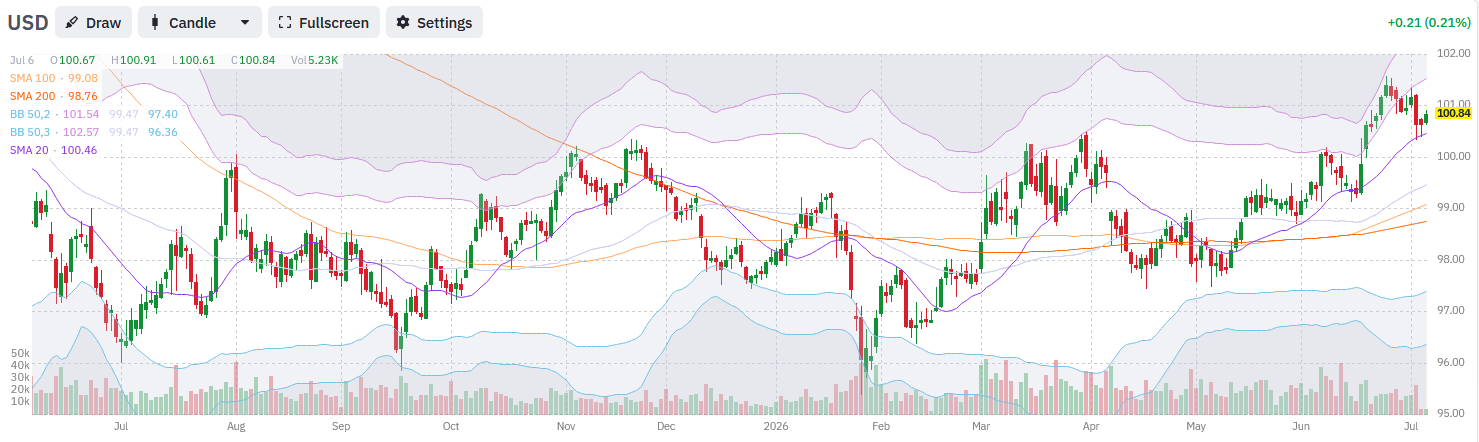
For the rest of the world, the impact is more painful. Developed and emerging market economies that carry trillions of dollars of dollar-denominated debt face a financial squeeze as their local currencies buy fewer dollars, making debt service more expensive in local currency terms. The dollar appreciation is akin to rising interest rates for these countries. Commodity-importing nations face higher costs for oil and raw materials as they are largely priced in dollars. Moreover, capital tends to flow toward dollar-denominated assets, draining liquidity from foreign markets precisely when they need it. The graph below, courtesy of FinViz, shows the approximate 5% appreciation in the dollar index since February.
What To Watch Today
Earnings
- No notable earnings releases today
Economy

Market Trading Update
Yesterday, we covered Kevin Warsh using his first turn at the ECB’s Sintra forum to bury forward guidance, Forward Guidance: R.I.P, leaving markets to price policy on their own. Today, watch a quieter tell that says money is already repositioning: the Mag 7 rotation back into the megacaps, right as earnings season arrives.
Here’s where it gets interesting. The ratio of the Roundhill Magnificent Seven ETF (MAGS) to the iShares Momentum ETF (MTUM) bottomed near 0.180 on June 24 and rose to roughly 0.203 by Monday midday, a 13% bounce from the low. That matters because MTUM’s basket had rotated toward this spring’s broad leaders, the chips, industrials, and financials. So when MAGS starts to outrun MTUM, it isn’t the momentum trade working. It’s capital moving back into the seven names the crowd had left for dead by quarter-end.
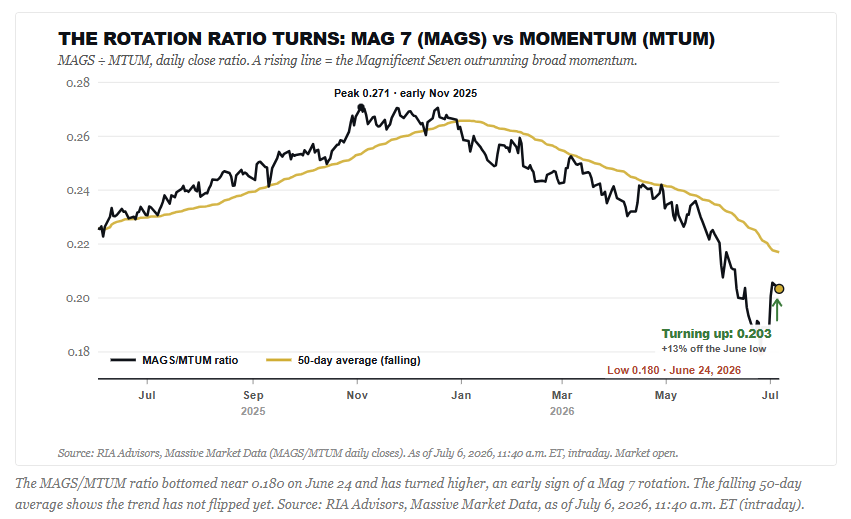
We didn’t wait for the all-clear. In the Rotation Factor model, we’d already switched from value to growth through the MGK basket and added the Mag 7 into the late-June selloff, when Meta, Micron, and Tesla were getting flushed, and mega-cap growth had fallen to the most oversold relative reading in the large-cap complex. The damage was mechanical, not fundamental. Buyback blackouts and quarter-end pension selling drove it, and both reversed in July.
With the quarter-end rebalancing behind us, we did see rotation back into the momentum trade yesterday, so the path ahead is still somewhat murky. However, the fundamentals are lining up in favor of the trade. Analysts keep raising estimates, not lowering them. Forward S&P 500 earnings just set a fresh record, running better than 30% above year-ago levels, and the quarterly consensus for the back half of 2026 has climbed almost every week.

Sentiment rounds out the setup. AAII bulls sit at just 31.4%, below the 37.5% historical average for the sixth time in seven weeks, and our own Fear/Greed gauge has cooled from its June highs. Rising estimates, washed-out positioning, and megacap multiples back near the low end of their two-year range, while the broad index still trades in the mid-20s on forward earnings. That’s the asymmetry behind Bob Farrell’s Rule #9: “when everyone agrees the Mag 7 is finished, something else usually happens.”
So how do you approach the Mag 7 into late July? Treat this as a TACTICAL add, not a verdict. Buy the washed-out leaders, not the names already extended, and keep the exit defined at the earnings dates themselves. If capex and free cash flow worries are confirmed when these companies report at month-end, we sell and move on. If estimates hold, the oversold snapback has room to run. Size it like a trade, manage risk at the line, and keep capital preservation first.

Momentum Fades & Laggards Lead
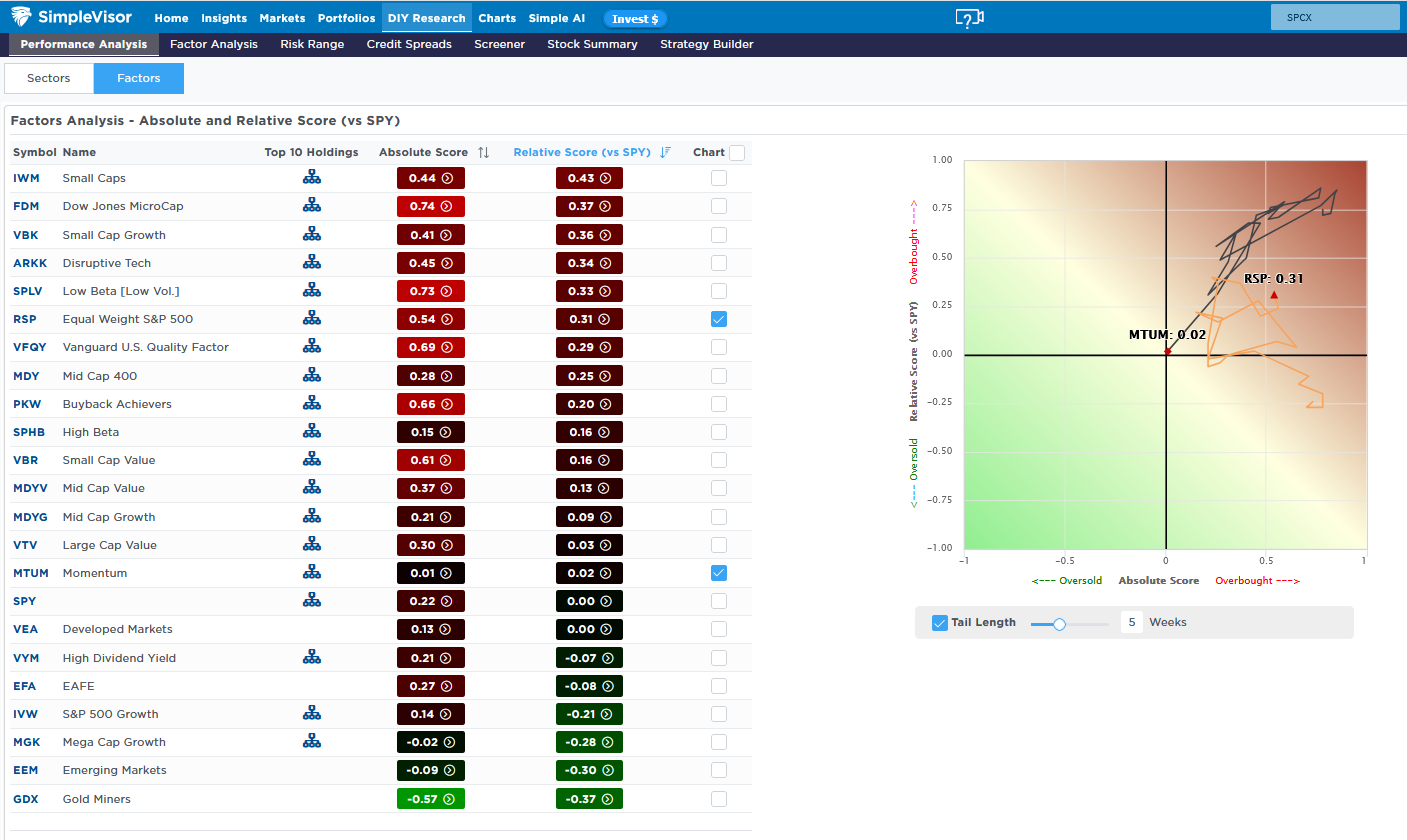
What a difference a few weeks can make. Today, we share the equity factor relative and absolute analyses below to show how the market sectors and factor drivers rotate, even when it seems, as it did, that certain factors and sectors will continue to beat the market. Momentum stocks, including many of the chip makers and hardware stocks, were leading the market. As the graph on the right shows, the momentum ETF was grossly overbought for the better part of the last five weeks. However, about a week ago, it started underperforming and is now trading at fair value. At the same time, the equal-weighted S&P 500 has moved higher, indicating a strengthening of its relative score. But notice the upward trend was slightly to the left. This indicates that its absolute score was weakening as its relative score improved.
It’s also worth noting that the three most overbought stock factors are in the small-cap sector, with the microcap sector having the highest absolute score. The microcap sector was often the most oversold factor for the last few months.
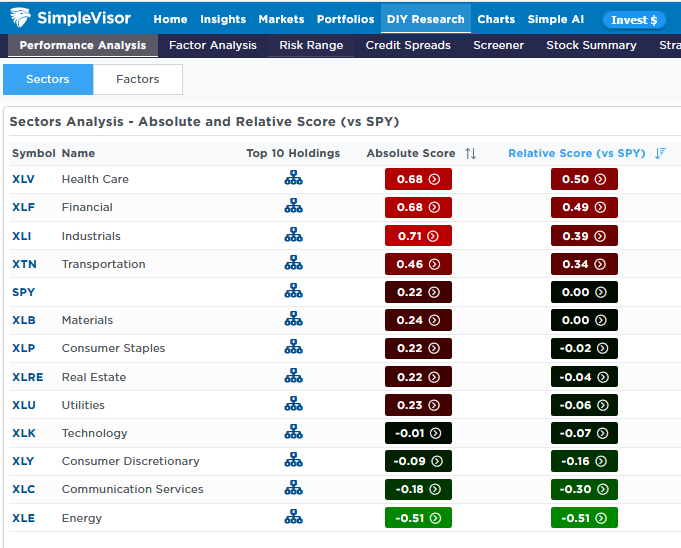
The second graphic shows how the once-lagging healthcare and financial sectors have risen to the most overbought levels, while technology, like momentum, sits almost perfectly at fair value. Will the trends reverse to favor momentum and technology now that the quarter-end is over, or are the more recent trends durable? We should be able to better answer that question toward the end of the week.
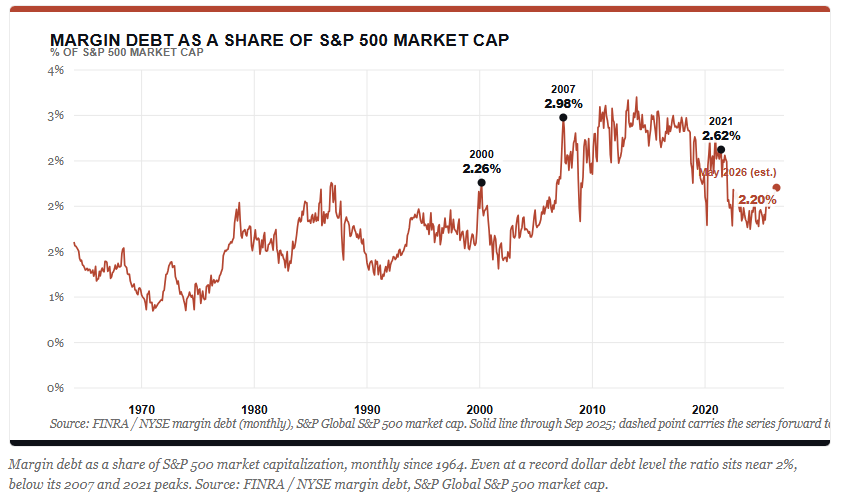
Margin Debt Risk: The Ratios That Mislead Investors
Margin debt just set another record. In May 2026, investors owed their brokers a combined $1.42 trillion, the highest in history and a 53.7% jump from the prior year.1 Every time this number prints a new high, the same charts circulate: margin debt against GDP, against M2, against the total value of the market. They look authoritative. The trouble is that most of them can’t measure margin debt risk in any way that helps you manage a portfolio, and the most popular one is the least useful of the bunch.
I want to take these apart in order.
- Why do the three favorite ratios misstate margin debt risk?
- Then the handful of measures that actually tell you something.
- Finally, I will build a cleaner gauge out of the defensible pieces, and close with the part that matters most: what to watch, and why leverage is a problem you can ignore right up until the week you can’t.

Tweet of the Day

New UPDATED Trading Rules With Desktop Printout
“Want to achieve better long-term success in managing your portfolio? Here are our 15-trading rules for managing market risks.”
Please subscribe to the daily commentary to receive these updates every morning before the opening bell.
If you found this blog useful, please send it to someone else, share it on social media, or contact us to set up a meeting.