


🔎 At a Glance
🏛️ Market Brief – Market Consolidates Recent Gains
Last week, we noted that after the sharpest rally since May 2025, a correction was likely. Notably, those corrections come in two forms: a price pullback or a sideways consolidation. We got the latter. The S&P 500 churned between roughly 7,080 and 7,140 for most of the week. But Friday, did make a push to all-time highs. That kind of tight, high-level consolidation following an explosive move is technically constructive. Historically, it suggests the market is digesting gains rather than distributing them.
The week’s dominant drama was, again, Iran, but with a different texture than in prior weeks. The original two-week ceasefire was set to expire Tuesday, and markets sold off Monday as the U.S. Navy seized an Iranian container ship in the Gulf of Oman and Iran’s Revolutionary Guard fired on a tanker inside the Strait. Oil surged back above $97, and the S&P fell 0.63%. Then, on Tuesday evening, Trump extended the ceasefire indefinitely. He cited Iran’s government as “seriously fractured” and awaiting a unified Iranian proposal. Markets bounced on Wednesday, oil retreated back toward $88-$92, and the VIX slid below 19. On Thursday, the markets pulled back again, but on Friday, they rallied. It’s enough volatility to make trading difficult.
The other institutional event of the week was Kevin Warsh’s confirmation hearing before the Senate Banking Committee for Fed Chair. Warsh told senators he would be “strictly independent” and would not allow Trump to influence rate decisions, a reassuring signal. Mohamed El-Erian assessed his testimony as “very well balanced.” He suggested that Warsh would err on the side of cutting rates earlier if the dual mandate warranted it. Markets took comfort. The 10-year Treasury yield held near 4.30%, and rate hike odds have retreated meaningfully.
Earnings are doing the heavier lifting. With 86 S&P 500 companies reporting, Q1 earnings are running 26.1% above year-ago levels, with revenue growth of 10.3%. That is a substantial beat rate that is rewriting the macro narrative. GE Vernova surged 13.75% after a stunning quarter that included a $13 billion sequential backlog increase. It also pulled forward its $200 billion backlog target to 2027 from 2028, and raised full-year guidance across every key metric. Boeing climbed more than 5% on a smaller-than-expected quarterly loss and improving delivery data. Citigroup reported net income up 42% and Markets revenue above $7 billion. Tesla beat on margins and cash flow, with the stock absorbing the results constructively.
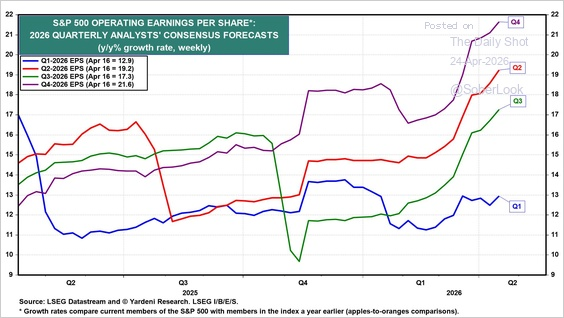
Most importantly, the earnings revision cycle is turning favorable precisely when it is most needed. S&P 500 EPS estimates for 2026 have risen 4% since late January, according to Goldman Sachs. Furthermore, the sectors enjoying the most upward revision pressure include Energy, Technology, Basic Materials, and Utilities. That positive revision momentum is providing a fundamental counterweight to geopolitical risk. Notably, it is one of the most underappreciated dynamics keeping institutional buyers engaged above 7,000.
Heading into next week, the market needs one of two things to break out of consolidation: either a substantive development in U.S.-Iran negotiations that credibly reopens the Strait of Hormuz, or continued earnings beats that push full-year EPS estimates high enough to justify current valuations. The forward P/E has retraced to roughly 20.4x, above the 10-year average of 18.9x but well below the 22x peak from December. That’s not cheap, but it’s defensible if earnings continue growing at double-digit rates. Patience remains a position, but the bull case is more durable today than it appeared six weeks ago.
📈Technical Backdrop – Pullback Likely
The S&P 500 closed Friday at a fresh all-time high of 7,155, up 0.67% on the session and extending the index’s remarkable run off the March lows. The week, however, was anything but smooth. Thursday’s session delivered a gut-check: reports of air defense systems activating over Tehran sent WTI past $106, and the S&P dropped 0.41% as the oil-volatility transmission mechanism briefly reasserted itself. Friday’s recovery came on Intel’s blowout earnings (+21%), Trump’s three-week extension of the Israel-Lebanon ceasefire, and crude pulling back to $94. The VIX settled at 18.92, below our 20 thresholds, but Thursday’s spike was a reminder of how quickly that can change.
The technical picture remains unambiguously bullish across all time frames. Investing.com shows 12 of 12 moving average signals at “Strong Buy.” The 14-day RSI is near 70, indicating an overbought condition. The MACD, a measure of momentum, is on a “buy signal” and rising. The index is trading above the 50-DMA (~6,790) and above the 200-DMA (~6,705), both of which are rising. Breadth has held with roughly 52% of constituents above their 50-DMA, but needs to strengthen if the rally is going to continue.
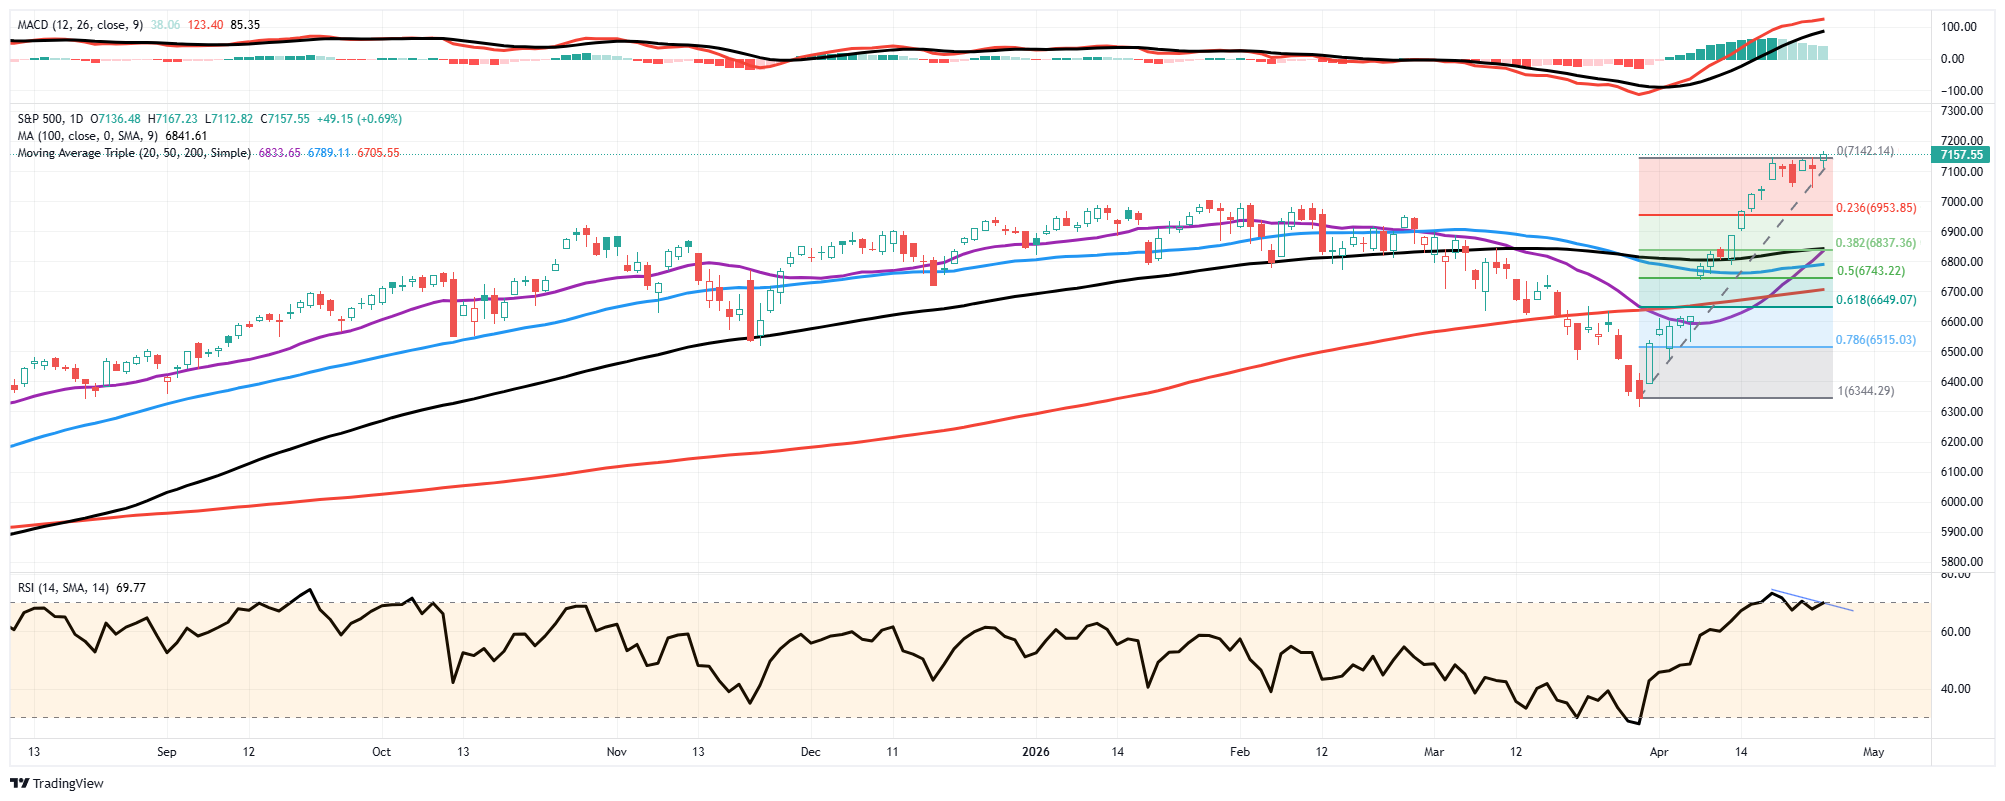
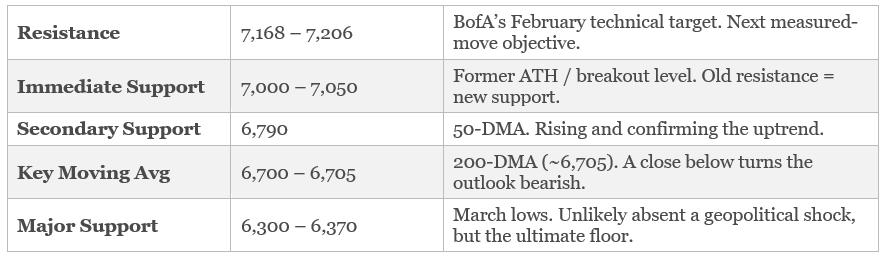
The tension in this tape lies between technical strength and fundamental fragility. As noted below, the Michigan consumer sentiment printed its lowest reading on record. Furthermore, the Iran peace talks have stalled, with Thursday’s Tehran episode a stark reminder that the geopolitical risk premium hasn’t fully unwound. Oil’s $94 price represents the kind of volatility that whipsaws systematic strategies and undermines the VIX’s descent. The Fed remains on hold at 3.5–3.75% with markets pricing no cuts in 2026. At BofA’s target zone of 7,168–7,206, now just 0.4–1.0% overhead, the index is approaching a natural ceiling where profit-taking is likely.
For now, the market continues to climb a wall of worry, and the technicals say respect the trend. RSI is elevated but not grossly overbought, and while breadth is improving, all moving averages remain green. Our March 200-DMA analysis continues to play out textbook. But Thursday’s reversal on the Tehran headlines was a shot across the bow; this market remains one oil headline away from a 2–3% air pocket. The pullback we flagged last week hasn’t materialized so far, which is making the setup increasingly stretched. New money should wait for a retest of 7,000 or the 50-DMA (~6,979). Stay long but trail stops and take partial profits into BofA’s 7,168–7,206 target. Trade accordingly.
🔑 Key Catalysts Next Week
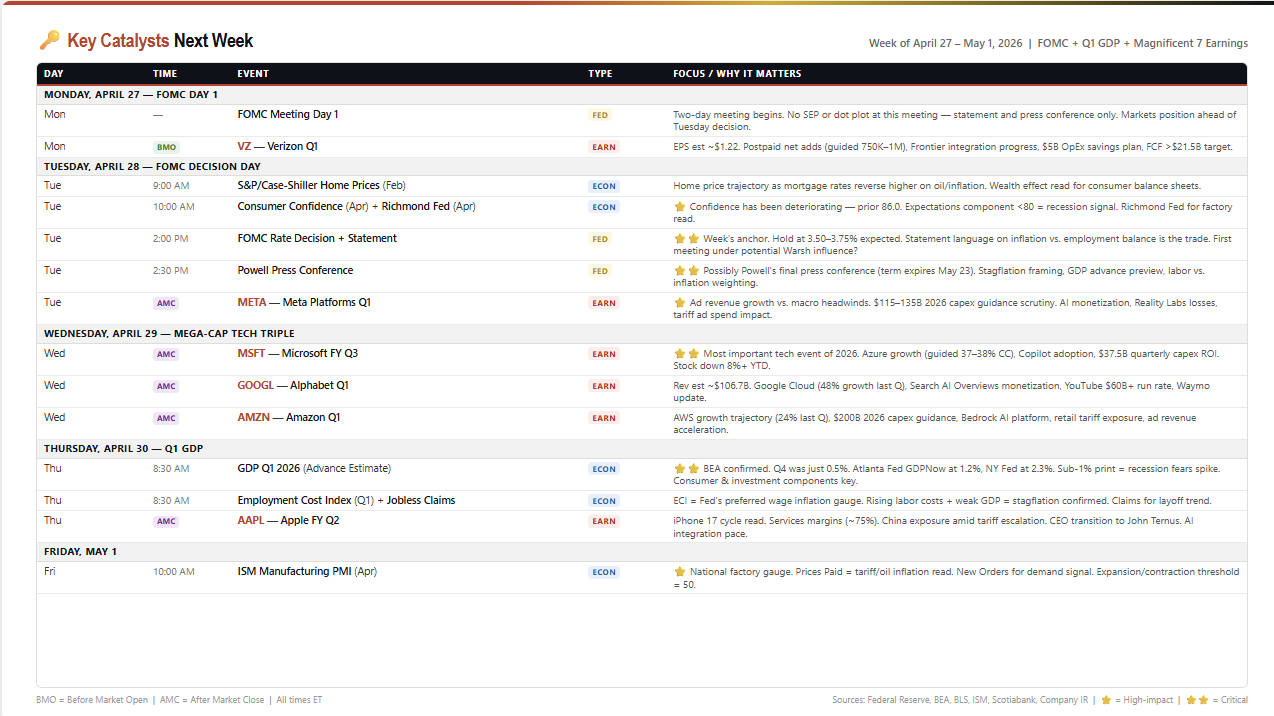
This is the most consequential week of the year. The FOMC decision, the Q1 GDP advance estimate, and earnings from five Magnificent 7 names: Meta, Microsoft, Alphabet, Amazon, and Apple. It all lands in a five-day window that will determine the market’s direction for the summer. Nothing else comes close.
The FOMC meeting Monday–Tuesday is the first catalyst. The rate decision itself is a foregone conclusion, a hold at 3.50–3.75%, but this is a statement-only meeting with no Summary of Economic Projections or dot plot, which makes the language and Powell’s press conference carry outsized weight. The key question is: Does the committee acknowledge that the labor market is deteriorating faster than expected, or does it lean into the inflation-first framing that dominated the March meeting? If Powell uses the word “patient” with respect to cuts, markets read that as “no action until at least September.” If he signals that the balance of risks has shifted toward employment, rate-cut expectations reprice immediately. This may be Powell’s final press conference as Chair before his term expires May 23, making every word a potential legacy statement, with Warsh waiting in the wings.
Tuesday is a collision day unlike anything we’ve seen this cycle. Consumer Confidence at 10:00 AM, which has been deteriorating sharply, with the Expectations component flirting with the sub-80 recession threshold. That number drops just four hours before the FOMC decision at 2:00 PM, followed by Powell’s presser at 2:30 PM. Then, post-market is Meta’s (META) Q1 earnings after the close. Meta’s report is the first read on whether digital advertising spend held up through the March oil shock and tariff escalation, and the $115–135 billion capex guidance for 2026 remains the single largest AI infrastructure commitment in the world.
However, Wednesday is the mega-cap technology “trifecta.” Microsoft (MSFT), Alphabet (GOOG), and Amazon (AMZN) all report after the close. Microsoft’s fiscal Q3 may be the most important tech earnings event of the year. Azure cloud growth guided at 37–38% in constant currency is the AI infrastructure monetization proof point, and Copilot adoption data will tell us whether enterprise AI spend is translating into revenue or stalling at the pilot stage. The stock is down over 8% year-to-date and trading at the cheapest forward multiple since 2017. Alphabet’s Google Cloud (which grew 48% last quarter) and Amazon’s AWS (24% growth, $200 billion in 2026 capex guidance) round out the cloud trilogy. If all three miss on cloud growth, the AI capex cycle narrative cracks; if not, the rally continues.
Thursday is Q1 GDP at 8:30 AM. Q4 was revised down to just 0.5% annualized. The Atlanta Fed’s GDPNow sits at 1.2%, while the New York Fed’s Nowcast is at 2.3%, a historically wide spread that reflects genuine uncertainty about whether the economy is decelerating or stalling. A sub-1% print would ignite recession fears and put immediate pressure on the Fed to cut rates, regardless of where inflation sits. Apple (AAPL) reports after the close on Thursday and caps the Mag-7 wave, with iPhone 17 cycle data, China tariff exposure, and the Tim Cook-to-John Ternus CEO transition all in play.
Here is what to watch. The Fed will tell us what it thinks, GDP will tell us what happened, and the Magnificent-7 will tell us whether the growth premium that justifies their collective $14 trillion market cap. Any two of these could move markets 3%+ in a session. All three in the same week is a vol event. Hedge accordingly.
Need Help With Your Investing Strategy?
Are you looking for comprehensive financial, insurance, and estate planning services? Need a risk-managed portfolio management strategy to grow and protect your savings? Whatever your needs are, we are here to help.

💰 The Dollar’s Funeral Nobody Attended
Open any finance corner of social media this week, and you will be hit with some version of the same obituary. ZeroHedge declared in December that the dollar’s death in 2026 is now a mainstream talking point, citing a WIRED piece arguing that this is the year “dollar dilution” truly accelerates. A widely circulated Dollar Collapse post this month warned that foreign demand for Treasuries is fading and that the greenback is losing its safe-haven status “in a generation.” WatcherGuru ran a headline last fall declaring rapid de-dollarization is happening right now, while YouTube personalities brandish century-long purchasing-power charts preaching gold and Bitcoin as salvation. The story writes itself: investors positioning capital today need to decide how much survives contact with the data.
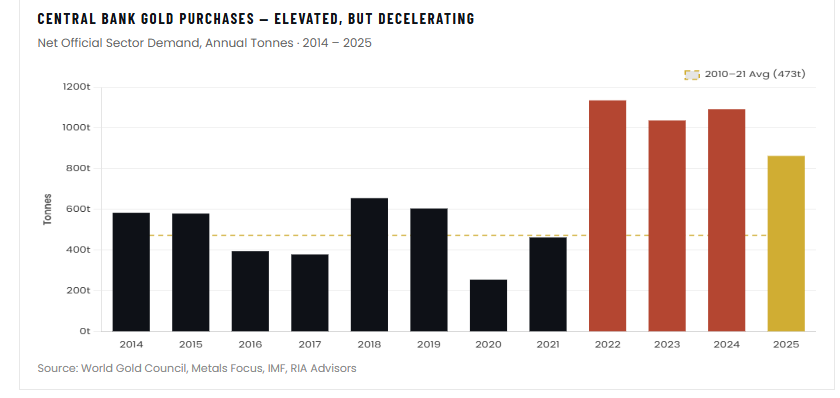
To be fair, there is enough truth in the narrative to keep it alive. The DXY has retraced roughly 10% from its early-2025 peak near 103.5. The IMF’s COFER data shows the dollar’s share of global FX reserves has slipped from 73% in 2001 to around 58% today. Central banks purchased 863 tonnes of gold in 2025 — cooler than 2024’s 1,092-tonne haul, but still the fourth-largest annual reserve build on record, roughly double the 2010–2021 average of 473 tonnes, and the 15th consecutive year of net official buying. BRICS+ now includes Iran, Egypt, Ethiopia, the UAE, Saudi Arabia, and Indonesia, representing nearly half the world’s population. China has trimmed its headline Treasury holdings by more than 27% since 2022, and the bloc is actively building non-SWIFT payment infrastructure through BRICS Pay and CIPS.
Assemble those data points in the right order, and you can construct an apocalyptic narrative that plays extremely well in a three-minute video. The problem is that the dollar the narrative describes is not the dollar the flows describe. As is so often the case in markets, what “everybody knows” is precisely what is already priced in, and frequently wrong.
The Dollar’s Tape Disagrees
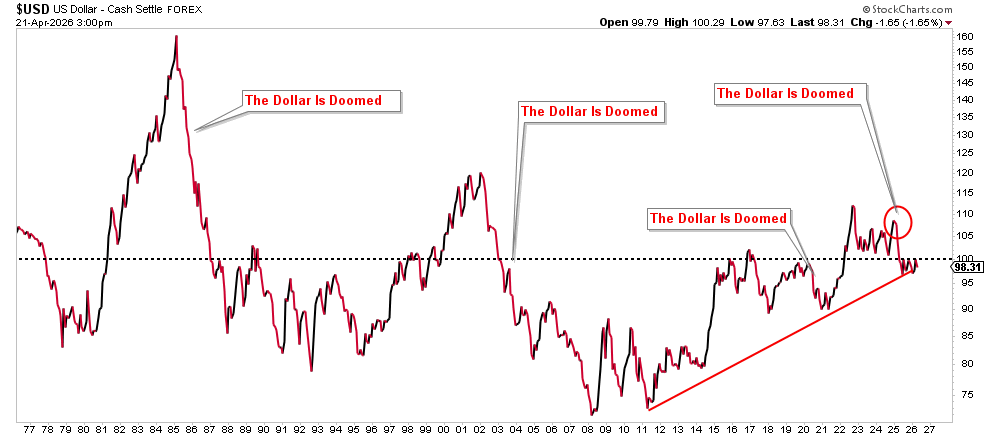
Start with the dollar itself. As of Tuesday, when I started writing this analysis, the DXY sits at roughly 98, essentially flat over the trailing 12 months and still well above its longer-term historical averages. For context, the index traded below 80 for most of 2011 through 2014. A dollar “near 100” is simply not consistent with the word “collapse.”
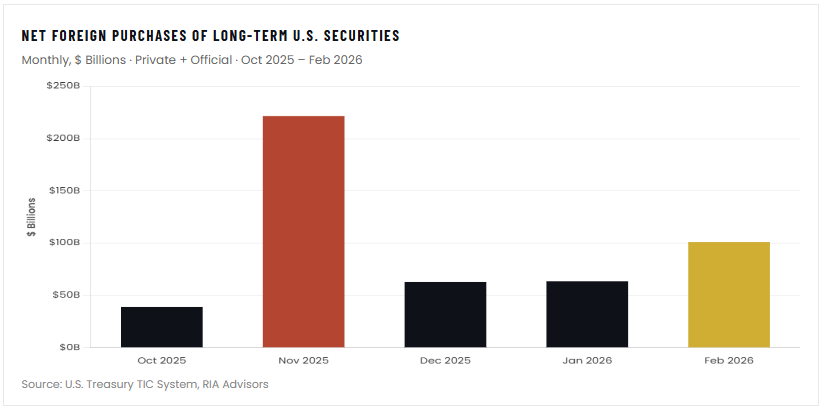
More importantly, look at what foreign investors are actually doing with their dollars. According to the latest Treasury International Capital (TIC) data, foreigners purchased a net $101 billion of long-term U.S. securities in February, following November’s blockbuster $222 billion print. Across the last five reporting months, net foreign inflows into long-term U.S. stocks and bonds totaled roughly $488 billion, a pace that rivals the post-COVID liquidity surge. If the world were truly abandoning the dollar, somebody forgot to tell the world’s money managers.
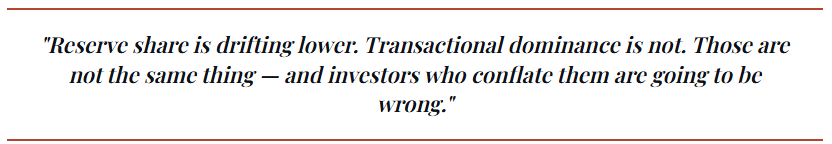
The BIS tells the same story from a different angle. The 2025 Triennial Central Bank Survey found that the US dollar accounted for 89.2% of all foreign exchange transactions in April 2025, up from 88.4% in 2022, across $9.6 trillion of daily turnover. The renminbi’s share climbed to 8.5%, a meaningful progress, but still a fraction of the dollar’s transactional footprint. Reserve share is drifting lower; actual dollar usage is not.
The China “Dumping” Illusion
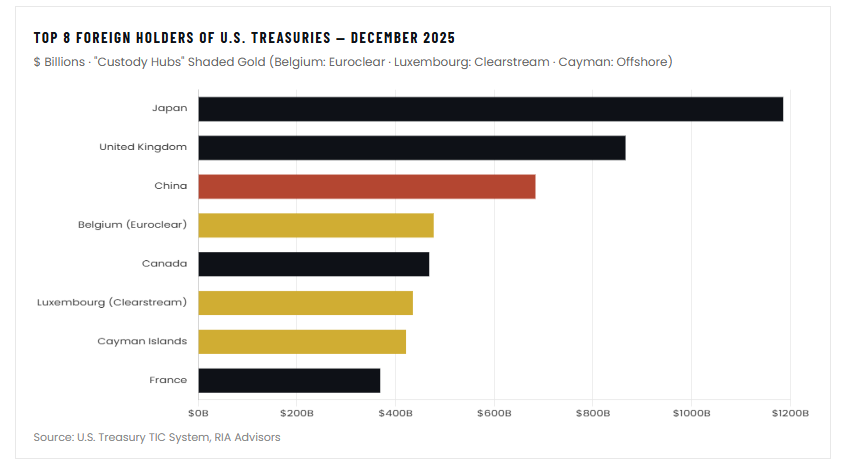
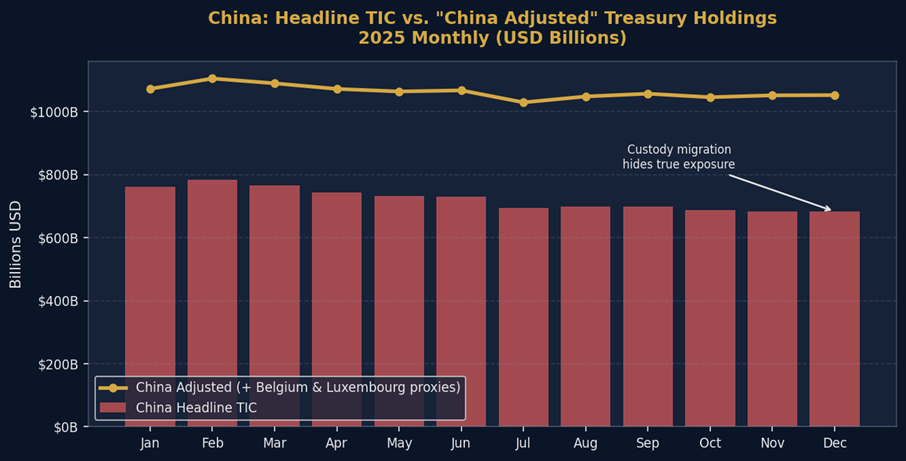
If one chart carries the de-dollarization narrative more than any other, it is the headline decline in China’s reported U.S. Treasury holdings. Those holdings in “US Custody” declined from roughly $1.2 trillion at peak to about $683 billion today. That looks like a 50% purge, and it gets rolled out as Exhibit A in every “dollar is dying” thread. Pay attention to the highlight of “US Custody.”

As we detailed in our two recent pieces, “Is China Really Dumping US Treasuries?” (February 23) and “The Dollar’s Plumbing: Conspiracy Vs. Data” (March 20), that chart is genuinely misleading. The Treasury’s own TIC FAQ flags the problem: holdings are reported by the location of custody, not by who bears the economic risk. China has been quietly migrating that custody, not liquidating it.
The evidence is in the data for two very small countries. As of November 2025, Belgium reported $481 billion in Treasury holdings and Luxembourg $425 billion, enormous totals for nations not remotely building reserves at that scale. Belgium is home to Euroclear; Luxembourg hosts Clearstream, and both countries are global settlement hubs. Over the period, China’s reported holdings fell by roughly $600 billion, Belgium’s rose by roughly $500 billion. Over the last twelve months, the UK, Belgium, and Japan were each net Treasury buyers of more than $115 billion, with Belgium’s holdings up 26%, the largest percentage gain among major holders.
As noted in that article:
“This is not a conspiracy. It is plumbing. One of the primary reasons that China uses Belgium for custodial purposes, besides avoiding geopolitical risk, is that the Euroclear Bank is based there and sits at the center of cross-border settlement and collateral mobility. Clearstream’s international depository is based in Luxembourg and serves the same global institutional client base. When a central bank or a state institution wants to hold a large Treasury portfolio with flexible settlement and collateral options, these hubs help address operational challenges.”
If we adjust China’s reported Treasuries to account for the custody migration to Euroclear and Clearstream, the total barely changes from its 2011 level. Meanwhile, total foreign holdings of U.S. Treasuries hit a record $9.4 trillion in November 2025. This is post-2022-sanctions risk management, not de-dollarization, and the dollar exposure is staying put. The plumbing changed. The balance did not.
The truly meaningful story is not about the dollar. It’s about who holds the debt and where they custody it.
Follow the Earnings, Follow the Flows
Why are foreigners still buying? The recent A16Z charts that are making the rounds this week tell you everything you need to know. Consensus earnings growth for the U.S. IT sector has been steadily revised higher all year, from 30.9% at the start of January to 37.1% in late February and 43.4% as of April. Info Tech is now expected to grow earnings more than 2x faster than the S&P 500 in 2026 (40% vs. 18%), with only Energy and Materials meaningfully outpacing the broader index.
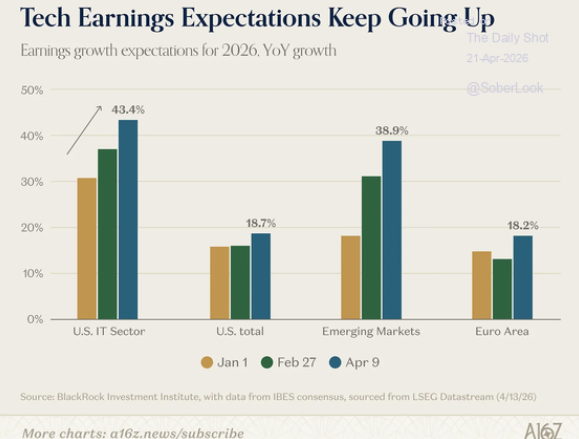
This is the most important lesson to learn: Capital follows returns. Europe’s 2026 earnings growth runs in the mid-teens, while Japan is meaningfully lower, and Emerging markets approach U.S. IT growth rates but carry convertibility, governance, and geopolitical risks that most fiduciary capital will not underwrite at scale. Global pension funds, sovereign wealth vehicles, and private wealth allocators with fresh savings to deploy effectively have no choice but to route capital back into U.S. equities and the Treasuries that fund the dollar leg of those allocations. That is the mechanical underbelly of the AI capital cycle, and it is still early.
What to Recognize About the Dollar
The “dollar is dying” narrative does what every bear narrative does at cyclical inflection points: it trades a kernel of truth for a wholesale conclusion. Yes, the dollar has weakened, and the reserve share has drifted lower. Yes, central banks are buying gold, and China has rearranged its custody footprint. None of those observations is wrong. However, the leap from observation to apocalypse is exactly the leap investors need to consider very carefully before piling into.
The data simply does not cooperate with the “Dollar’s funeral” narrative. With net foreign inflows into U.S. stocks and bonds running near post-COVID highs, and total foreign holdings of U.S. Treasuries just setting a record of $9.4 trillion. The collapse narrative simply has no real support.
There are four things that matter more than headline-dollar print.
- First, central bank gold buying is not “leaving the dollar.” Gold is priced in U.S. dollars, benchmarked to the LBMA and COMEX benchmarks, and converted back to U.S. dollars whenever it is mobilized for intervention, collateral, or settlement. Like Treasuries, agencies, or equities, gold on a central bank balance sheet is a dollar-linked reserve asset. Buying gold reduces exposure to U.S. Treasuries as a security type, but it does not reduce exposure to the dollar as the world’s unit of account. It is a portfolio rebalancing decision, not a currency defection.
- Second, reserve share and transactional usage are not the same thing. Central banks can diversify into gold, euros, and yuan without meaningfully changing day-to-day dollar demand. One drifts slowly over decades; the other is set by trade invoicing and capital markets plumbing, and the dollar dominates both by wide margins.
- Third, there is no viable alternative. The yuan is hamstrung by capital controls and limited convertibility. The euro lacks a unified fiscal backstop. Gold has no yield and no settlement rails. And BRICS itself is not politically unified: India signed a trade deal with the U.S. in February and halted Russian oil purchases weeks later.
- Fourth, cyclical decline and structural decline are not the same thing. The dollar is in a cyclical downtrend that fits comfortably inside its roughly 7-to-10-year regimes. That is a trading pattern, not a funeral.
So what should investors actually focus on? Not whether the dollar survives, the flows have already answered that question. Instead, focus on the variables that genuinely move portfolios:
- The earnings differential between U.S. and international equities,
- Notably, the AI capital cycle, which will pull global savings back toward U.S. assets,
- The Fed’s policy path, and
- The cost of hedging dollar exposure relative to its realized volatility.
Those are the inputs that change returns. Whether the dollar prints 96 or 102 next quarter will not meaningfully alter the investment case for a diversified, dollar-denominated portfolio. However, the dollar is not collapsing or being replaced; it is simply being repriced. There is a very large difference between the two, and that difference is where investor attention belongs.
Narratives make headlines. Flows make markets. Right now, the flows are still pointing home — and the AI cycle means they likely will for some time.
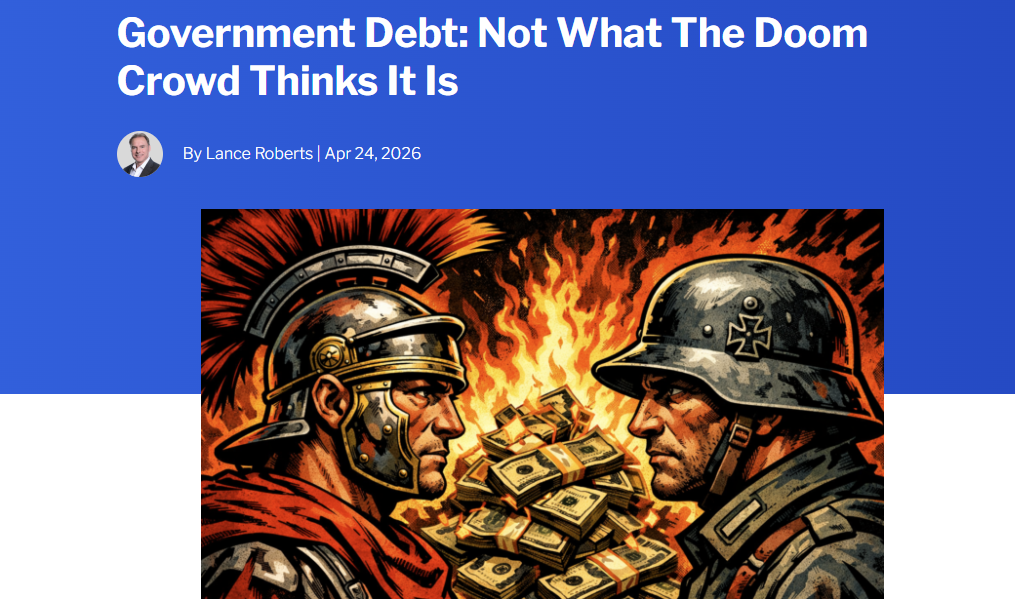
🖊️ From Lance’s Desk
This week’s #MacroView blog examines the myth that the US is headed for a fall like that of the Weimar Republic or Rome.
Also Posted This Week:
📹 Watch & Listen
In this week’s video, we discuss the recent market surge and why a correction or consolidation is likely.
Subscribe To Our YouTube Channel To Get Notified Of All Our Videos
📊 Market Statistics & Analysis
Weekly technical overview across key sectors, risk indicators, and market internals

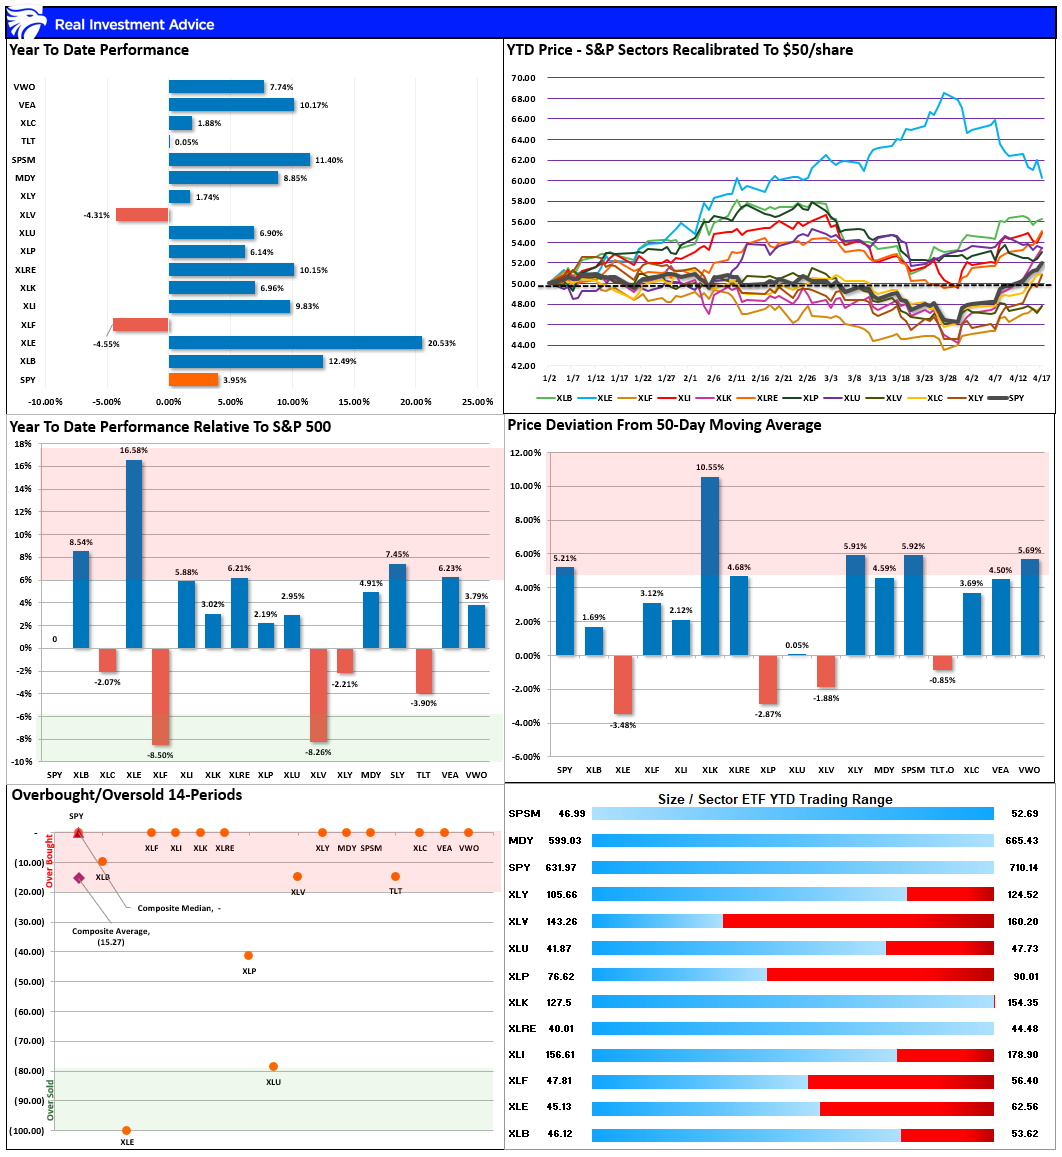
💸 Market & Sector X-Ray: Market Cracks Support
Previously, we noted that: “With every other sector extremely oversold, the logical setup now is for that rotation out of energy into other areas of the market to begin as soon as clarity on Iran emerges.” As shown in the upper-right box, that is what happened over the past two weeks, as the entire premium in the energy sector reversed and technology surged. With the market now rebalanced, we should see a broader advance next week. Markets are getting overbought, so rebalance risk as needed.
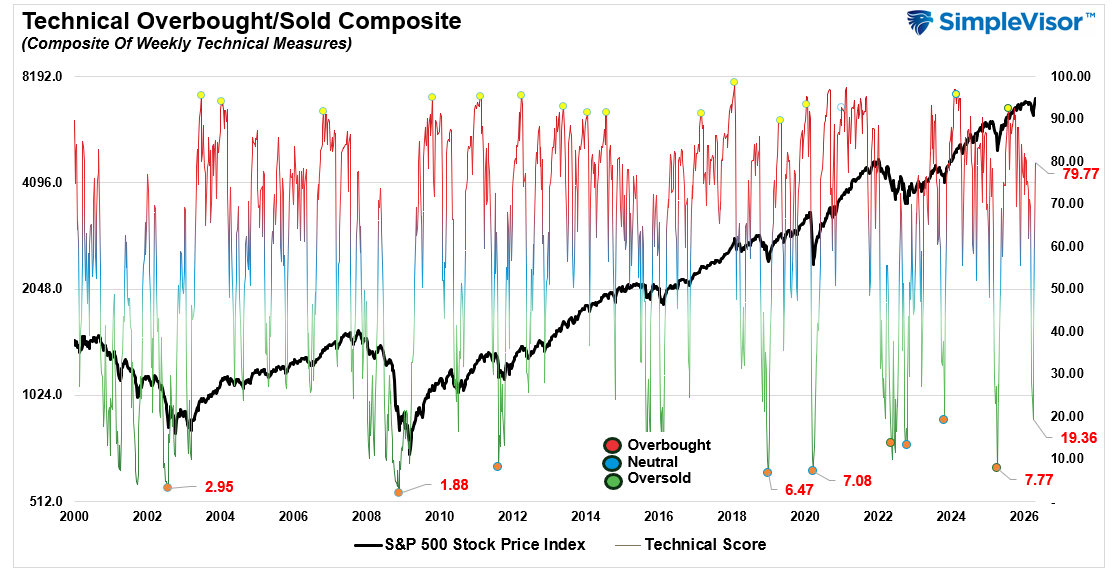
📐 Technical Composite: 79.77 – Market Surge Approaching Overbought
As noted previously, “The odds of a reflexive rally are increasing. We are currently at levels we haven’t seen since 2022.” That reflexive rally came hard, with the market posting its best performance since March 2022. We are approaching overbought levels, so use this rally to rebalance risk and exposures as needed.
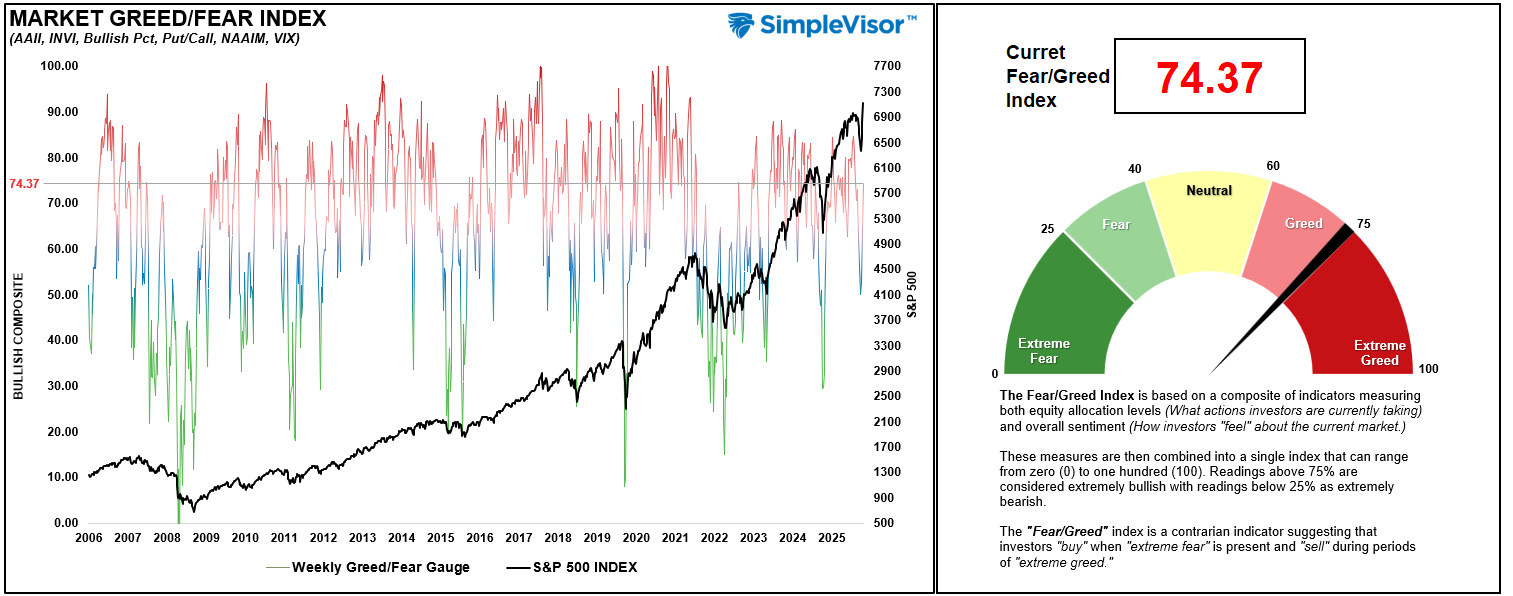
🤑 Fear/Greed Index: 74.37 – Investors Go All In
As we noted two weeks ago, “While not at ‘fear levels’ yet, the selloff has been rather sharp, so a reflexive rally.“ The reflexive rally came with a vengeance over the last two weeks, and investor sentiment and positioning went from “fear” to borderline “extreme greed” in just that time. There is now decent momentum behind the market, but if you didn’t like the recent selloff, this is a good time to rebalance risk and portfolio allocations.
🔁 Relative Sector Performance
In our last update, we stated: “Given the divergence between Energy and the rest of the market, profit-taking in Energy seems prudent.” This past week, energy sold off sharply while Technology staged a massive rally. Currently, Technology and Transportation are very overbought. Take profits and rebalance risk accordingly.

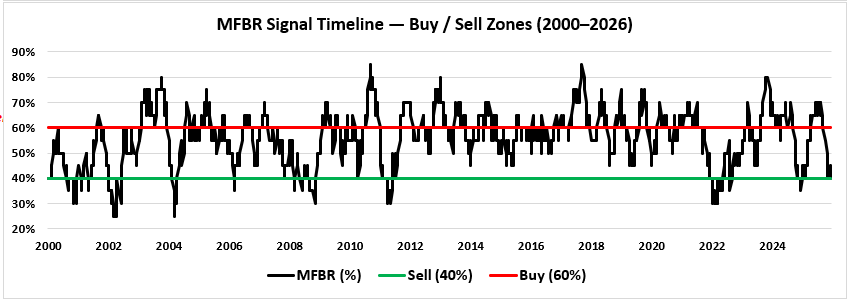
📊 MFBR Index (Money Flow/Breadth Ratio Indicator): 45% = Neutral/Bullish
NEW! MFBR Index: The Money Flow Breadth Ratio (MFBR) model is a rules-based equity allocation framework that uses weekly S&P 500 money flow data to generate buy, sell, and neutral signals. It is designed to systematically adjust portfolio equity exposure in response to the direction and persistence of institutional capital flows, aiming to reduce drawdowns while capturing the majority of market upside.
“As of April 17, 2026, with the S&P 500 at 7,126.06, the Money Flow Breadth Ratio (MFBR) stands at 45% and rising. This places the indicator in neutral territory (40-50%), triggering a NEUTRAL signal. The prior week’s reading was 40%, representing a 5% decline over the trailing four weeks. The increase in the MFBR suggests both money flows and breadth are improving, maintain current equity exposures, and rebalance risks as needed.”
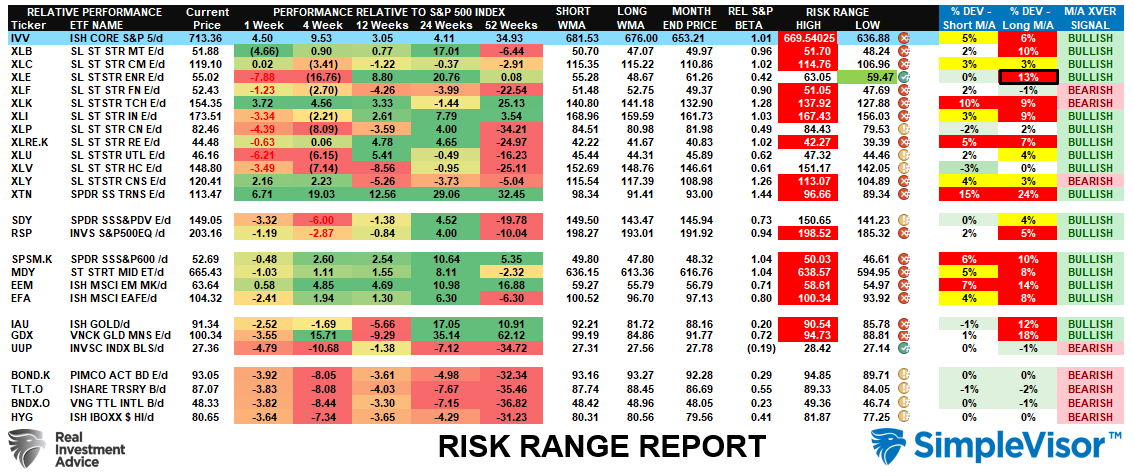
📊 Sector Model & Risk Ranges
What a difference two weeks can make. The sectors that were most aggressively extended, as we warned, reversed. The sectors that were most beaten up were aggressively bid. This is why we regularly recommend rebalancing when sector performance becomes too bifurcated. The good news is that the market has recovered and the bulls are back in control. The bad news is that there are an increasing number of bearish crossovers, which typically signal rougher times ahead. With most sectors and markets well outside their respective ranges, take profits and rebalance risk, a pullback is increasingly likely over the next two weeks.
Have a great week.
Lance Roberts, CIO, RIA Advisors


Lance Roberts is a Chief Portfolio Strategist/Economist for RIA Advisors. He is also the host of “The Lance Roberts Podcast” and Chief Editor of the “Real Investment Advice” website and author of “Real Investment Daily” blog and “Real Investment Report“. Follow Lance on Facebook, Twitter, Linked-In and YouTube
Customer Relationship Summary (Form CRS)