


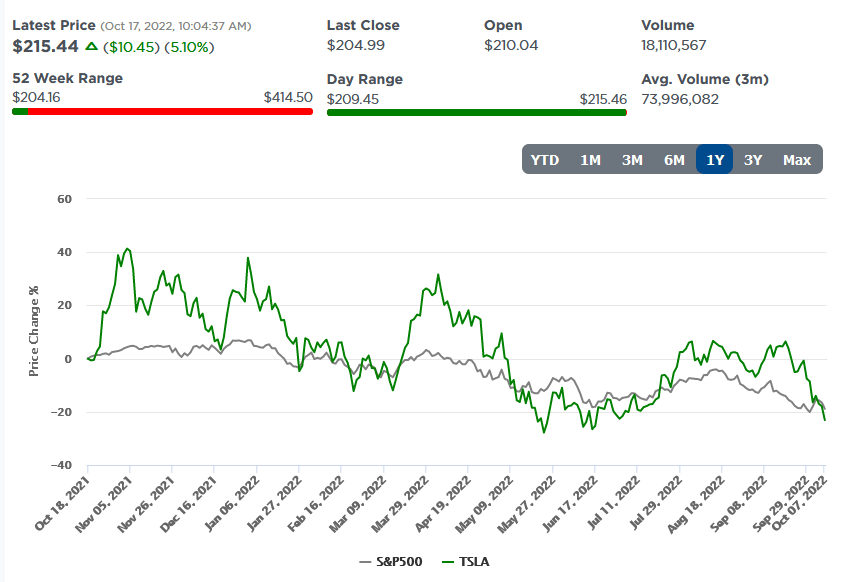
Tesla’s fall from grace has been swift. The first graph below shows that over the last 52 weeks, the S&P 500 is outperforming Tesla shares. At various points over the last year, Tesla held a 30-40% lead over the market. The second graph shows that Tesla’s fall has been recent and rapid. In just the last month, Tesla’s shares have fallen over 30%, making it the fourth worst performer in the S&P 500 over the period. While it’s easy to blame recent performance on Elon Musk and his poorly handled Twitter takeover and various political commentary, we must also remember its valuation was grossly high. At its peak, Tesla’s market cap was greater than the entire auto industry combined.
Despite Tesla’s lower price and valuations, caution is warranted. Most auto companies are catching up quickly to Tesla on its EV offerings. Despite robust EV competition, valuations remain very high. Therefore, a further fall in the stock price should not be surprising. Tesla has a P/E of 84 and a forward P/E of 36. Ford, for example, has a P/E and forward P/E of 4 and 6, respectively.


What To Watch Today
Economy
- 9:15 a.m. ET: Industrial Production, month-over-month, September (0.1% expected, -0.2% prior)
- 9:15 a.m. ET: Capacity Utilization, September (80.0% expected, 80.0% prior)
- 9:15 a.m. ET: Manufacturing (SIC) Production, September (0.2% expected, 0.1% prior)
- 10:00 a.m. ET: NAHB Housing Market Index, October (43 expected, 46 prior)
- 4:00 p.m. ET: Net Long-Term TIC Outflows, August ($21.4 billion prior)
- 4:00 p.m. ET: Total Net TIC Outflows, August ($153.5 billion prior)
- 10/18-10/21: Monthly Budget Statement, September (-$128.0 billion expected, -$64.9 billion prior)
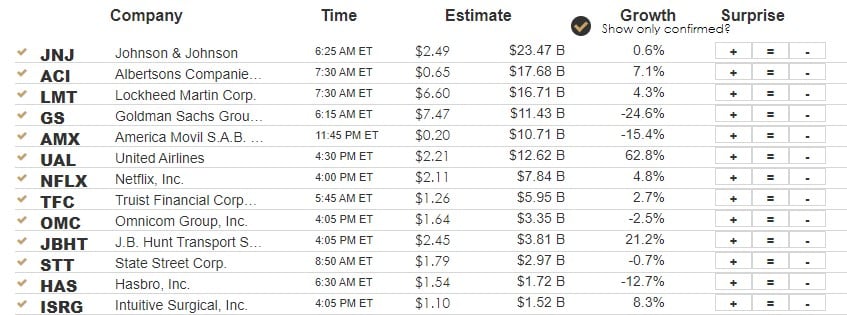
Earnings
Market Trading Update
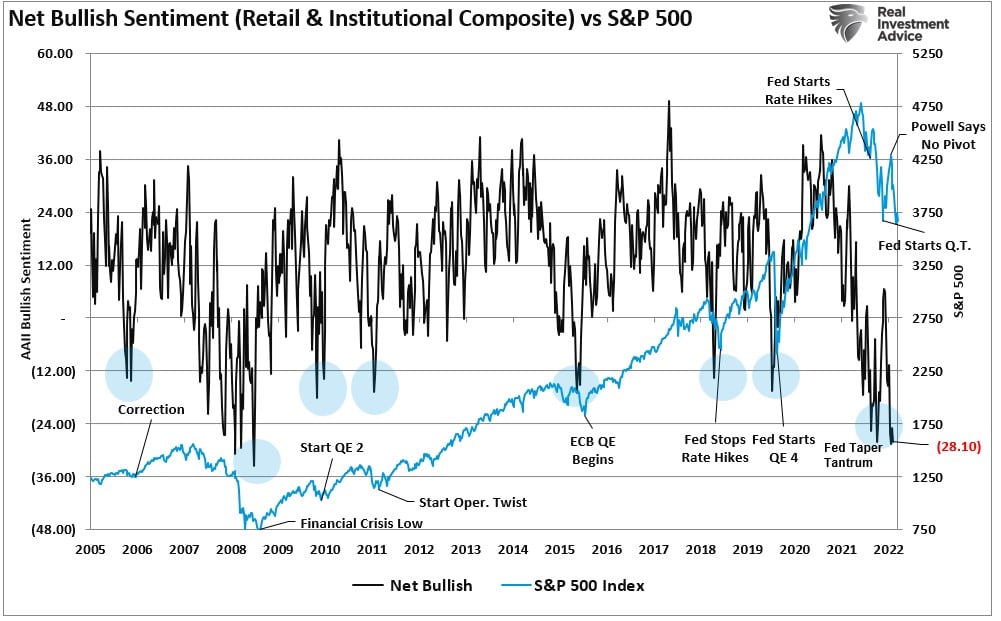
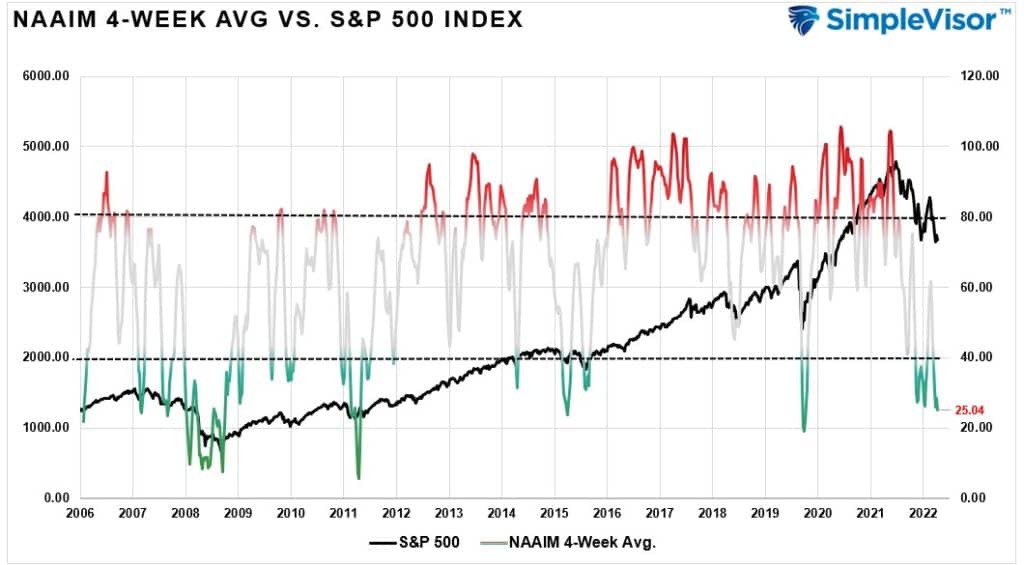
As noted yesterday, the market continues to hold support at the 200-week moving average, which is also the bullish trend line from the 2009 lows. Yesterday’s rally was not unexpected, and as noted over the last couple of weeks, sentiment is negative, and positioning remains extremely light. Such is shown in the composite bullish sentiment index and the NAAIM survey.
We will have to wait and see if yesterday’s rally has any follow-through. We have seen repeated rallies fail quickly this year. However, given the more negative sentiment backdrop, combined with heavy short-positioning, a rally to 3900-4100 over the next few weeks is possible. In the short-term, the MACD buy signal has registered, and if the market can break above the 20-dma today, the market would have a clear shot at the resistance cluster at 3900.
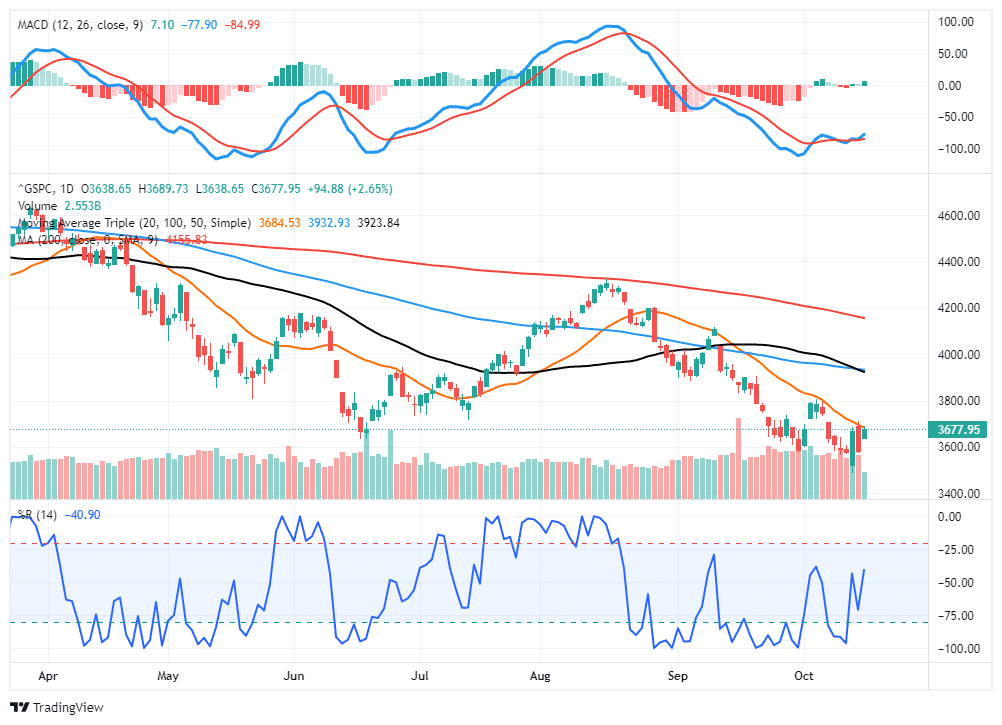
With earnings season underway, “less bad” earnings could catalyze a bear-market rally combined with the return of stock buybacks into year-end. Despite the “fall of Tesla,” yesterday’s market action was clustered in the major technology stocks. That may well be where flows go over the next month.
However, whatever rally we do get should be sold into unless, or until, the Fed changes course on monetary policy. A recession is coming in 2023, it is now only a question of how deep it will be.
Equity and Corporate Bond Valuations are Still Expensive
One of the frequent topics we have been discussing is whether or not we are in a bear market. Everyone seems to have a different definition of a bear market and, therefore, a different market perspective. What should matter more to investors is not how to classify the market (bull or bear) but the market’s forward return prospects. The table below from Goldman Sachs shows that popular valuation ratios are still very high. The lower part of the table shows that corporate bond yield valuations are also high. Based purely on this table and not other technical indicators or rules of thumb defining bear markets, there is still plenty of room to the downside.

Discount Rates Matter
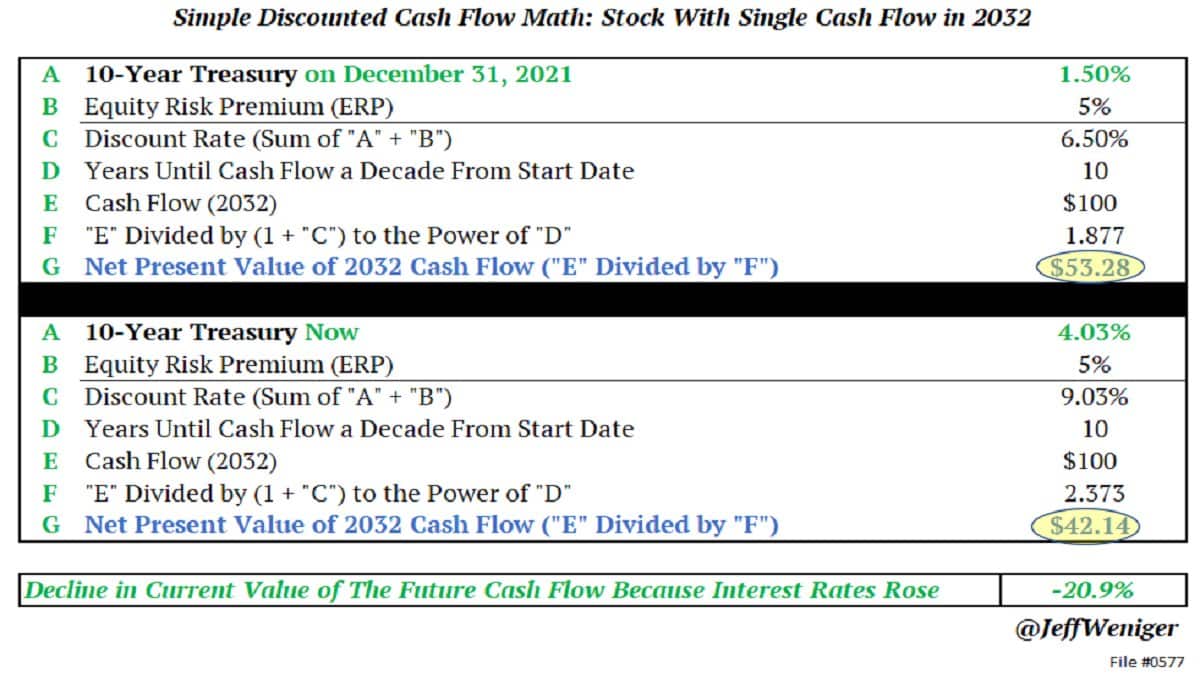
In theory, stock investors are buying the company’s future cash flows. Investors use present value formulas to put a value on expected cash flows. One of the key inputs in a present value formula is the discount rate. The discount rate is the risk-free U.S. Treasury yield plus a risk premium.
The table below from Jeff Weniger helps explain why valuations remain high despite a 30%+ decline in the market this year. Jeff’s work below shows a simple example to help us understand how higher interest rates have affected stock prices. As he shows, the rate effect of the ten-year UST yield rising from 1.50% to 4.00% should deduct about 21% from the present value of cash flows. Given that 2/3rds of the decline this year is due to rates, only about a third, or 10%, is from shrinking valuations. Rates may be close to peaking, which is good news, but valuations, as we share above, have plenty of room to fall from current levels.
Cusp of a Bear Market
We have shown significant evidence over the past few weeks showing that the S&P 500 is on the cusp of a bear market, but in our opinion, it is still technically in a bull market. We continue to gather evidence to help determine if a bear market is nearing, such as the graph below. It shows that the VIX volatility index and the S&P 500 signals a bearish warning. The VIX tends to break out higher significantly during bear markets. More often in bull markets declines, the VIX is elevated but usually peaks in the 30-40 range. Thus far, the VIX is not overly concerning, but our concerns will be on the rise as it continues to test the 30 barrier.

Tweet of the Day
Please subscribe to the daily commentary to receive these updates every morning before the opening bell.
If you found this blog useful, please send it to someone else, share it on social media, or contact us to set up a meeting.