


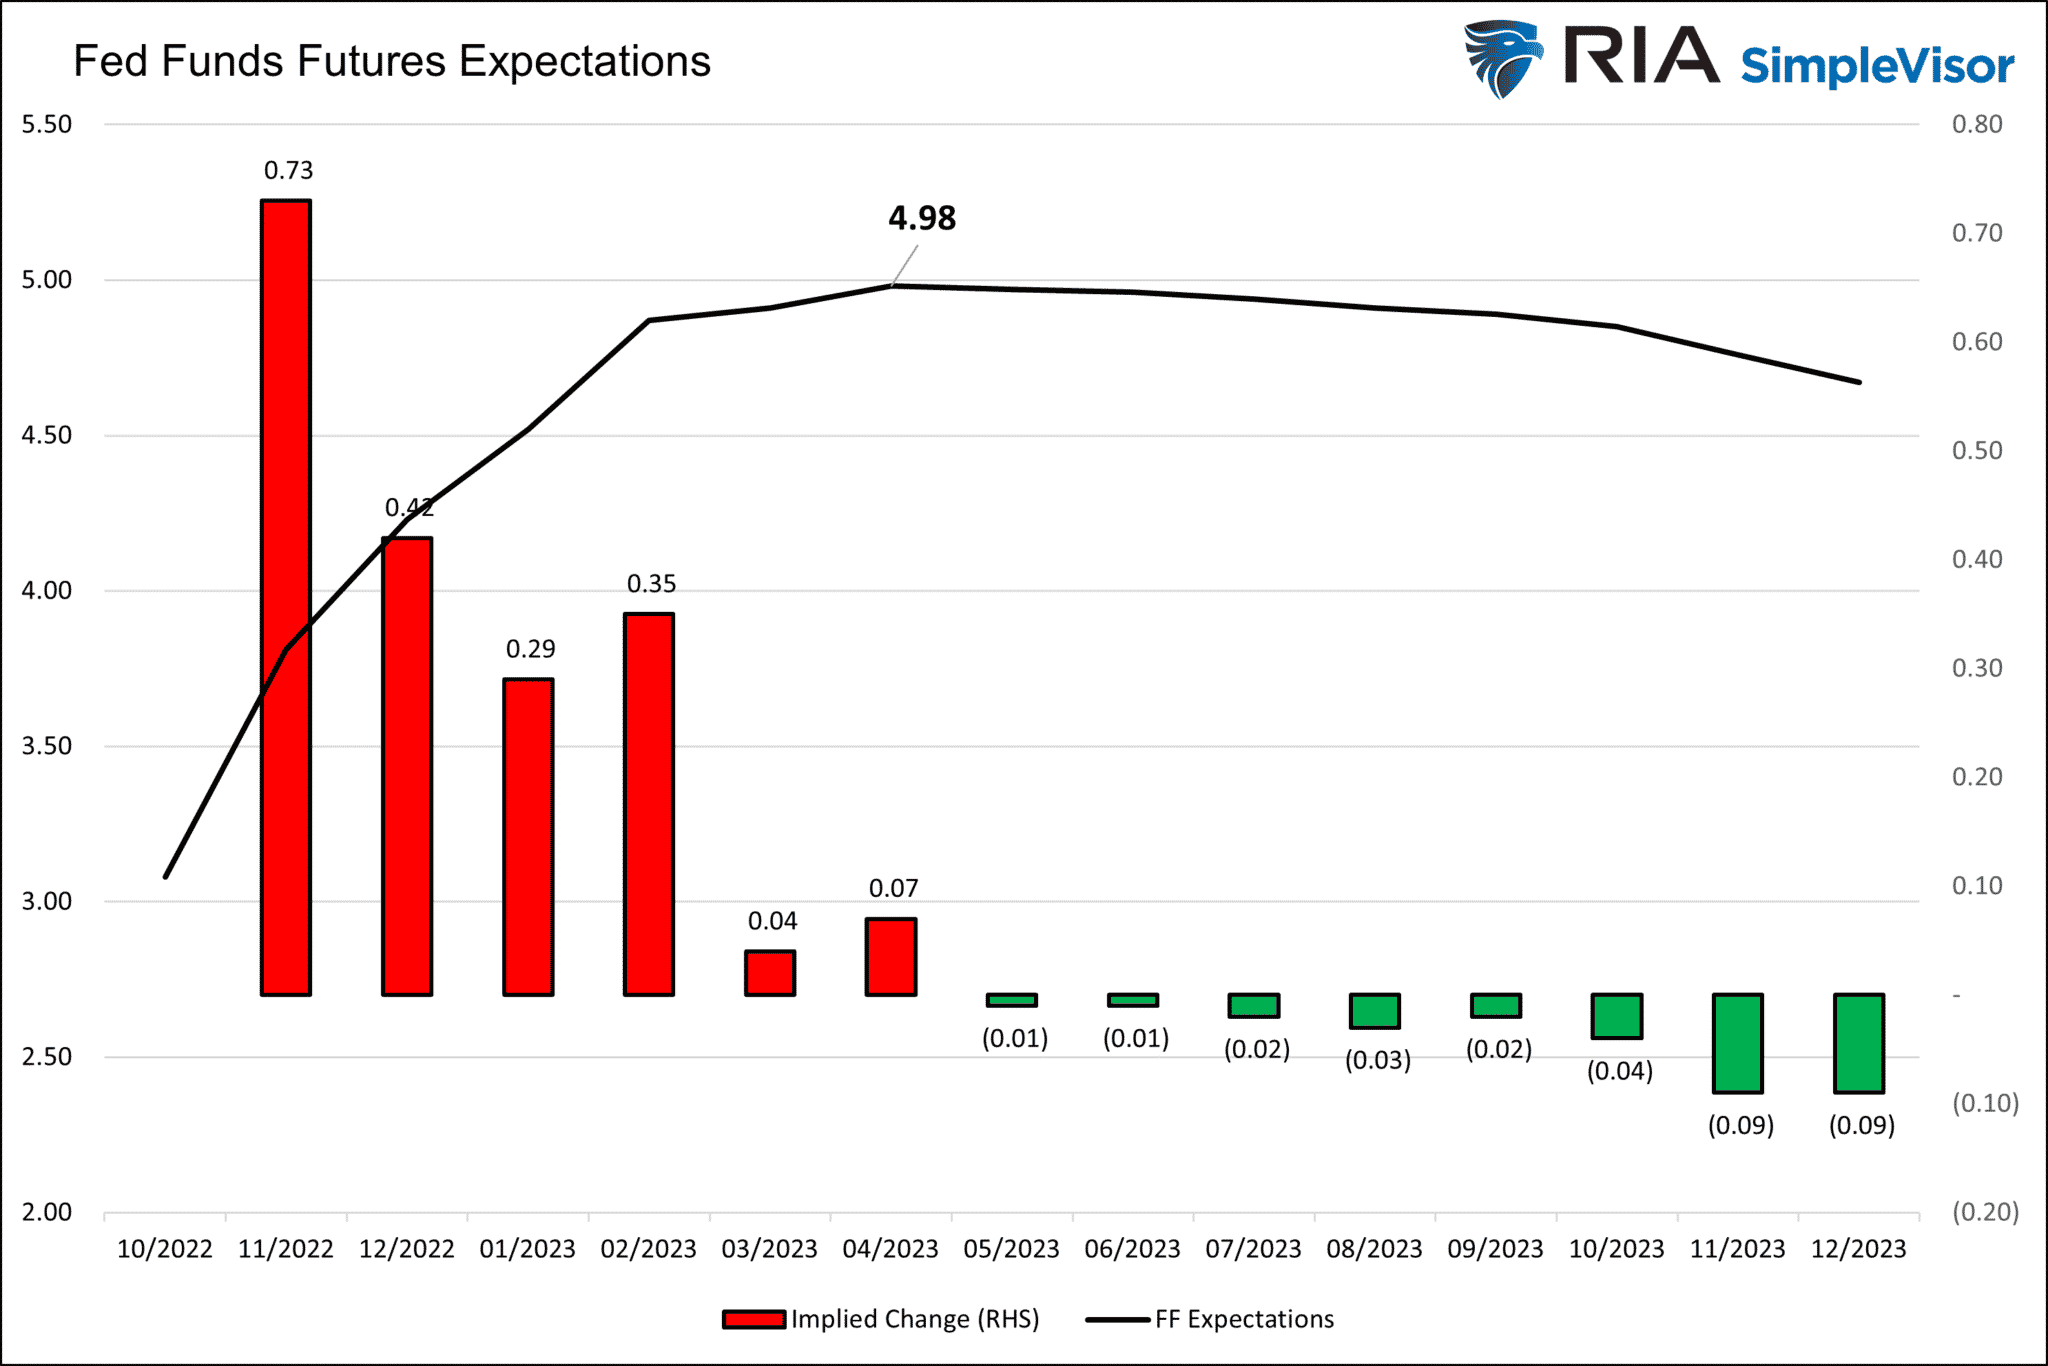
Per Wikipedia, the Fog of War is “the uncertainty in situational awareness experienced by participants in military operations.” Similarly, the Fed is waging war on inflation in the fog. Monetary operations are not immediate. Rate changes and QT affect the economy with a lag. The lag, which can last at least three to six months, is the fog making current Fed decision-making treacherous. The Fed has already raised rates by 3%. Traders expect them to raise by another 2% by April. Unsure of the degree to which last summer’s rate hikes will dampen economic activity and further reduce market liquidity, make Fed decision-making very difficult.
If the Fed continues with rate increases as planned, they risk overshooting. While they are likely to win the war on inflation in such a scenario, the thick fog clouding the Fed’s policy decisions becomes increasingly likely to severely weaken the economy and or cause a financial crisis.

What To Watch Today
Economy
- No notable economic releases today.
Earnings

Market Trading Update
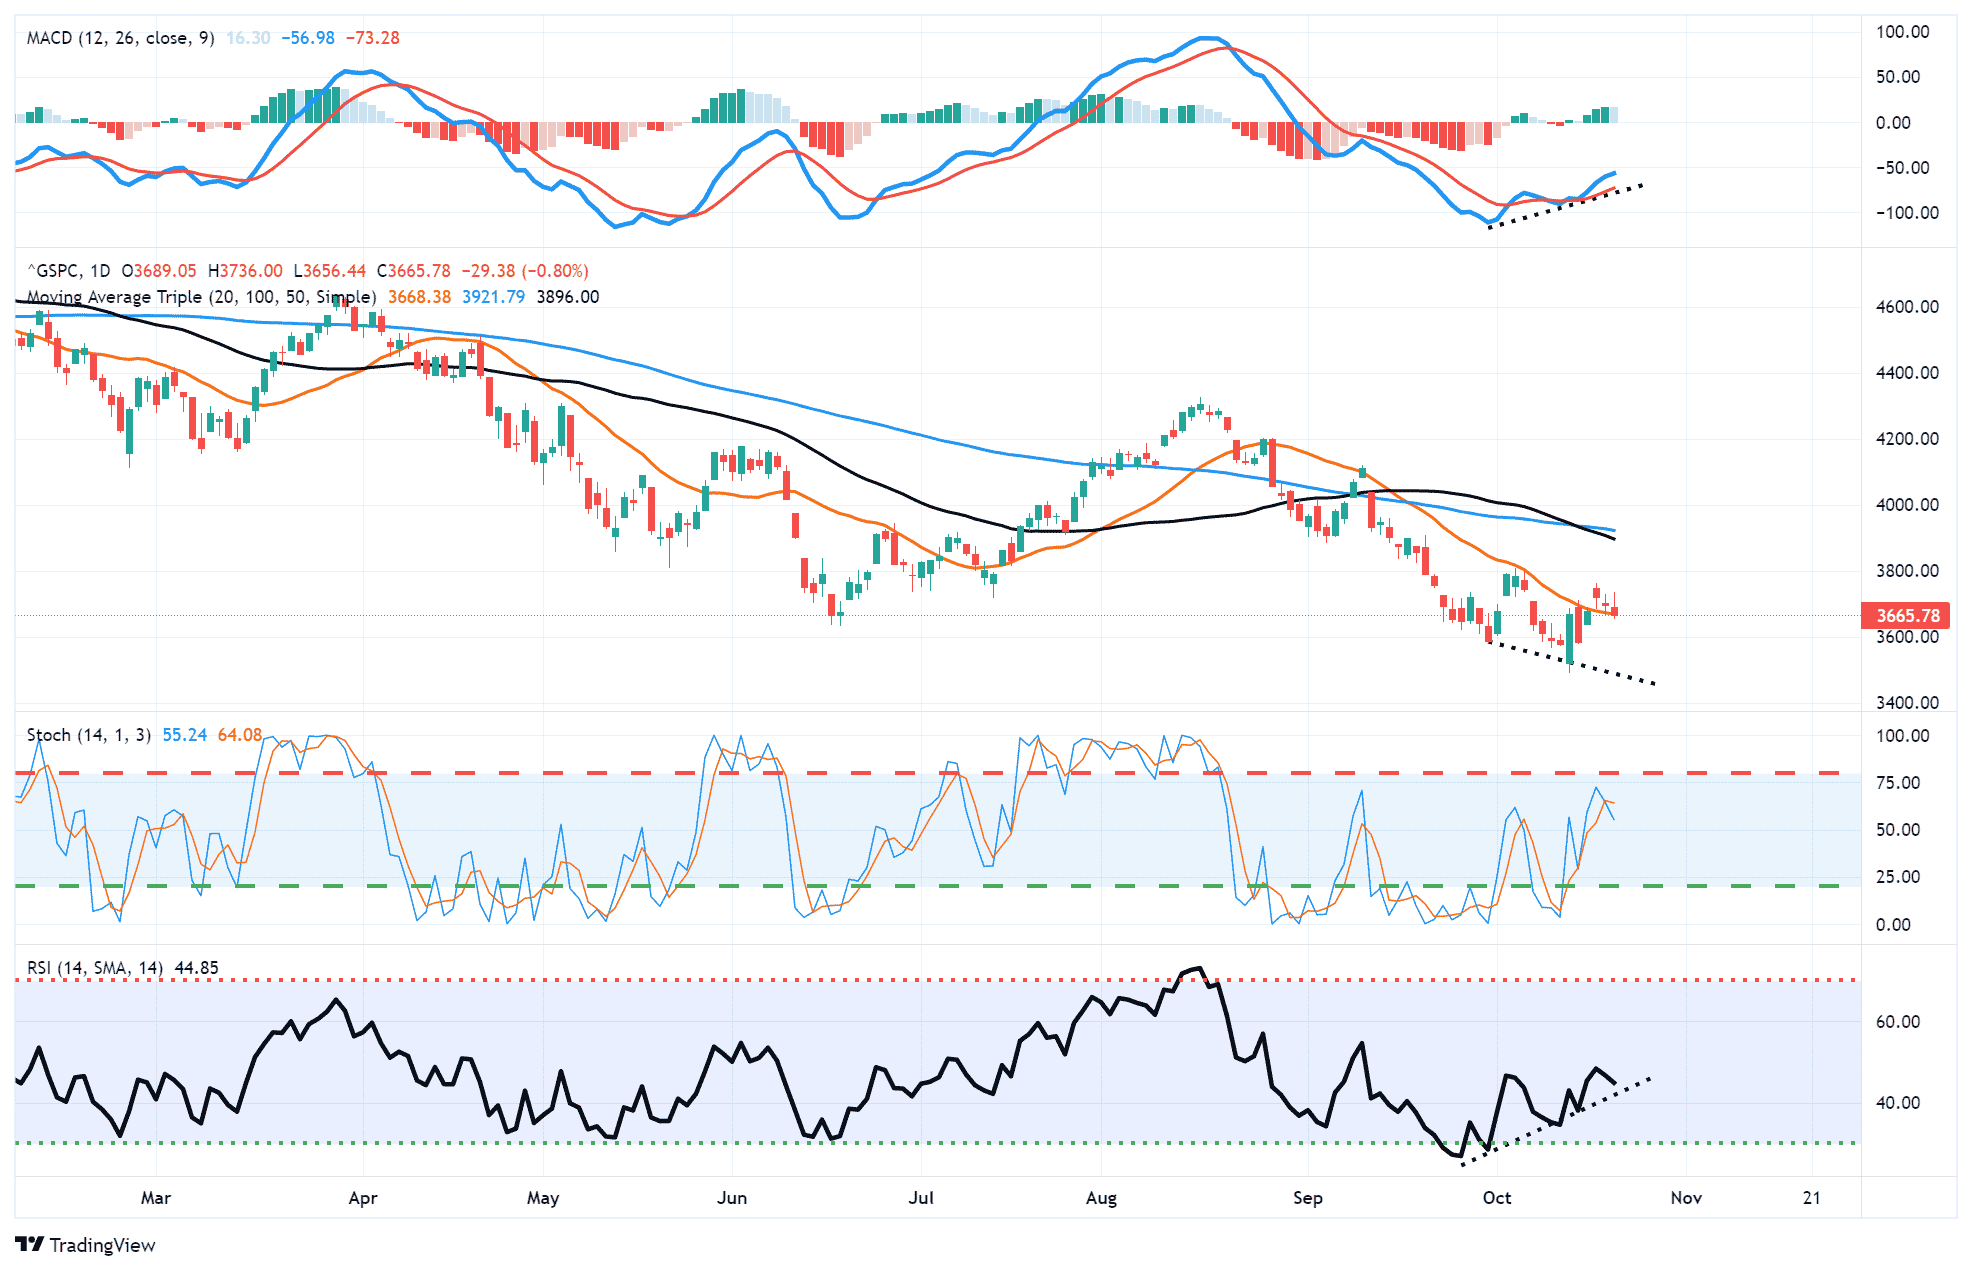
The market started out yesterday with a strong rally, but the “fog” of Liz Truss’s quick departure as Prime Minister, and the perceived threat of what may occur in the U.S., sent stocks tumbling into the close. The volume was light yesterday, and the market held support at the 20-dma. Also, while the market sold off, volatility remained muted. From a more bullish perspective, the positive divergence of the MACD and RSI suggests the current rally is still intact despite a sloppy and weak start. While we would not be surprised by a negative close on Friday, as investors don’t want to hold equities over the weekend, we continue to give this market the benefit of the doubt short-term. As noted, next week ends the “stock buyback blackout” period for corporates, adding roughly $4.5 billion in daily buying power through year-end.
Stocks Lead the Economy
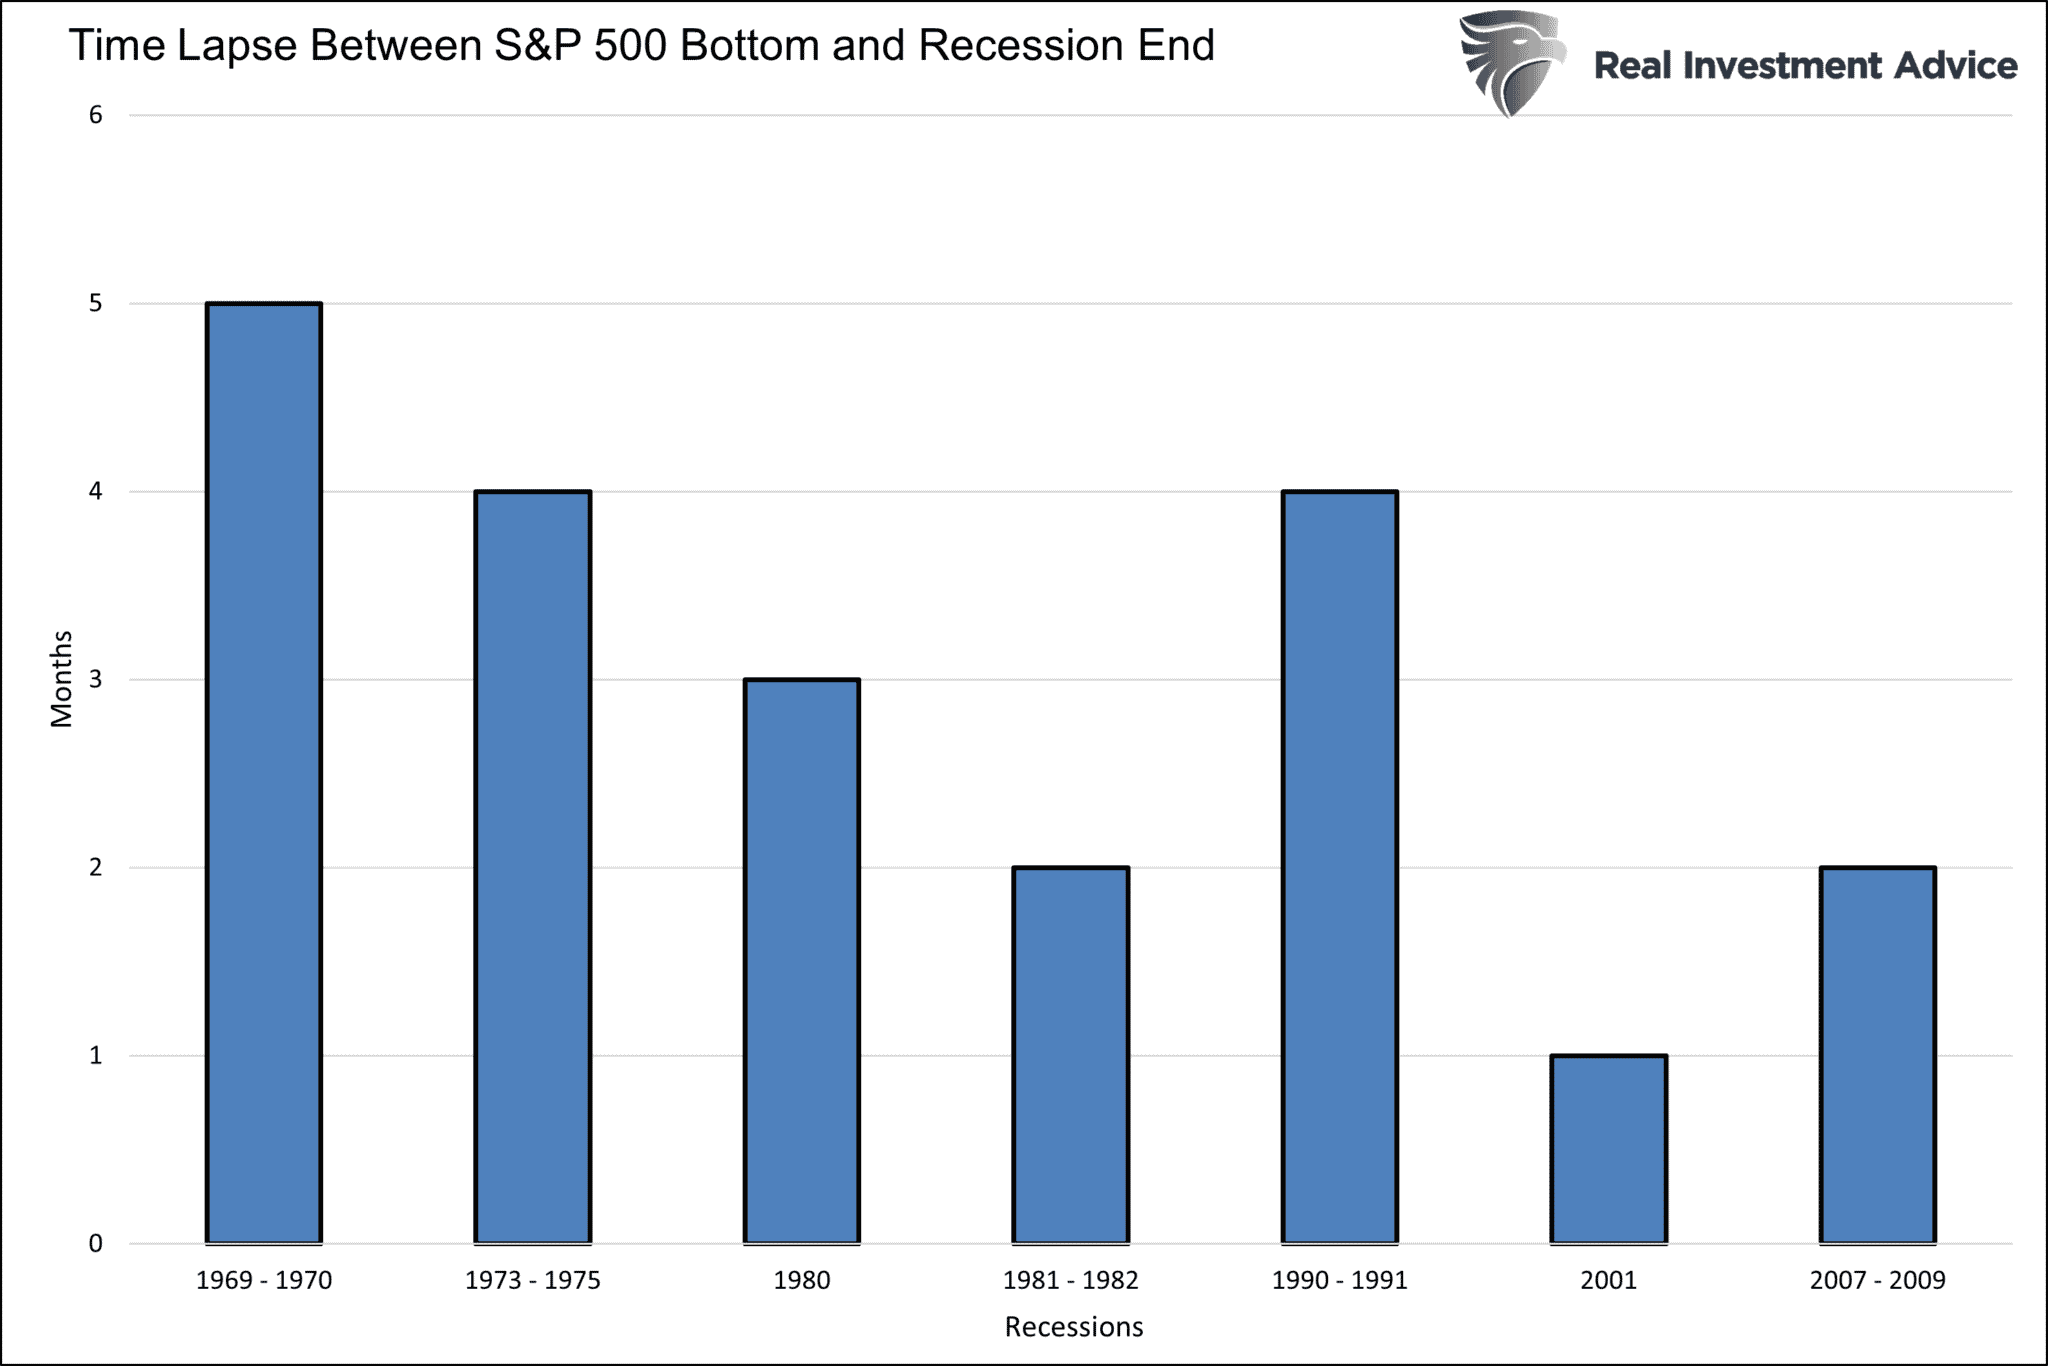
In Thursday’s Commentary, we shared OECD leading economic indicator data indicating a recession is likely. Stocks tend to be forward-looking, reacting to perceived economic change in advance. For example, the S&P 500 has fallen about 30% as the odds of a recession grow steadily. While stock indexes price in a recession, the NBER has not officially declared a recession.
The market is getting ahead of the recession call. We should also expect it to front run the ultimate recovery. The graph below shows that S&P 500 tends to bottom on average about three months before a recession ends. At this point, we need to wait for a formally declared NBER recession and look for signs that the market is bottoming and signaling a recovery. Keep in mind the NBER often backdates recessions. We may find out a recession started last summer two years from now.
John Hussman Warns About Further Losses
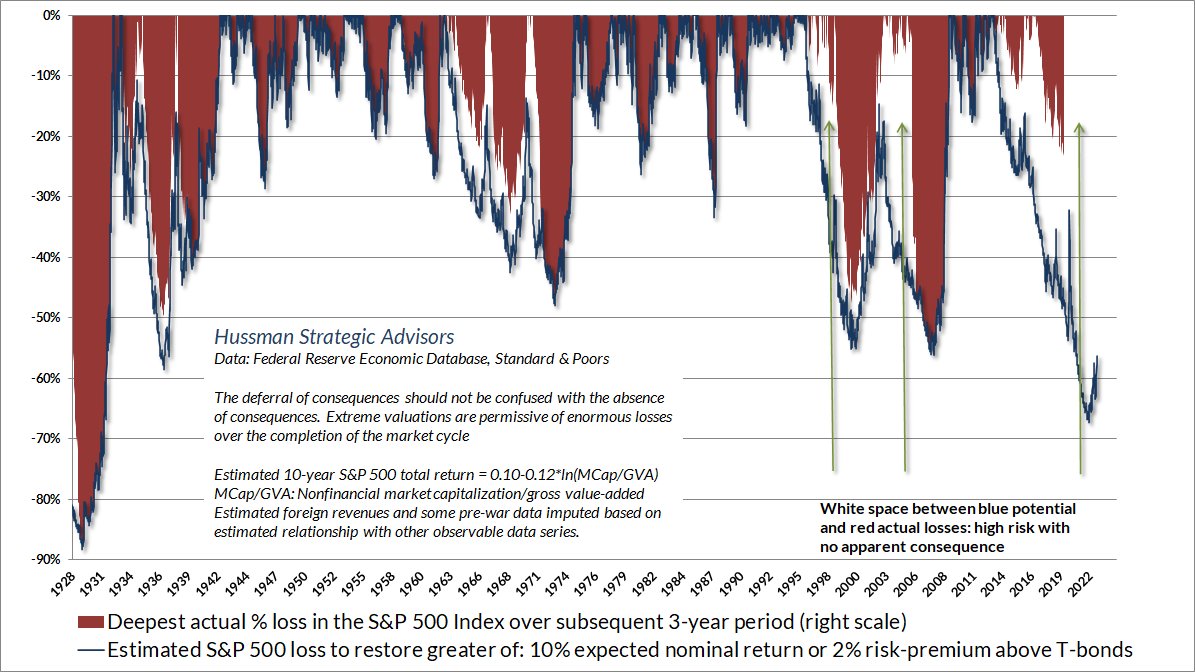
In Goodbye TINA – Hello BAAA, we warn that expected stock returns, based on three popular valuation ratios, could be in the low single digits over the next ten years. In the graph below, John Hussman presents a similar warning in a different format. He estimates the S&P 500 needs to decline by about 55%, or another 25%, to bring stock return expectations back to historical averages (10%). Hussman uses a variation of market cap to GDP to estimate expected returns. The second graph from our article below shows the ratio of market cap to GDP forecasts a -2.5% expected total return over the next ten years.

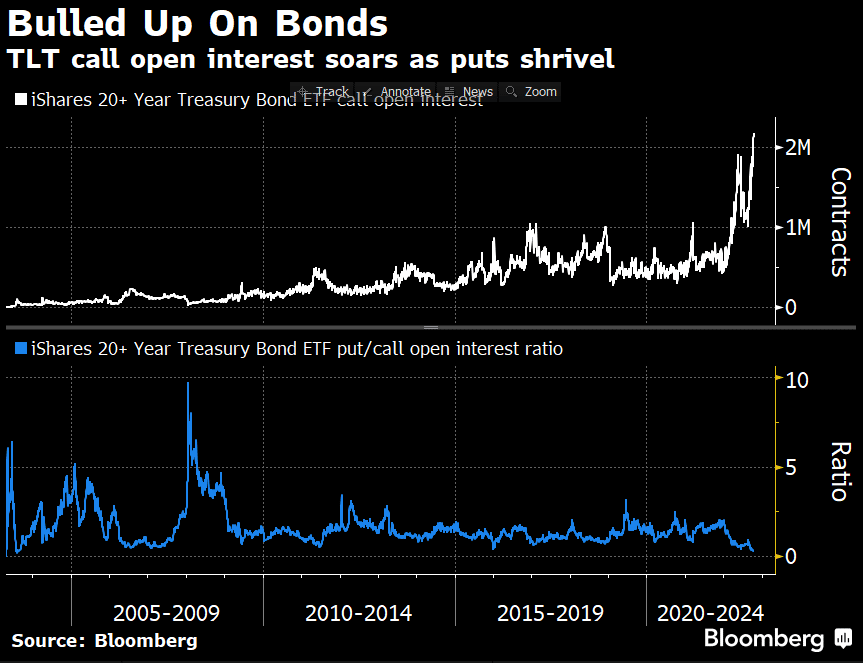
Retail Investors are Bulled Up on Bonds
Retail investors haven’t been this bullish on bond prices in almost 20 years. The top graph shows that call option open interest on TLT, the popular Treasury bond ETF, is well above any historical instance. The lower chart shows that the put-call ratio is at the lowest level since 2003. Those that correctly timed call option buying in 2003 saw TLT rise about 20% over the next six months.
The put-call ratio is the number of put options divided by the number of call options. The lower the ratio, the more calls are traded compared to puts. It is important to note that retail investors primarily use TLT. Hedge funds, banks, and other institutional investors often trade options on bond futures. Therefore, the bullishness in the graphs below may not represent the entire investment community.
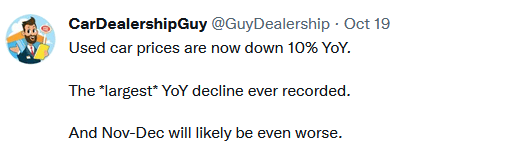
Tweet of the Day
Please subscribe to the daily commentary to receive these updates every morning before the opening bell.
If you found this blog useful, please send it to someone else, share it on social media, or contact us to set up a meeting.