


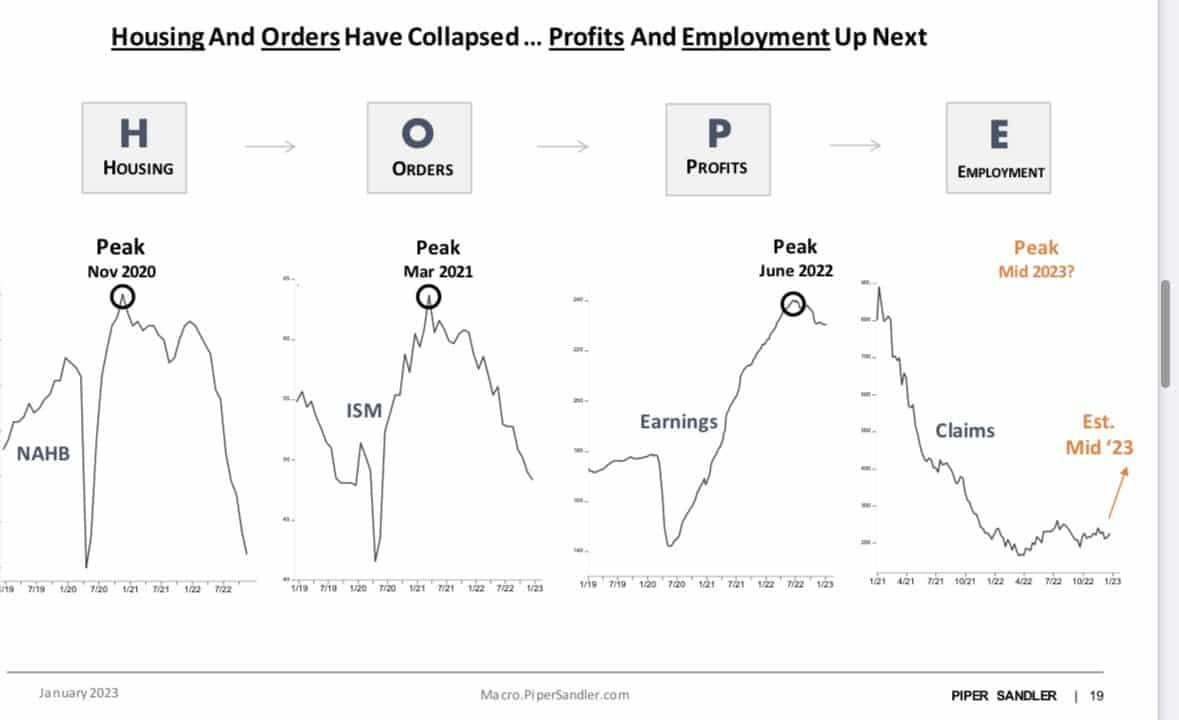
Michael Kantro, CIO of Piper Sandler, uses the HOPE cycle to show the order in which economic activity typically deteriorates before a recession. Michael’s HOPE model comprises Housing, New Orders (ISM), Corporate Profits, and Employment. Per his graphic below, the HOPE cycle is progressing as it typically does before a recession. Housing and ISM New Orders have peaked and already fallen to levels associated with recessions. On the other hand, corporate profits and employment are only beginning to show signs of trend changes.
The Fed is chasing inflation and appears little concerned about a recession. Its sole focus on inflation prevails even though many economic and market gauges point to an imminent recession. Per Michael Kantro:
The HOPE cycle is moving along in order. How much economic pain will investors celebrate with the backward-looking focus of Fed policy? This is why we think most of the pain will be felt AFTER employment weakens, not before. Inflation is still a larger fear than recession.
Let’s HOPE this time is different.
What To Watch Today
Economy
- 6:00 a.m. ET: NFIB Small Business Optimism, December (91.5 expected, 91.9 prior)
- 10:00 a.m. ET: Wholesale Trade Sales, month-over-month, November (0.2% expected, 0.4% prior)
- 10:00 a.m. ET: Wholesale Inventories, MoM, November Final (1.0% expected, 1.0% prior)
Earnings

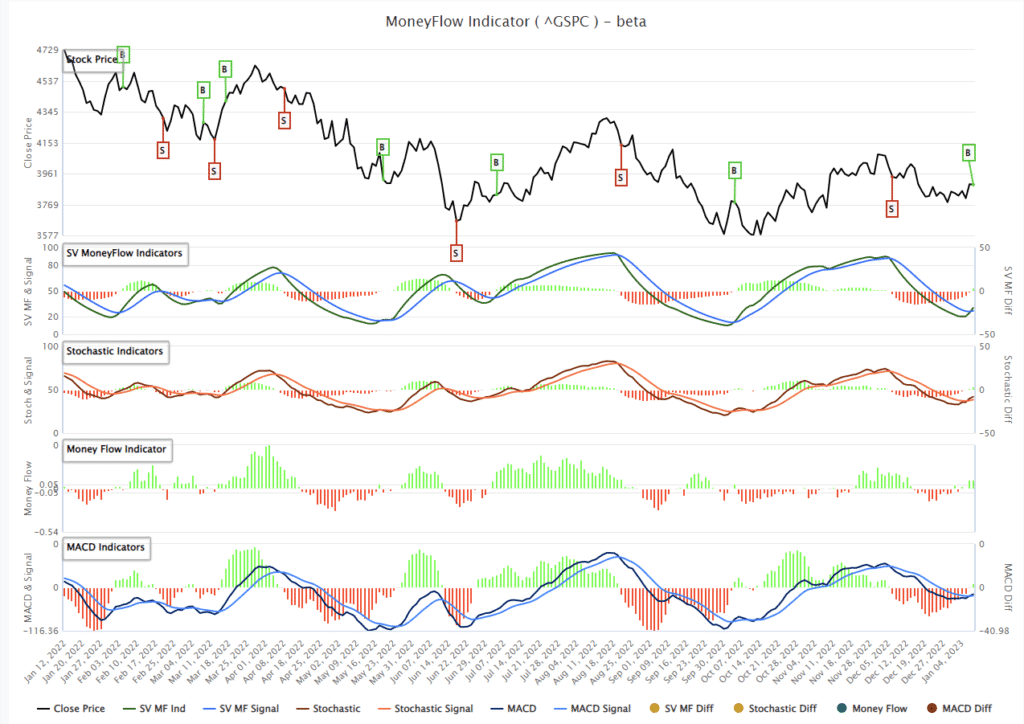
Market Trading Update
The market rallied out of the gate yesterday but gave it all up, keeping the markets below the resistance cluster at 3900. While the MACD “buy signal” and our money flow indicator has triggered, we are sitting tight until after Jerome Powell’s speech today. We suspect that he will reiterate his hawkish stance, which could pressure asset prices after the recent run higher. Once that is behind us, we should potentially be able to add some selective exposure. While the technicals suggest we could see some higher prices short-term, there are still bearish dynamics at play which could limit rallies for now. Trade accordingly.
What’s Hot and What’s Not
Over the last few months, SimpleVisor introduced a set of proprietary tools that we use in conjunction with other tools to make portfolio decisions. These technical tools help us view the market and its underlying sectors and stocks in a unique light, providing us with a unique advantage.
Our relative analysis tool uses 13 technical measures to create a score based on the price ratio of sectors or stocks versus the S&P 500. SimpleVisor charts highlight which stocks or sectors are over or underperforming versus the market. This analysis, in conjunction with other technical analyses, allows us to decipher if a stock or sector is continually over or underperforming or if the relationship is due for a change.
Our absolute analysis uses the same 13 technical studies and scores sector and stock prices solely on their prices. Similarly, we can see which stocks or sectors are hot and which are not, and which might be due for a trend change.
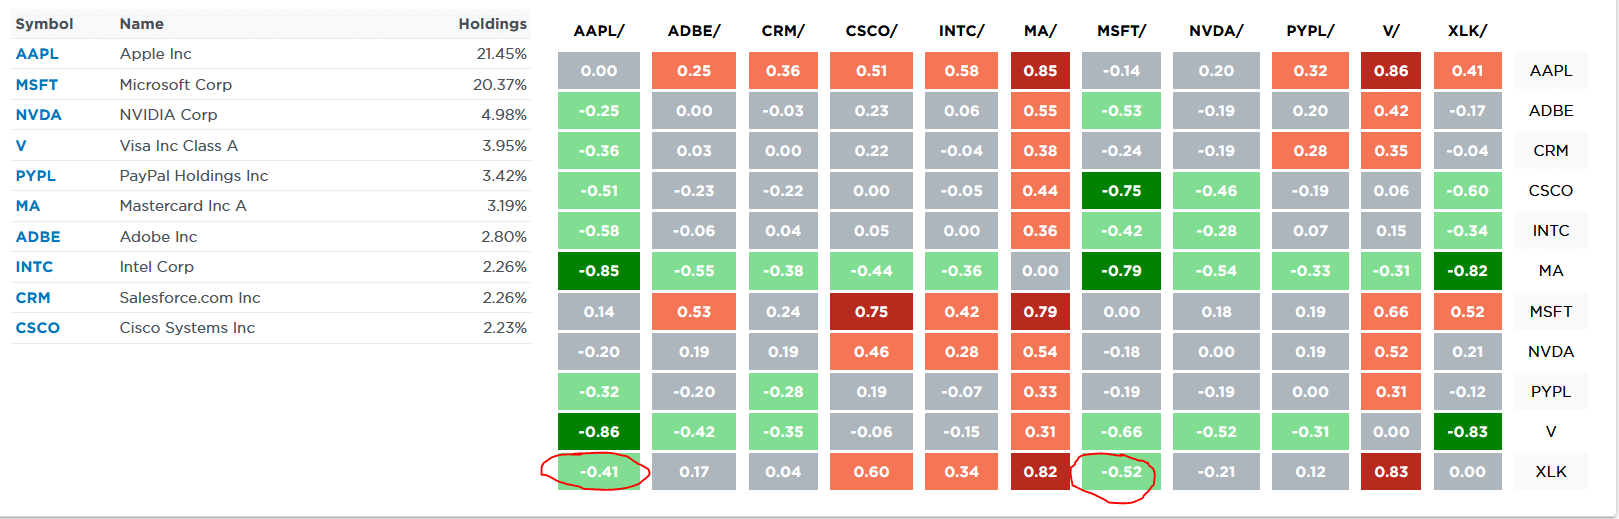
The first SimpleVisor graph combines the two analyses for each sector. Nine of the twelve sectors have a positive relative score versus the S&P 500. XLY and XLK are the only sectors underperforming the S&P 500 on an absolute and relative basis. What is going on? Simply, the index’s most prominent holdings (AAPL, MSFT, AMZN, and TSLA) are performing poorly. To better highlight the problem, the second table breaks out the ten largest holdings of XLK. The table allows relative comparison against each other and XLK. As circled, Apple and Microsoft are the most oversold. Visa and Mastercard are the most overbought. Therefore, the takeaway is that a few stocks are having an outsized effect on the sector. Given the index’s weighting, if one looks below the top holdings of the sector, one may find an opportunity.

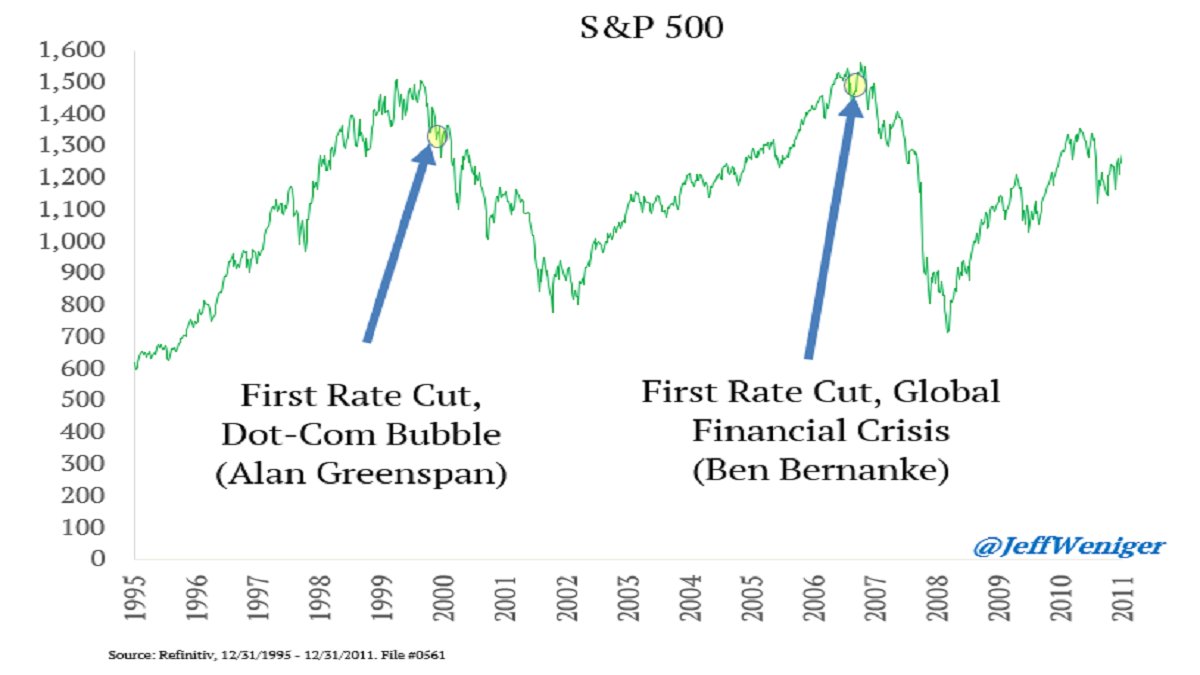
A Pivot May not be Good News
The graph below from Jeff Weniger supports our view that a Fed pivot may not be the excellent news equity investors are currently making it out to be. As it shows, the first rate cut in 2000 was just after the dot com bubble peak. In 2007, the market initially cheered the rate cut and recorded a new high. As the graph shows, the jolt higher was a massive trap for bullish investors. As we share in the opening section on HOPE, inflation is today’s Fed worry, but a recession is likely tomorrow’s.

0dte Options Are Generating Significant Volatility
Recently, we have made note of the enormous amount of same-day expiration options (0dte- zero days til expiration) being traded. These are extremely short-term bets on the market. The amount of these bets is often at its highest in the hours before an economic release that could move the market. For instance, last Friday, the number of 0dte calls hit record levels before the employment report. Currently, there is light 0dte volume. Tier 1 Alpha shares its thoughts on what might be going on.
A similar pattern to Friday with a dearth of 0dte option volume and relatively broad bands of strikes. Our hypothesis is that people are saving their hedging budgets for Thursday’s CPI. This suggests that surprises in economic data run the risk of moving the markets meaningfully.
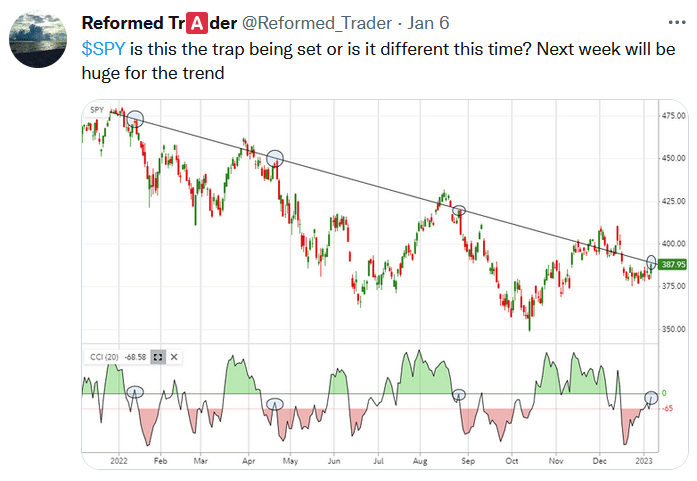
Tweet of the Day
Please subscribe to the daily commentary to receive these updates every morning before the opening bell.
If you found this blog useful, please send it to someone else, share it on social media, or contact us to set up a meeting.