


The headlines surrounding the SpaceX IPO seem mainly focused on how high the stock will go. There is a more important question stemming from the SpaceX IPO and other large deals that few seem to be asking: where will the money come from?
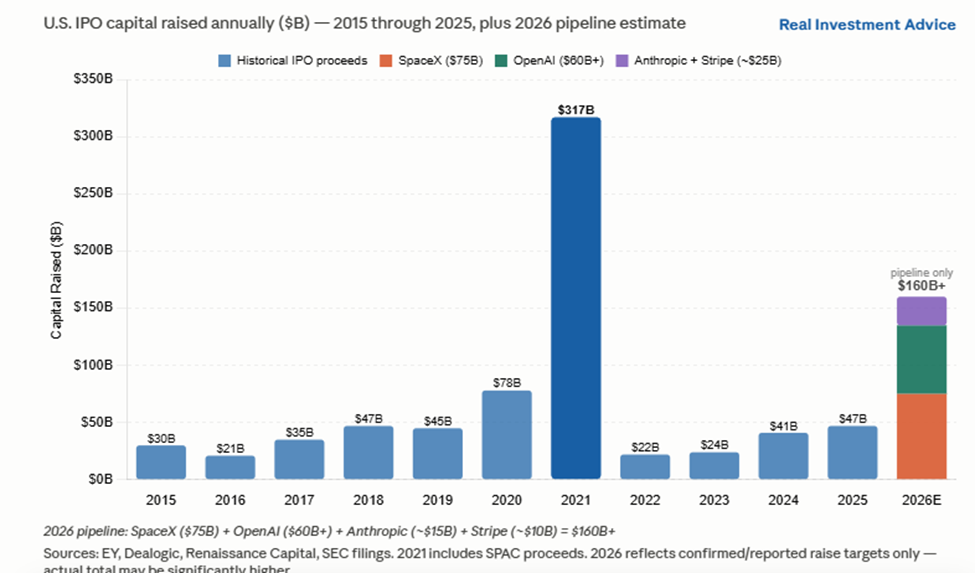
SpaceX is targeting a $1.75-$2.00 trillion valuation and a capital raise of up to $75 billion. Anthropic, OpenAI, and Stripe are expected to follow in the coming months, bringing the total 2026 IPO capital raise to approximately $160 billion. As we share below, that is larger than the last four years of IPO issuance combined. Before the pandemic, the US IPO market raised roughly $30 billion a year.
The capital for the IPOs primarily comes from institutional investors, retail investors, and foreign capital. In each case, something already owned gets sold to fund the new IPO purchase. The total dollars in the system do not disappear; they are spread more thinly across a larger number of holdings.
The impact of these large IPOs will be more significant than usual because they will be included in the major indexes shortly after the IPOs. Passive funds are required to buy every index constituent in proportion to its weight. SpaceX, Anthropic, and OpenAI combined valuations could be nearly $4 trillion, which would represent a similar index weight as Apple, currently the second-largest holding in the S&P 500. Every dollar of IPO buying is a dollar of forced selling, and the index rule changes to speed up index inclusion for these IPOs mean this impact is coming sooner than most investors expect.
We will have a lot more detail on this topic in a longer blog article next week.
What To Watch Today
Earnings
- No earnings releases today.
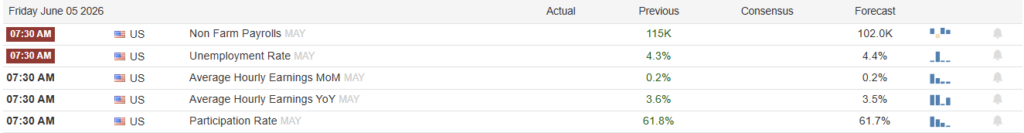
Economy
Market Trading Update
Yesterday, we discussed the technical backdrop of the market, and while there are clear risks, the market keeps pushing higher. While there’s a version of this market that’s healthy, there is also a dangerous one. Right now we’re getting both at once. A column making the rounds this week lays it out cleanly. Forward earnings are screaming higher on the AI capex boom, and that optimism is real enough to show up in hard data, not just sentiment. Jobs, hours worked, and the April JOLTS surprise. When earnings expectations accelerate alongside improving leading indicators, you typically get a genuine cyclical upturn. I don’t dispute that part.
Here’s the problem. The ascent isn’t being powered solely by cash flows. It’s being powered by borrowed money. Dealer balance-sheet exposure to equities through total return swaps has tripled in two years, and the cost of renting that balance sheet keeps falling even as demand climbs. Stack a record options gamma chase on top, where dealers buy into strength to hedge, and you’ve built a melt-up on a brittle frame. Make no mistake, I have warned about this risk before. Leverage doesn’t create the trend. It exaggerates it in both directions.
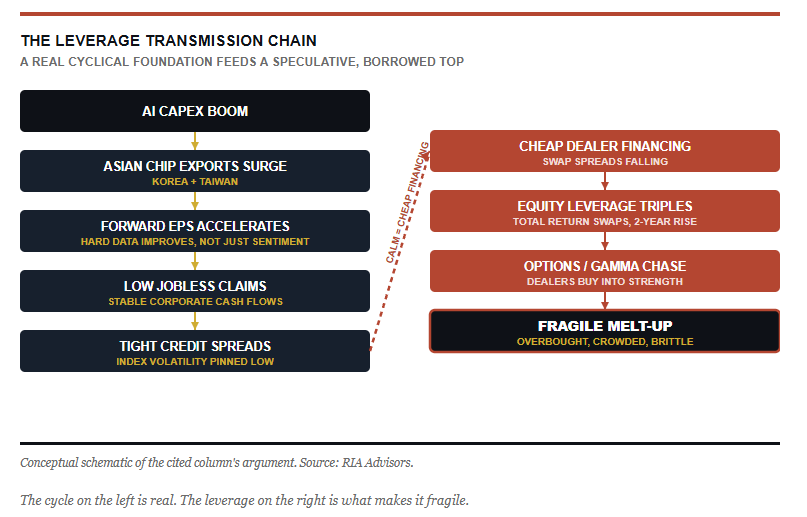
So why hasn’t it cracked? Follow the cash flows. Jobless claims across nearly every state sit low, corporate cash flows stay stable, credit spreads stay tight, and index volatility stays pinned to the floor while calm spreads keep dealers happy to extend yet more financing into the same crowded trade. That feedback loop is the whole story. Leverage doesn’t create the trend. It exaggerates it in both directions.
The risk isn’t the economy. It’s the positioning. Overbought, crowded into a handful of names, and stuffed with speculative call options. That’s a positioning accident waiting for a catalyst. The fragile top has to come off first, and it rarely comes off politely. A double-digit correction wouldn’t surprise me, and it wouldn’t invalidate the cyclical story sitting underneath it.

So how do we trade it? Stay invested, but stop paying up for the speculative tail. The move I’d make is to
- Trim the most extended winners back toward the target weight
- Raise a modest cash buffer, not to time the top but to hold dry powder for when the leverage finally unwinds.
- Keep your hedges on while volatility is still cheap.
- Don’t chase the gamma.
The durable rally is the prize, and you earn it by surviving the part that breaks first.
The bottom line is simple. Own the cycle, rent the speculation, and never confuse the two.

Municipal Math
We have had a few questions about how to assess municipal bonds relative to US Treasury and corporate bonds. As with corporate and Treasury bonds, liquidity, credit quality, and yield are important considerations for municipal bond investors.
Due to the sheer number of bond issues across thousands of municipal jurisdictions and their relatively small sizes, liquidity is often worse than that of US Treasury bonds and most corporate bonds. If you are buying and holding a municipal bond until it matures, that will not matter. But if you need to sell a municipal bond, you will receive a lower price than the bond is trading at. This bid/offer spread can vary widely depending on several factors.
The major credit rating agencies rate most municipal bonds using the same alphabetical rating system as they do for all other bonds. Like with corporate bonds, the rating agencies can be slow to detect credit deterioration. Thus, we recommend comparing yields on similarly rated municipal bonds. The bond market often prices in potential credit issues before rating agencies do. Bear in mind that liquidity differences can also cause yield discrepancies between bonds with similar maturities.
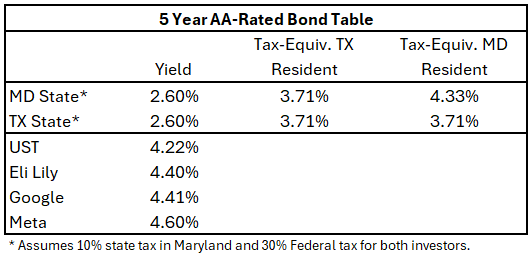
Yield is often the deciding factor for many bond buyers. Municipal yields are low because most municipal bonds are federally and state tax-exempt. To equate the yield on a municipal bond to a competing UST or corporate bond, you must divide the municipal bond yield by one minus your federal and state tax rates. The table below shows how a Maryland resident, assuming a 10% state income tax, might view a bond very differently from a Texas resident with no state income tax. Also shown in the table are competing corporate and UST, AA-rated five-year bonds. As it shows, yield spreads are very compressed for many municipal bonds.

Tweet of the Day

New UPDATED Trading Rules With Desktop Printout
“Want to achieve better long-term success in managing your portfolio? Here are our 15-trading rules for managing market risks.”
Please subscribe to the daily commentary to receive these updates every morning before the opening bell.
If you found this blog useful, please send it to someone else, share it on social media, or contact us to set up a meeting.