


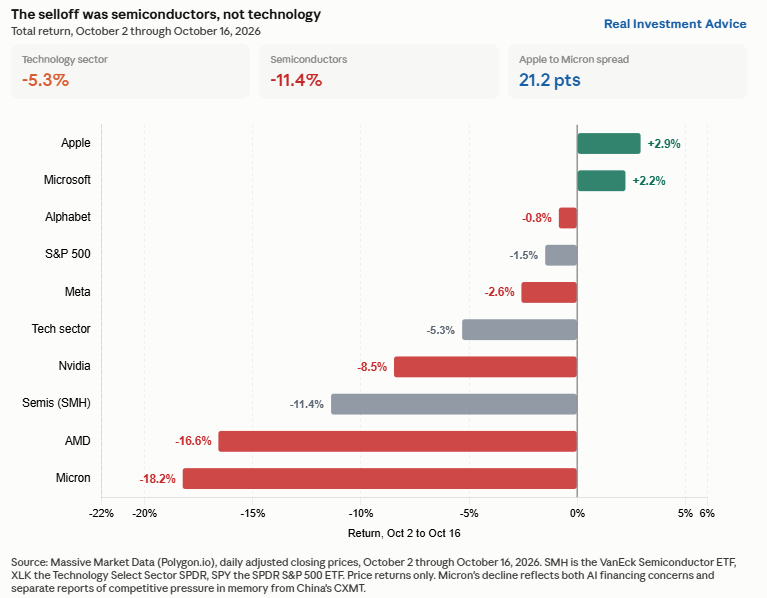
The technology sector (XLK) fell 5.3% over the past two weeks, but that figure is misleading. Two of its largest members, Apple and Microsoft, rose by 2%+ over the period, and Google and Meta kept pace with the S&P 500’s 1.5% decline. The damage in the technology sector was mainly in semiconductors, with the SOX semiconductor index falling more than 11%. Within the index, Nvidia fell 8.5%, AMD fell 16.6%, and Micron fell 18.2%. A 21-point performance spread separates Apple from Micron despite both being in the same sector.
The concern weighing on semiconductors is increasing funding difficulties for customers such as CoreWeave and Oracle. Neither Apple nor Microsoft depends on a data center operator raising debt to fund GPU purchases. Micron and AMD do. When CoreWeave’s bonds surged to a 15% yield, and its shares fell another 12% Friday, the market repricing fell on companies that supply the AI hardware, not on the companies that sell AI services. Nvidia sits in between, which is roughly where its 8.5% decline landed.
It’s worth noting that Micron’s drop is in part due to financing concerns, but also on reports that China’s CXMT is closing the gap in memory.
Calling this a broad-based technology correction may not be the best market read. The market is distinguishing between companies whose revenue depends on debt-financed infrastructure and companies whose revenue does not. As seen below, as you move down the two-week performance graph to the AI capital spending cycle — consumer hardware, then software, then advertising, then the sector average, then the chips themselves. The market seems to have sorted these companies by exposure to debt-financed data center construction.
What To Watch Today
Earnings
Economy
Market Trading Update
Yesterday, we discussed how last week’s sell-off in AI-adjacent technology was a rotation rather than a liquidation, with the S&P 500 slipping below its 50-day moving average for the first time since September 30. Today, I want to look at the market breadth reversal underneath that damage and ask whether it sets up a better run into year-end.
Start with the carnage. The Nasdaq 100 lost roughly 5.5% last week, its worst week since the April 2025 tariff shock.
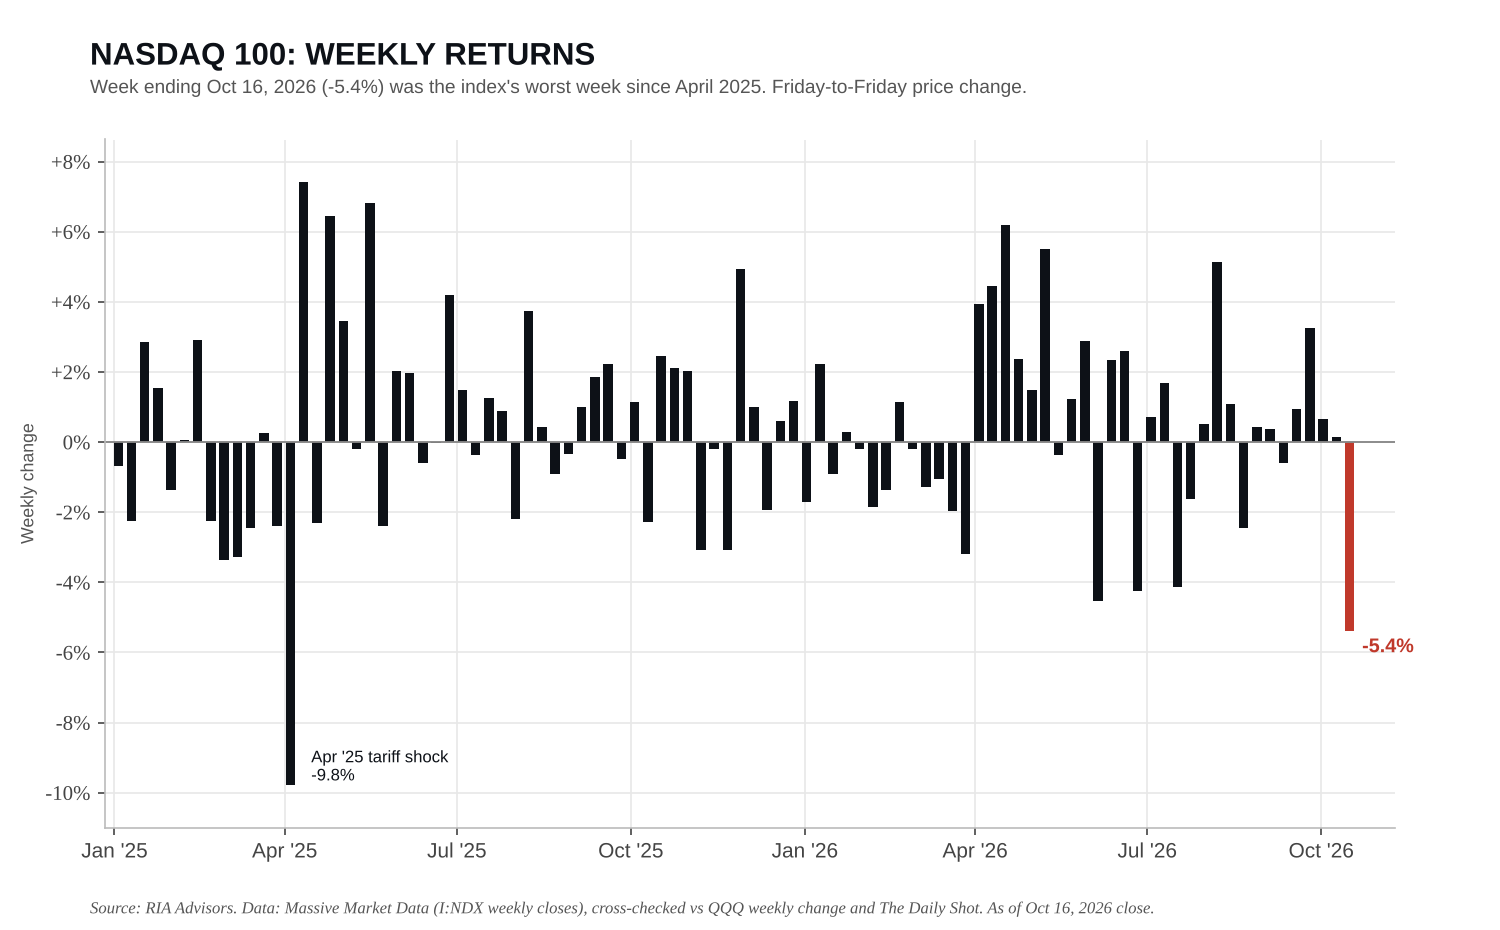
Yet the equal-weight S&P 500 gained 0.5% while the cap-weighted index fell 2%. The equal-weight to cap-weight ratio rose for five straight sessions, climbing about 2.5% off its lowest reading in two years.
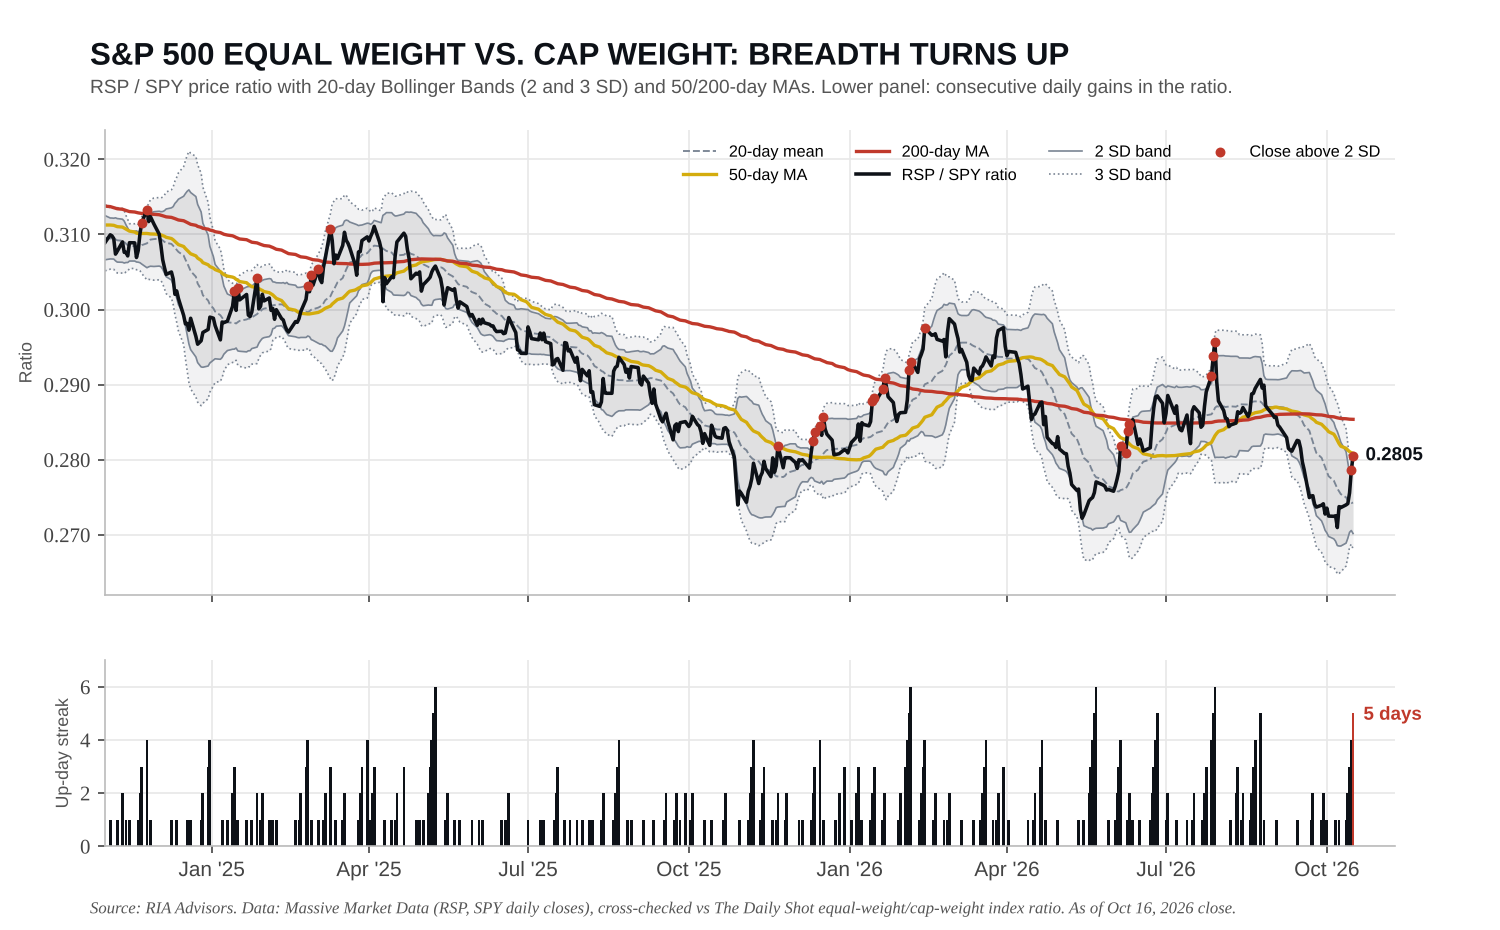
That is NOT what a bear market looks like. Money left the crowded megacaps and flowed into the other 490 stocks. Bob Farrell’s Rule #7 says markets are strongest when they are broad and weakest when they narrow to a handful of blue-chip names. For most of 2026, we’ve had the narrow version. Such is the difference between a correction in leadership and a correction in the market.
The McClellan Oscillator confirms the shift. On October 15, it crossed above +60 with the S&P 500 within 5% of its record high. Bluekurtic found 13 prior first crossovers since 1999 under those conditions. A month later, the index was higher 11 times, with a median gain of 2.8%. The average drawdown inside that month was 2.1%, and the worst was 7.5% in October 2020.
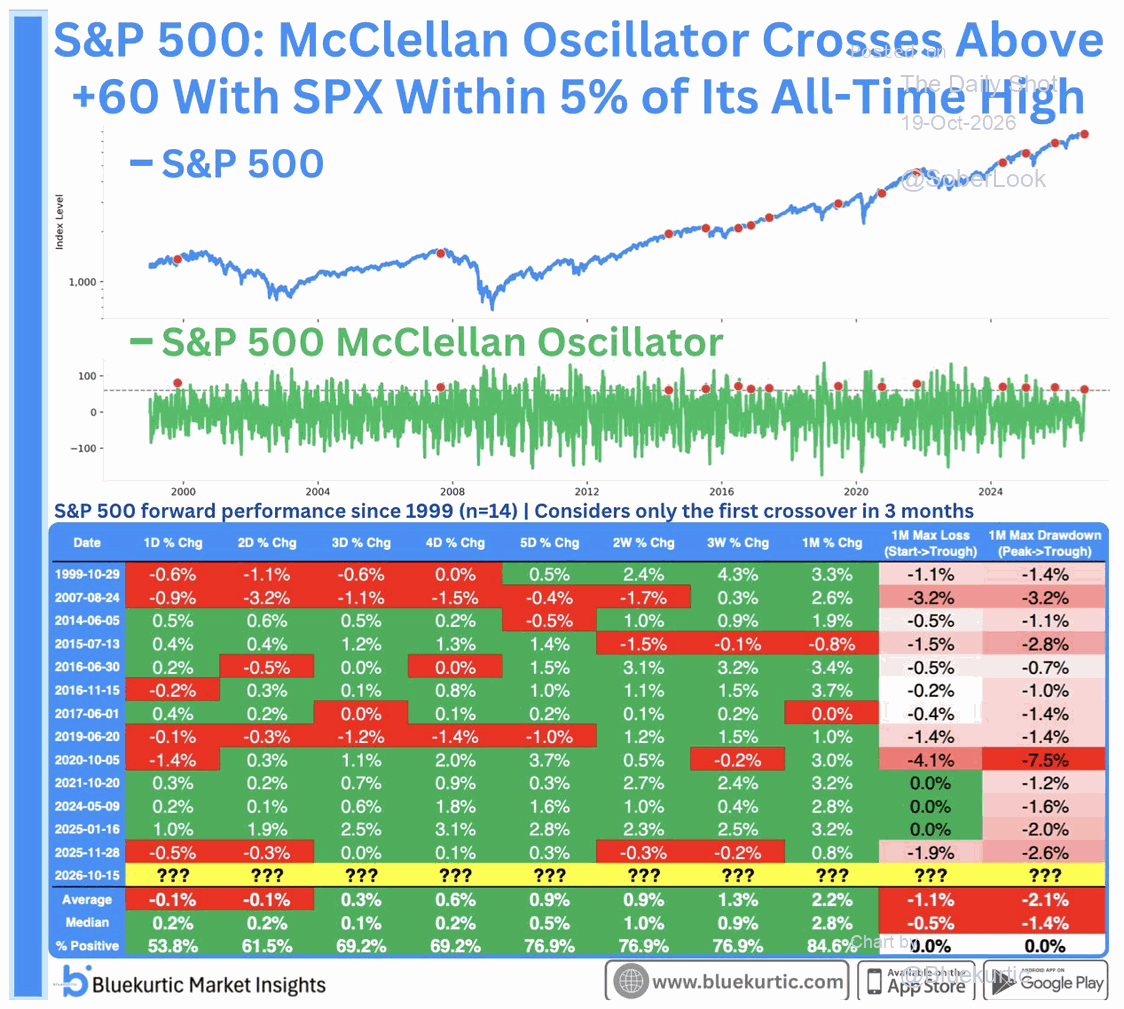
Notice the first few days are a coin flip. Friday’s 1.1% drop, one session after the signal, fits that pattern. Breadth thrusts tend to pay over weeks, not days.
The bear in the back of the room will note that 13 observations are a thin sample, and he has a point. The tape still has to clear mega-cap earnings and the October 28 FOMC decision. Even so, a rally carried by “everything else” is healthier than one that depends on a few AI names priced for perfection. The rotation drained the most crowded trade without breaking the broader market, and that is a better setup into year-end than the one we had three weeks ago.
But the S&P 500 closed Friday at 7,659, below its 50-day average near 7,712 and 2% under the October 6 record close of 7,818.93. Until the index reclaims that line, the “better setup” is a probability, not a fact.
Here’s what we’re doing. Across our models, we’re holding technology at its target weight in earnings and not chasing a reflexive bounce in semis. Use strength in the megacaps to rebalance toward the sectors now participating. The line in the sand is 7,567, the September 16 low. A close below it means raising cash and adding hedges. Above it, the breadth data argues for staying invested.
Narrow markets eventually send the bill.

Two Weeks Have Changed The Map
What a difference two weeks makes. Two weeks ago in our Daily Commentary we wrote the following:
As we have noted, this extreme negative correlation and dispersion will not last; however, it may take lower yields to force a rotation in the stock market.
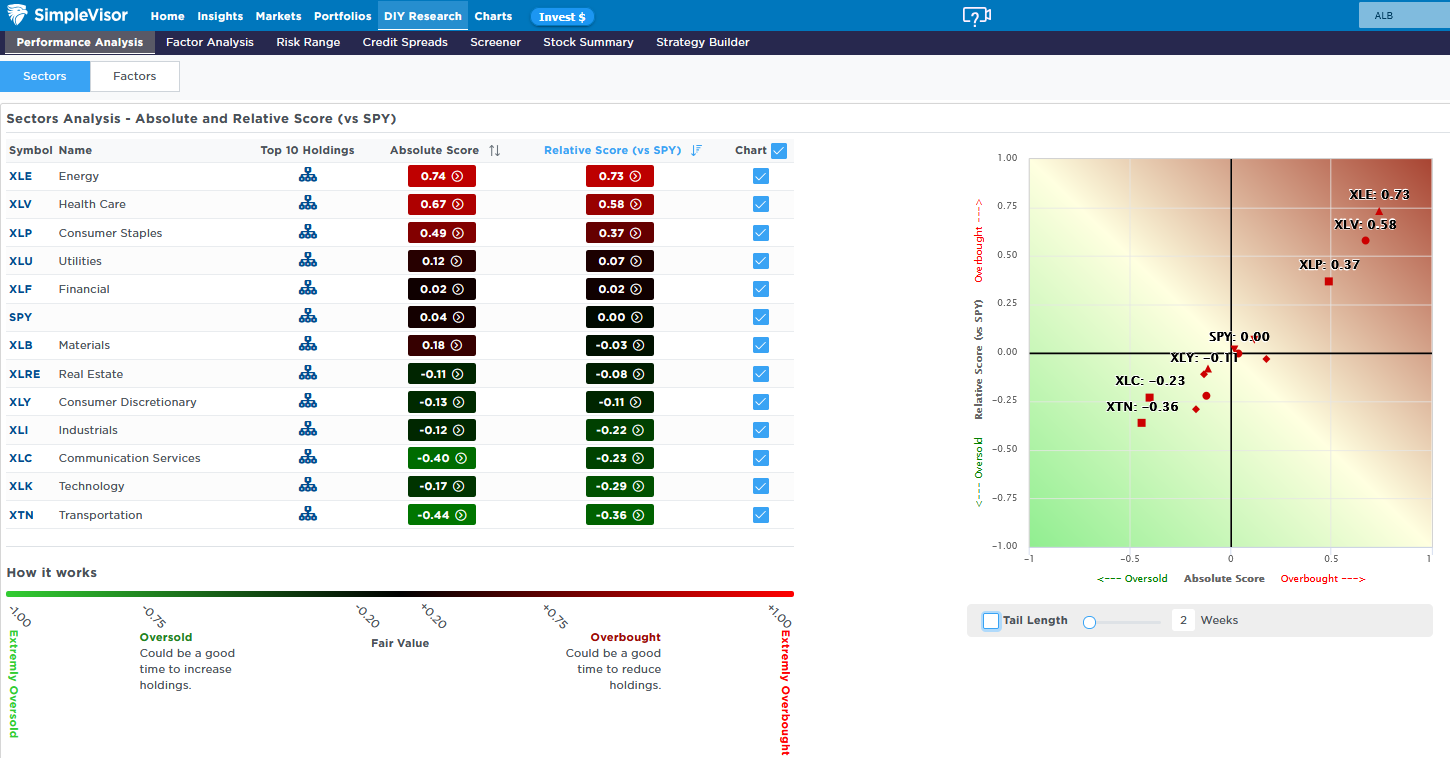
At the time, the staples, REIT, and utilities sectors, among others, were deeply oversold while the technology sector was extremely overbought. The ten-year UST yield peaked at 5.34% the day prior to the Commentary. Since then, the yield has fallen 25 basis points; as we share below, staples and healthcare stocks are overbought, many other underperforming sectors have moved toward fair value, and technology is now the second most oversold sector. Lower yields certainly drove the rotation, but renewed concerns about AI-related capex funding are feeding the shift toward equity safety.
Understanding which stocks are leading and lagging helps us know what to watch for over the next few weeks. For starters, earnings, especially for the large technology stocks and their associated guidance and commentary, will be critical. Do they acknowledge investors’ worries, or do they remain extremely optimistic? Second is the Fed. The market does not expect a rate hike next week. If the Fed bucks the market forecast, how will that impact yields and ultimately the recent outperforming stocks? Importantly, how does the Fed characterize its policy stance, and what does that imply for future policy?
AI Capex And Earnings: What Happens When Growth Slows
When a hyperscaler commits $10 billion to a data center, that money doesn’t vanish into a building. It goes to chip designers and memory makers, to the firms making transformers and cooling systems, and to contractors, electricians, and the local utility. Every one of them books it as “revenue.” Then their suppliers book revenue from them.
Jerome Levy worked this out early in the last century, and Michal Kalecki formalized it in the 1930s. For the economy as a whole, profits equal investment, minus household, government, and foreign saving, plus dividends.2 I’ve written about the Kalecki profit equation and the coming reversion before, mostly around deficit spending. Investment sits on the same side of that equation.
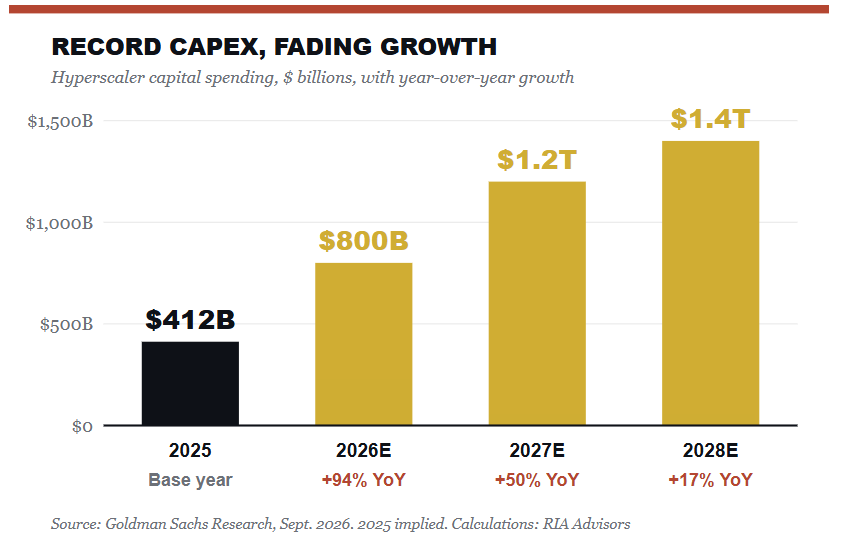
Here’s where it gets interesting. The seller books the revenue immediately. The buyer capitalizes the purchase and expenses it through depreciation over five or six years. In the year the money is spent, the economy records the supplier’s profit without recording the buyer’s expense. Such is why a capex boom is the most earnings-friendly event in the short run, and why I called it a “golden window” when I wrote about AI capex depreciation risk and record earnings in July.
The cycle runs in three stages. Rising spending lifts supplier revenue, margins and hiring. Flat spending freezes supplier revenue while the buyers’ depreciation keeps climbing, because every dollar that was “free” in year one starts showing up as an expense in years two through six, which is usually when the market has stopped paying attention. Falling spending turns it all into a drag. Only the first stage is fun.

Tweet of the Day
Trading Rules With Desktop Printout
“Want to achieve better long-term success in managing your portfolio? Here are our 15-trading rules for managing market risks.”
Please subscribe to the daily commentary to receive these updates every morning before the opening bell.
If you found this blog useful, please send it to someone else, share it on social media, or contact us to set up a meeting.