


Inside This Week’s Bull Bear Report
- The Narratives Change. Markets Don’t.
- How We Are Trading It
- Research Report – Ray Dalio & The Coming Financial Crisis
- YouTube – Before The Bell
- Market Statistics
- Stock Screens
- Portfolio Trades This Week
A Successful Test
Last week, we discussed how this seems to be an “unstoppable” bull market. However, that doesn’t mean markets won’t pause before attempting to move higher. As we noted last week, the consolidation was expected.
“Even with Bessent’s comments, that market remains overbought in the short term, and a further consolidation process is likely to occur next week. At the end of this week, we removed our short-market hedge, added to bonds, and reduced equity exposure. If the market is going to consolidate, we can allow cash to act as the primary hedge. However, if the 200-DMA is violated, the 50-DMA will become the next critical support. From a bullish perspective, the 20 and 50-DMAs are now sloping positively, which should provide rising support levels. Overall, we suspect that the market will stabilize. Of course, there are always risks to be aware of, so increased cash levels are essential now.”
Most notably, this past week was the successful test of the 200-DMA. The pullback to that previous broken resistance level and subsequent bounce highly suggests that the April correction is complete and that market control returns to the Bulls. As such, there is very little resistance between current levels and all-time highs. However, as noted last week, with the markets still overbought on a momentum basis, further consolidation will be unsurprising before an advance to new highs occurs. With the MACD sell signal triggered and money flows declining, another test of the 200-DMA next week would be unsurprising.

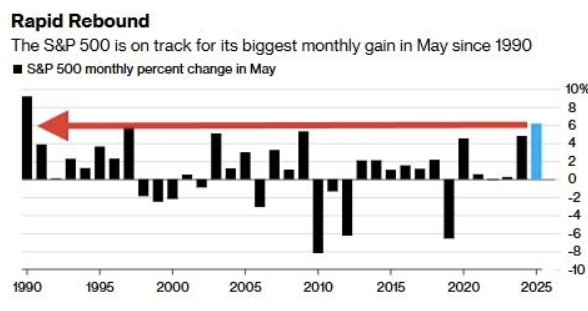
Interestingly, the old saying “April Showers Bring May Flowers ” seems apropos, as the tariff-driven sell-off in April sprouted a very strong May advance. Notably, the S&P 500 had its best month of May since 1990.
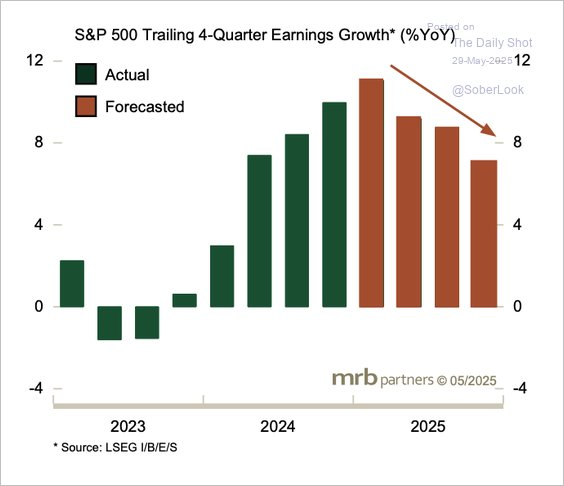
However, as noted above, with the market short-term overbought and very bullish, we should expect the market to “struggle” somewhat in June as corporate share buybacks subside and companies go into blackout before Q2 earnings season begins. Furthermore, we have often stated that earnings remain overly optimistic, which concerns markets moving forward. According to MRB Partners, the Q1 earnings season is expected to be the peak for the earnings growth cycle. Given the high correlation between forward earnings estimates and market returns, this commentary should not be readily dismissed.
That said, investors must be most careful of “market narratives.” These narratives can potentially be far more harmful than helpful to investors who get swept up in the emotions generated by headline-grabbing rationalizations. Such is the topic for this week’s #BullBearReport.
Need Help With Your Investing Strategy?
Are you looking for complete financial, insurance, and estate planning? Need a risk-managed portfolio management strategy to grow and protect your savings? Whatever your needs are, we are here to help.

The Psychology Of The Narrative
How fast market narratives change to fit a particular position is always interesting. This is particularly true for podcasts and media outlets that depend on a “bearish” take to sell gold or to get clicks and views. For example, I googled interest rates and here is what I got:
- The Treasury Market Is On The Brink Of Collapse.
- US Economy Implodes: Bond Markets Panic
- Bond Vigilantes Voting Early.
- US Risks “Financial Disaster”
You get the idea, it’s all bad. Or, at least that is the narrative right now.
So, why is the narrative so important to investors? Because we are humans.
As humans, we inherently seek structure through rules, routines, and frameworks in nearly every domain of life. This craving for predictability offers a sense of control and security. Whether dieting, learning, or investing, we often believe that following the “right” system will produce the desired result.
Humans have an innate need to impose order on the chaos surrounding them. Nowhere is this more evident than in the stock market, where investors relentlessly seek patterns, explanations, and narratives to rationalize why markets rise and fall. It’s a fascinating dance between logic and emotion, predictability and randomness.
The stock market is a complex, ever-changing system driven by countless factors—corporate earnings, geopolitical events, interest rates, technological innovations, and, most critically, mass psychology. And yet, when faced with this swirling unpredictability, we instinctively reach for stories. Here is a good example. Headlines declare that stocks are rising “because” of strong GDP growth. That makes sense until you see a headline that states stocks are falling “because” of strong GDP growth, which might spark inflation.
They both can not be correct. However, analysts point to one data point, and we latch onto it, even though the narrative might flip tomorrow.
Why Bearish Narratives Hold More Power
The need for a narrative is deeply rooted in our psychology. As pattern-seeking creatures, we crave coherence and predictability. Chaos triggers anxiety. It feels dangerous, uncontrollable, and unsettling. In investing, this anxiety is magnified by the direct impact on our wealth and financial security. We regain a semblance of control by latching onto the narrative, no matter how tenuous. The narrative tells us why things are happening and what might happen next, which soothes our natural fear of uncertainty.
When this need for control is combined with our behavioral bias of “loss avoidance,” it is more evident why bearish narratives tend to be more popular than bullish ones. Why is “loss avoidance” crucial to understand?
“Loss aversion is a tendency in behavioral finance where investors are so fearful of losses that they focus on trying to avoid a loss more so than on making gains. The more one experiences losses, the more likely they are to become prone to loss aversion.” – Corporate Finance Institute

The reality is that humans are hardwired to prioritize negative information over optimistic information. From an evolutionary perspective, this bias was essential. Our ancestors learned to recognize threats (like predators) to survive. This instinct, known as “negativity bias,” influences how we process information, including financial news and market narratives. Such is why “bearish” leaning podcasts and articles generate the most clicks and views.
- Fear Is a Stronger Motivator Than Greed – While the hope of making money drives investors, the fear of losing money is far more powerful.
- Bearish Narratives Seem More “Rational” – Pessimism often feels safer and more cautious. During volatile markets, a bearish forecast can sound more analytical and responsible.
- Media Amplifies Negative Headlines – News outlets know that fear sells. Sensational headlines like “MARKETS IN TURMOIL” or “CRASH COMING?” generate clicks and engagement.
- Herd Behavior and Echo Chambers – When markets are shaky, investors flock to bearish opinions for validation. If others are cautious or fearful, it reinforces the idea that a downturn is imminent, even if underlying fundamentals remain sound. Social media and financial news create echo chambers that amplify these fears.
The Bond Auction Example
Here is a good example of narrative driving markets.
Recently, interest rates ticked up after headlines rang out that the 20-year bond auction was horrific, signaling that the U.S. debt market is on the verge of collapse. As Michael Lebowitz noted this past week:
“The bearish narratives were in overdrive after the Moody’s credit downgrade and the larger-than-expected “Big Beautiful” government spending bill. But narratives always need to be fed. The bearish bond narrative ate on May 21, 2025, with a Treasury 20-year auction deemed “terrible” and “horrible” by some pundits. Some interpreted the auction as an obvious sign that the Treasury was struggling to fund itself.
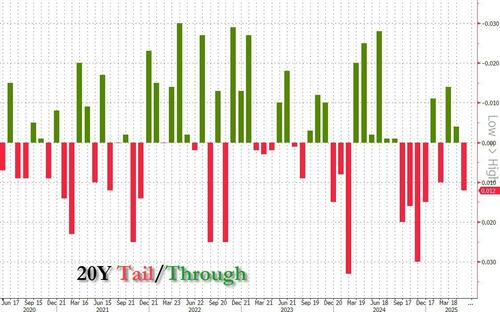
Some fear-mongers pointed out the “large” auction tail. The tail is the difference between the auction yield and the yield before the auction. A large tail can mean insufficient demand for the auctioned bonds. As the graph below shows, the recent red tail is not that abnormal. Moreover, the size of the tail is volatile in both directions. This is partly because the 20-year bond is not as widely regarded as a market benchmark as other maturities.“
The headlines were rampant that this “terrible, horrific auction” resulted from no one wanting to own U.S. Treasuries. However, that wasn’t true, as “indirect buyers” were allotted 82% of the auction bonds. These are primarily foreign central banks. So, foreign demand was strong despite the anti-dollar narrative claiming that central banks are selling US Treasuries in size.
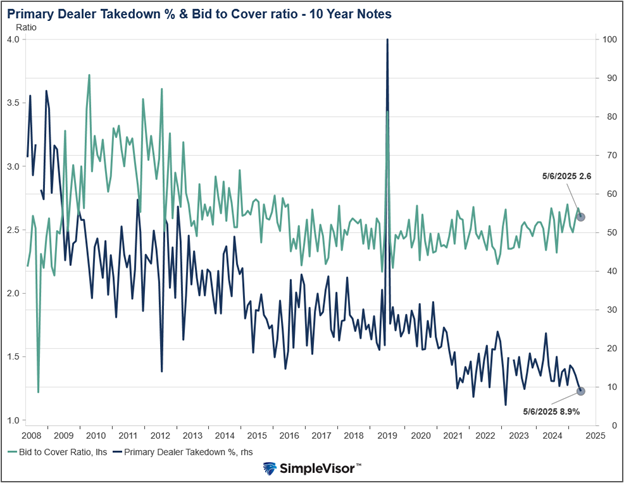
However, as Mike notes, just a week earlier, the 10-year auction, which was three times larger than the 20-year auction, was stellar.
“Primary dealers (direct bidders), the backstop for Treasury auctions, account for the third-lowest allotment since at least 2008 at 8.9%. This signifies that demand from other sources was robust. Second, there were bids for 2.6x as many bonds as were being auctioned. The average of the last six auctions was 2.4x. Furthermore, the ratio was at the high end of the range of the last ten-plus years.“
However, the “bearish media” overlooked the vastly more significant 10-year auction to focus on the 20-year auction, which fits their “narrative.”
So, is the narrative that the “deficit” will cause a debt collapse accurate? Or, is that just the latest “rationalization” to feed our “negativity bias?”
The History Of Rates And Deficits
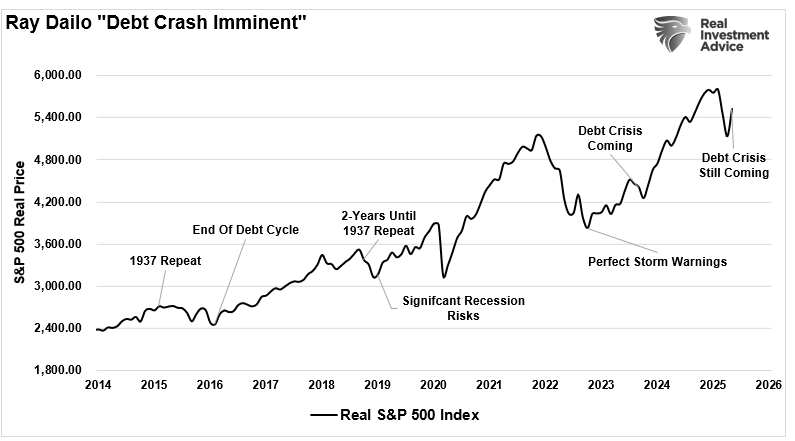
Yesterday, I published an in-depth article about Ray Dalio claiming the “deficit has become critical.”
” “It’s like … I’m a doctor, and I’m looking at the patient, and I’ve said, you’re having this accumulation, and I can tell you that this is very, very serious, and I can’t tell you the exact time. I would say that if we’re really looking over the next three years, to give or take a year or two, that we’re in that type of a critical, critical situation.”
Of course, the narrative would not be complete without a terrifying chart to back it up, like this from Deutsche Bank:
“Here we remind readers, that the Big, Beautiful Bill currently in Congress has been scored to add about $5 trillion to the debt, resulting in what we said would be “Debt Doomsday” for the US; this is simply a trade-off of short-term prosperity (a few extra trillion in the next 4 years) for long-term economic collapse (that 220% in long term debt.GDP).”

That is indeed scary. But as detailed in that article, he has been predicting this same crisis for more than a decade. For investors who listened to Dalio’s predictions of a coming “depression” a decade ago, they missed participating in one of the most significant bull markets in U.S. history.
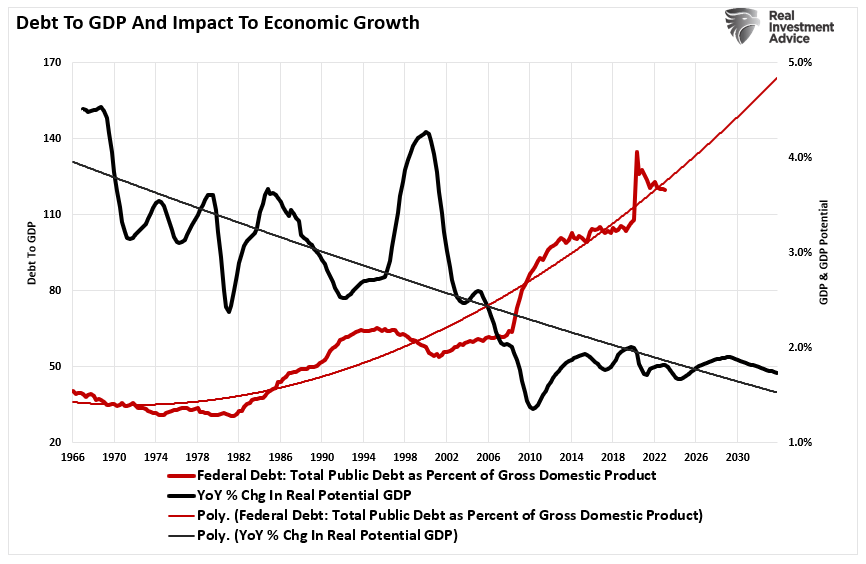
However, the facts show us that rising debts and deficits lead to lower interest rates, not higher. The reason is that debt diverts capital from productive uses into debt service. As such, economic growth slows. We can see this visually by comparing the Federal debt as a percentage of GDP to potential economic growth. Since government spending is primarily non-productive, it should be unsurprising that increases in debt do not foster more vigorous economic activity.
Where Dalio and other media bears are incorrect in their view is that the recent surge in inflation, and ultimately interest rates, was not a function of organic economic growth. It was a stimulus-driven surge in the supply/demand equation following the pandemic-driven shutdown. As those monetary and fiscal inflows reverse, that support is fading. In the future, we must understand the factors that drive rates over time: economic growth, wages, and inflation. Visually, we can create a composite index of GDP and inflation versus interest rates.

Given that interest rates (return on loaned capital) are derived from both economic activity (demand for credit) and inflation (future cost), the high correlation should be unsurprising.

Contrary to the recent barrage of bearish narratives, slowing economic growth lowers inflation (a function of supply and demand) and reduces rates.
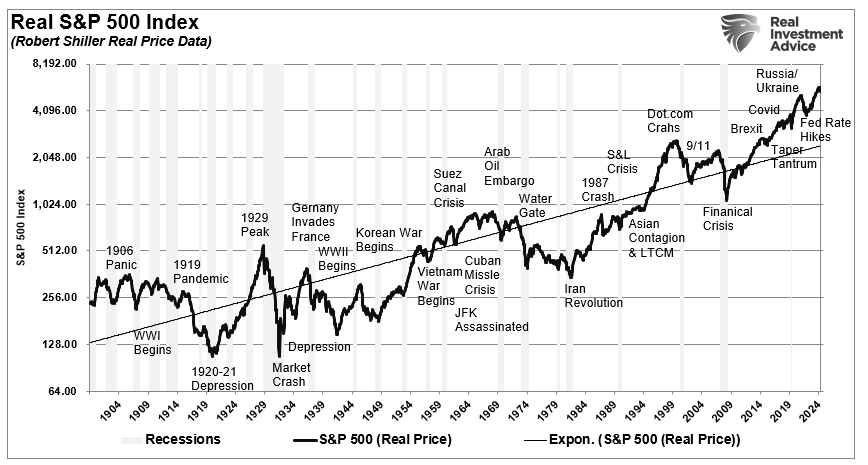
Markets Don’t Change
What is most important to investors is that the market absorbs all negative media narratives over the long term. The recent barrage of negative narratives surrounding debts, deficits, tariffs, inflation, wars, Trump, etc., is all just there to feed your negative bias. However, zooming out, investors who have stayed away from investing in the financial markets to “avoid the loss” of potential adverse outcomes have paid a dear price in reduced financial wealth.
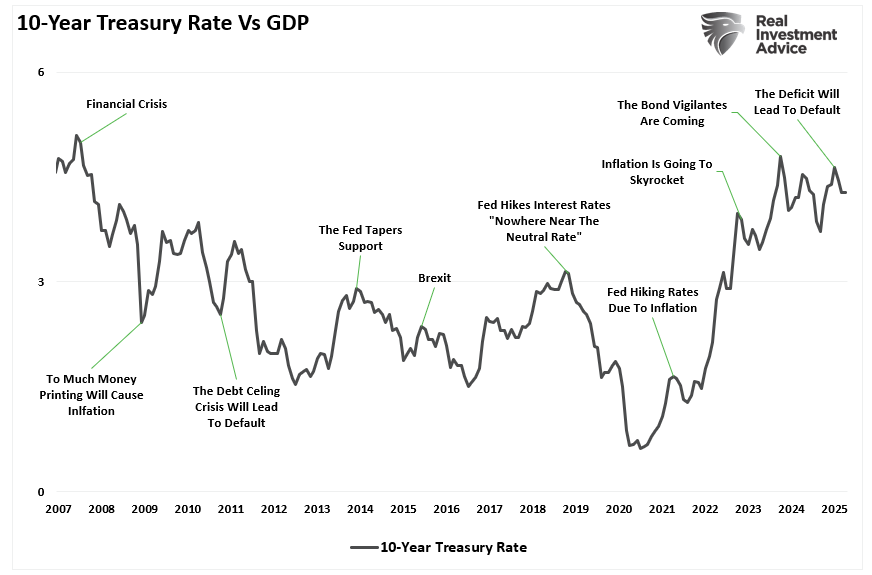
In other words, there is always a “reason” not to invest. However, the current narrative will change, but the market won’t. Here is a good example of how narratives change. Since 2007, interest rates have gyrated up and down. Currently, rates are still lower than in 2008, but have risen. What is essential is that each time rates went up, the “narrative” was always different. Yet, the US has been running ever-increasing deficits since 2008, but that was never the narrative…until now.
However, when it comes to investing, there have been periods of deep market declines. But those events didn’t occur overnight. There were always plenty of warning signs to help investors reduce risk and navigate those periods. However, even those who stayed invested fared far better than those who stayed out of the bull market advances in fear of the subsequent decline.
I am NOT saying you should passively stand there and let an eventual recessionary bear market or financial event wash over you. Investors can, and should, manage portfolio risk and navigate markets during uncertain times. However, most bearish narratives are like background noise in the investing world. There will always be a headline or analyst warning you to step aside. Sure, some of those concerns are valid. But reacting emotionally, selling everything, and going to cash often leads to missed opportunities.
Tips For Navigating The Narrative
Here are a few strategies I recommend to help investors navigate the constant drumbeat of pessimism:
🔎 1. Separate Signal from Noise
Bearish narratives are often based on isolated data points taken out of context. Look at the bigger picture:
- Instead of panicking over an inverted yield curve, examine credit conditions, corporate earnings, and consumer confidence.
- If markets correct, assess whether the underlying fundamentals of your investments have truly deteriorated or if it’s short-term volatility.
📊 2. Use a Disciplined Risk Management Framework
At RIA, we don’t ignore market risks—we manage them. That means:
- Rebalancing portfolios proactively. If markets have run hot, we trim positions back to targets. If we see opportunity amid panic, we increase exposure.
- Setting clear stop-loss levels. This protects gains and limits downside risk without making emotional decisions.
- Diversifying across asset classes to smooth returns during volatility.
💡 3. Lean into Value, Quality, and Dividends
When bearish narratives dominate, investors often abandon sound fundamentals. That’s when we lean into:
- Value-oriented stocks with strong balance sheets and consistent cash flows.
- Dividend payers that provide income during market turbulence.
- Quality companies that can weather economic downturns better than speculative plays.
🕰️ 4. Remember the Long Game
Bearish narratives may feel urgent, but markets are forward-looking. A well-structured, long-term portfolio can withstand temporary declines. Historically, those who stayed the course during volatility were better positioned for the eventual recovery.
Successful investing is not about beating some arbitrary “index.” It is about managing risk, preserving capital, and steadily compounding returns toward your goals. Ignore the noise, stay disciplined, and remember: no one hands out prizes for reckless investing—only consequences.
Continue to follow the rules and stick to your discipline. (Read our article on “What Is Risk” for a complete list of rules)

Feel free to reach out if you want to navigate these uncertain waters with expert guidance. Our team specializes in helping clients make informed decisions in today’s volatile markets.
Research Report
Subscribe To “Before The Bell” For Daily Trading Updates
We have set up a separate channel JUST for our short daily market updates. Please subscribe to THIS CHANNEL to receive daily notifications before the market opens.
Click Here And Then Click The SUBSCRIBE Button
Subscribe To Our YouTube Channel To Get Notified Of All Our Videos
Bull Bear Report Market Statistics & Screens

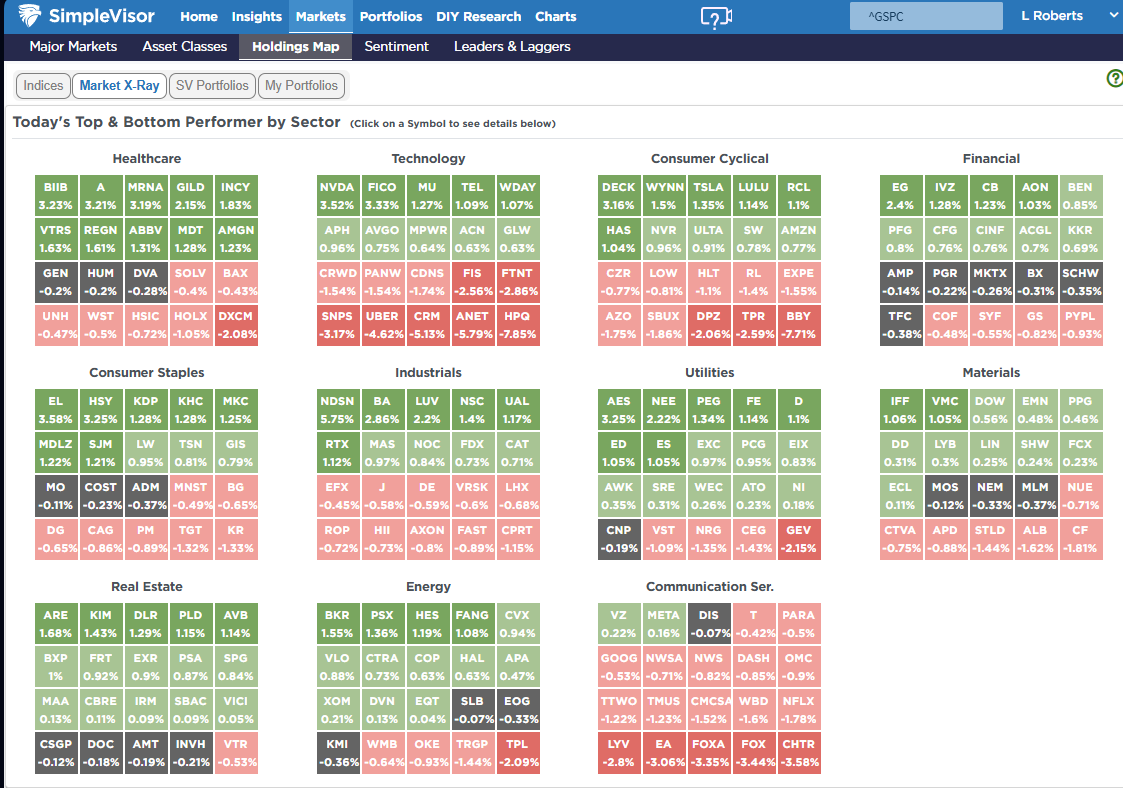
SimpleVisor Top & Bottom Performers By Sector
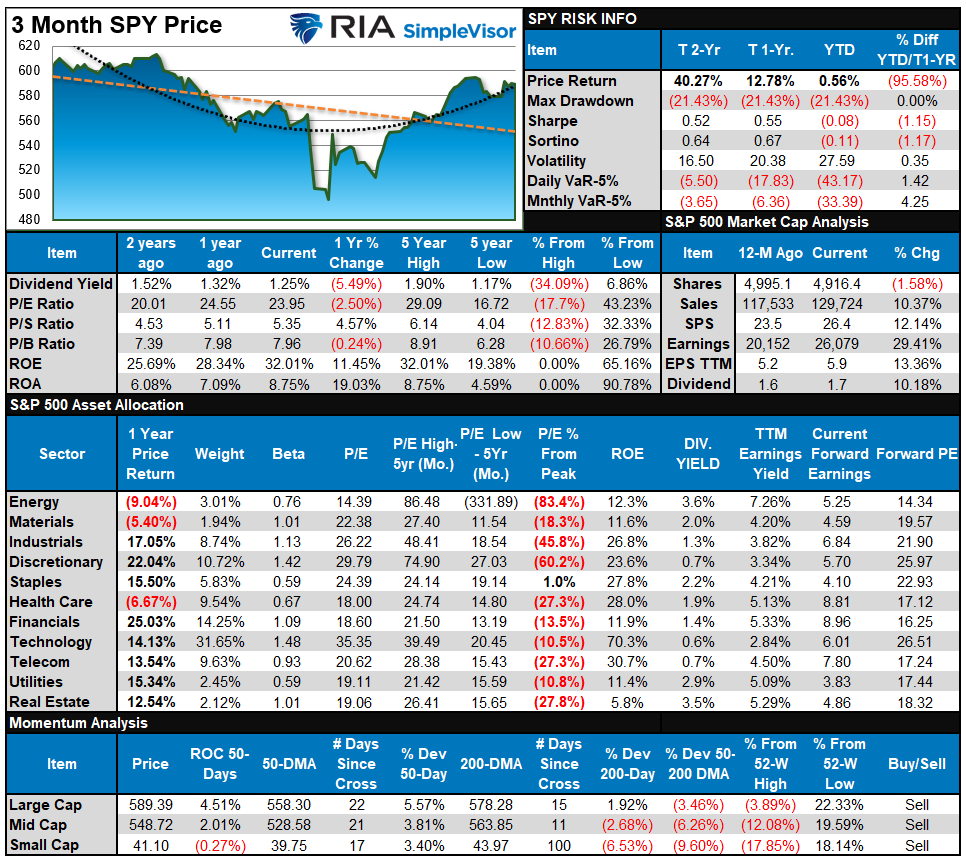
S&P 500 Weekly Tear Sheet
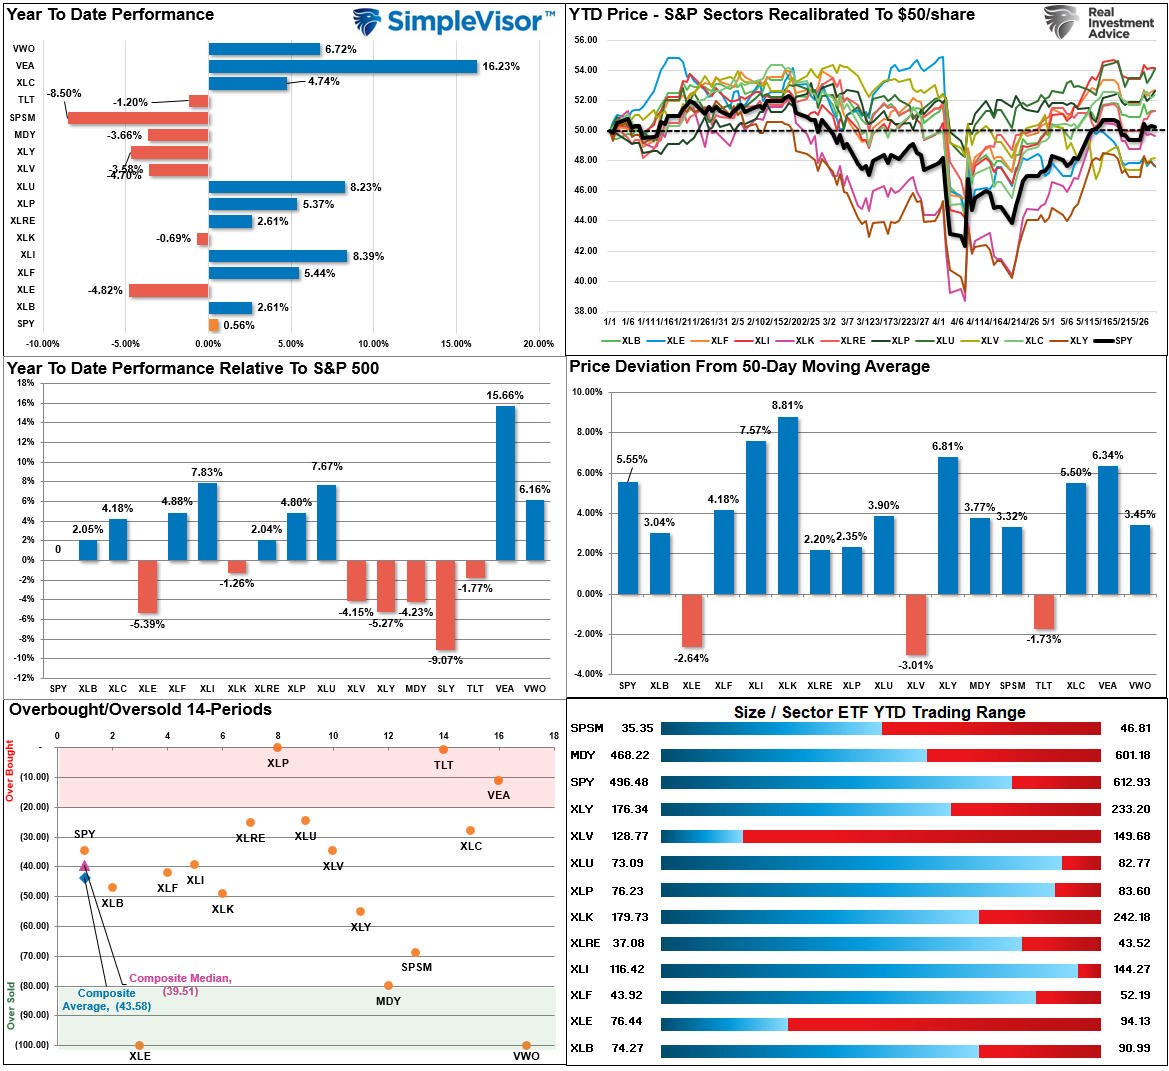
Relative Performance Analysis
Two weeks ago, we stated that “It is unlikely the market will be able to push much further without a short-term correction or consolidation to relieve some of that overbought condition. Take some profits, rebalance risks, and look for a pullback to reduce hedges and add exposures.”
Unsurprisingly, the market continues to trade range-bound as the previous overbought condition reverses. While the correction has been mild so far, there is still more work to do over the next week as we head into the seasonally weak period of June. Cash levels should be somewhat elevated, and equity risk should be rebalanced as we await the next oversold opportunity.
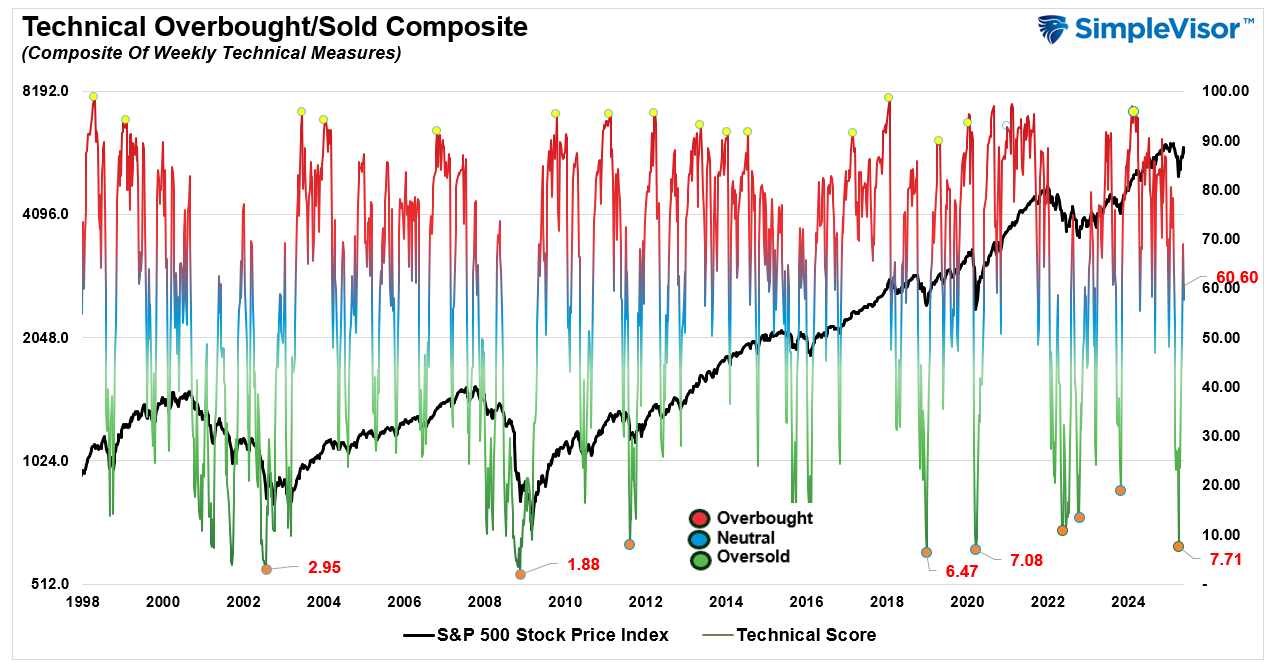
Technical Composite
The technical overbought/sold gauge comprises several price indicators (R.S.I., Williams %R, etc.), measured using “weekly” closing price data. Readings above “80” are considered overbought, and below “20” are oversold. The market peaks when those readings are 80 or above, suggesting prudent profit-taking and risk management. The best buying opportunities exist when those readings are 20 or below.
The current reading is 60.60 out of a possible 100.
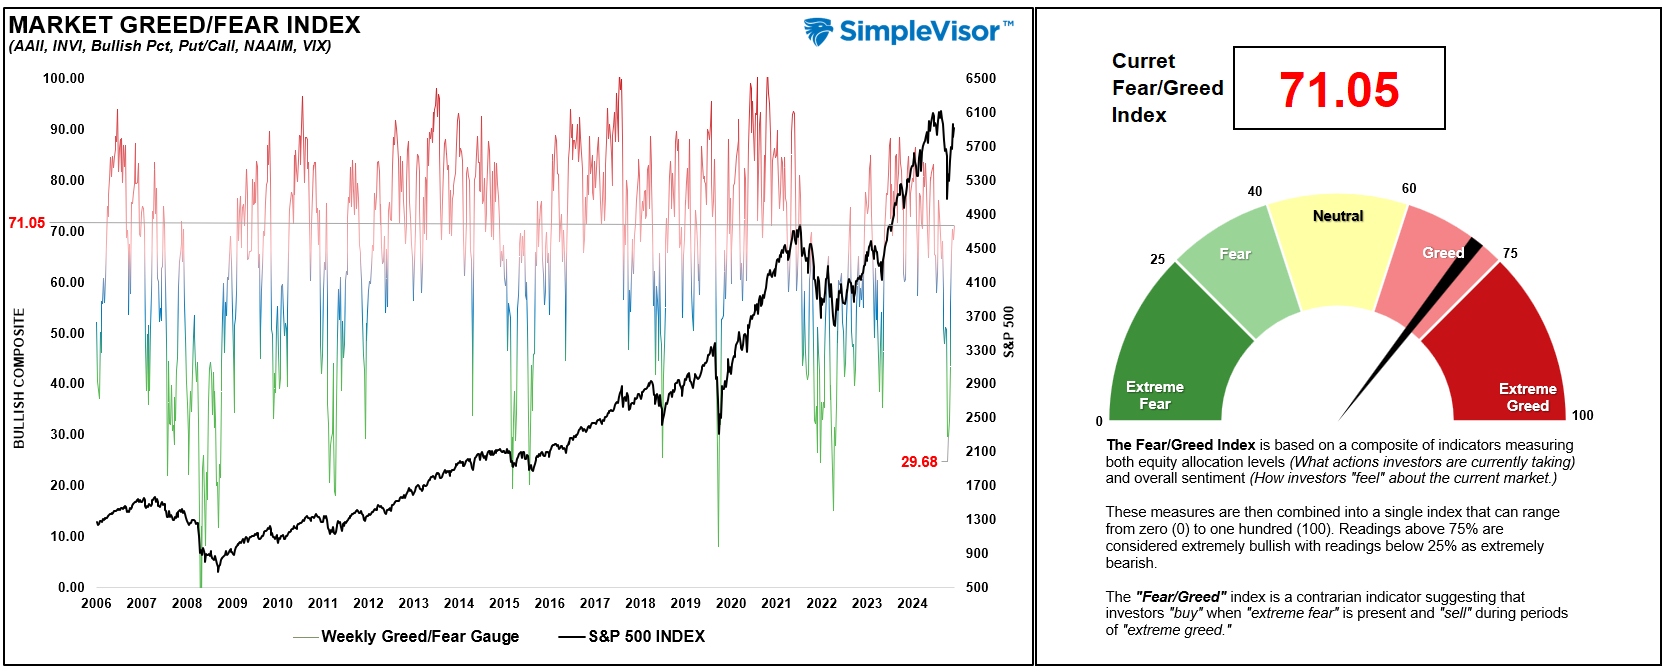
Portfolio Positioning “Fear / Greed” Gauge
The “Fear/Greed” gauge is how individual and professional investors are “positioning” themselves in the market based on their equity exposure. From a contrarian position, the higher the allocation to equities, the more likely the market is to be closer to a correction than not. The gauge uses weekly closing data.
NOTE: The Fear/Greed Index measures risk from 0 to 100. It is a rarity that it reaches levels above 90.
The current reading is 71.05 out of a possible 100.
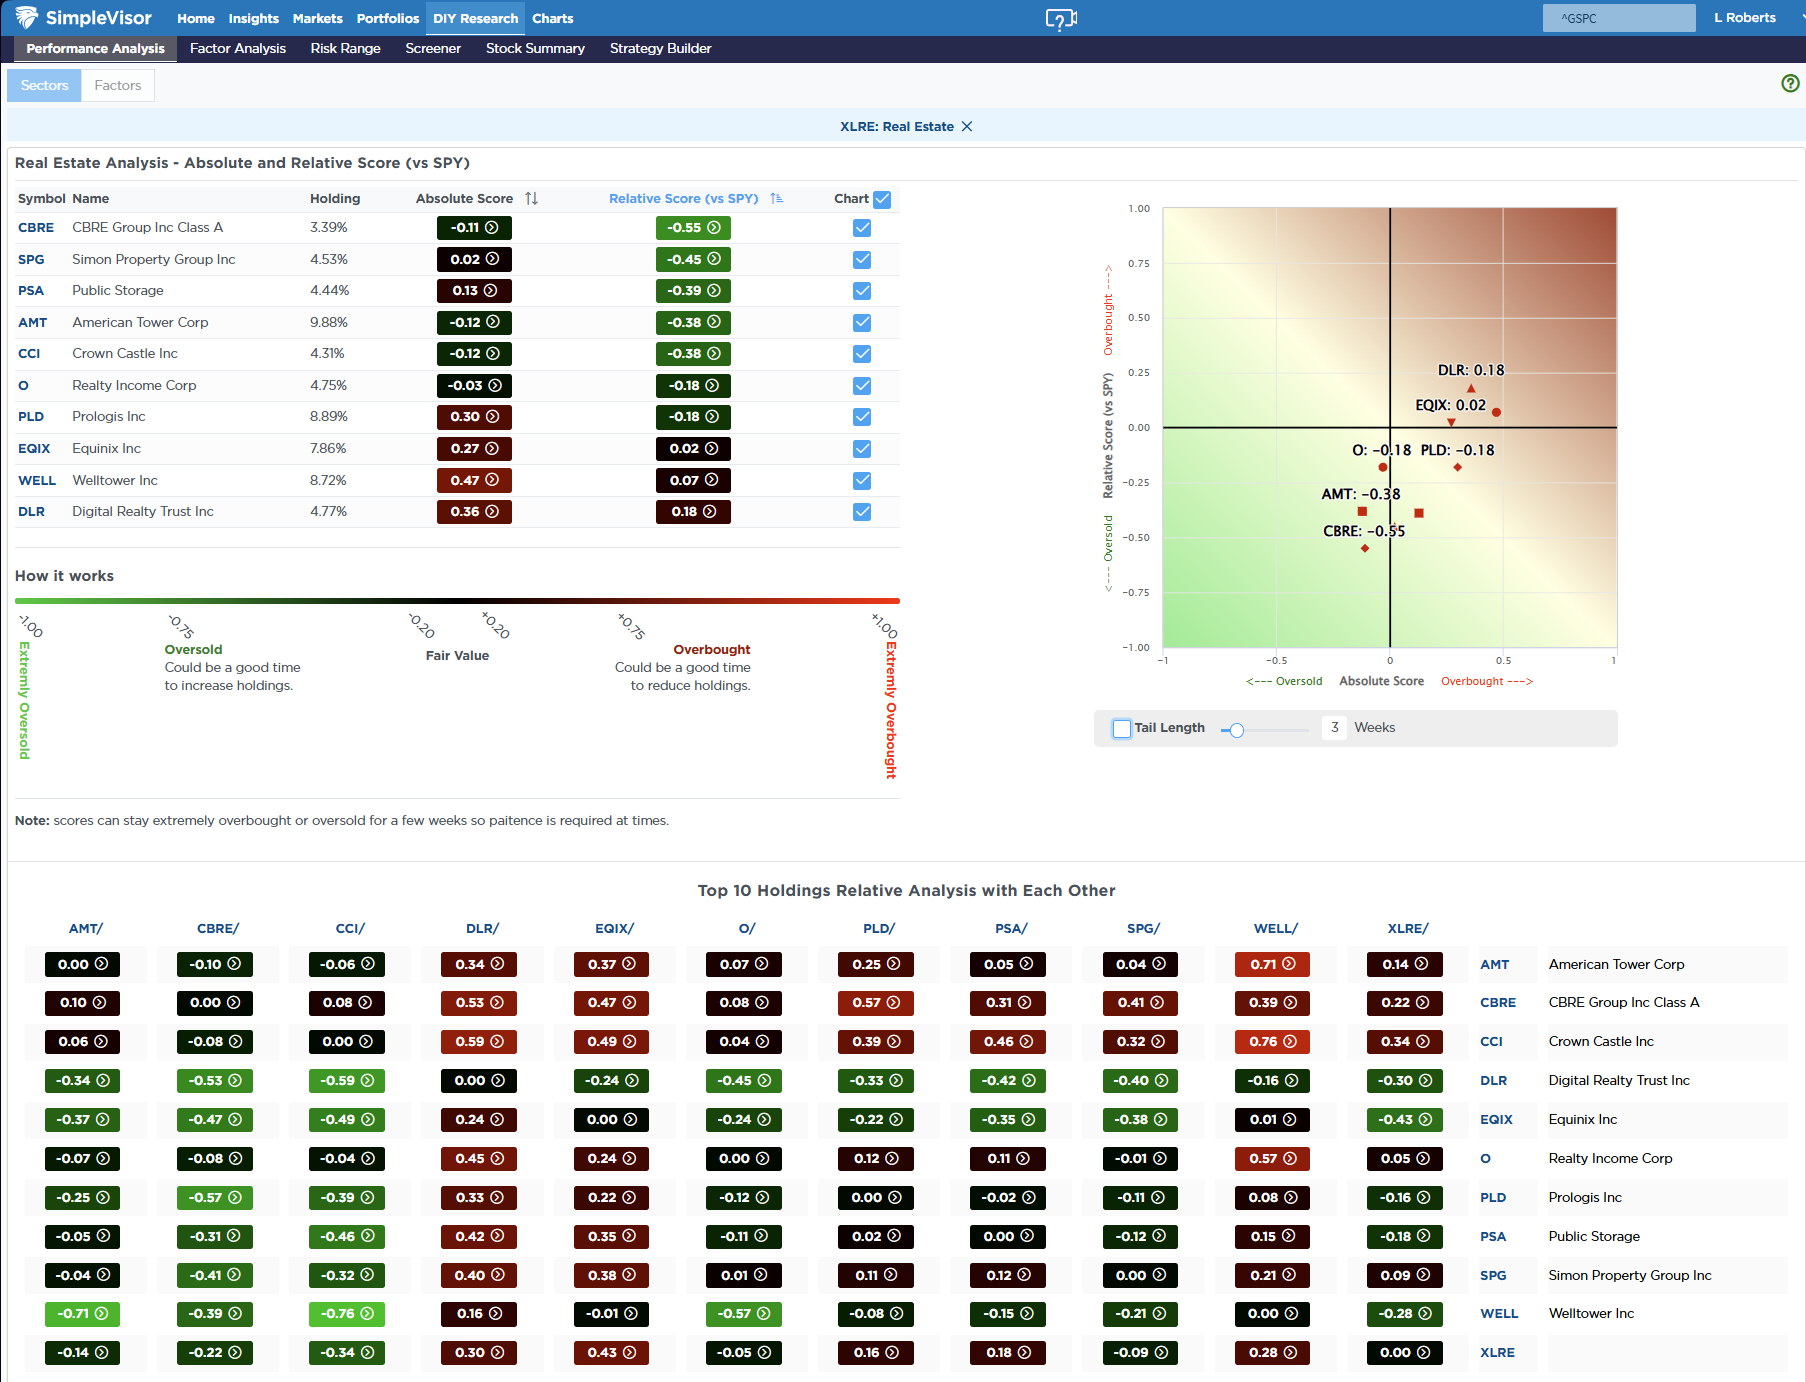
Relative Sector Analysis

Most Oversold Sector Analysis
Sector Model Analysis & Risk Ranges
How To Read This Table
- The table compares the relative performance of each sector and market to the S&P 500 index.
- “MA XVER” (Moving Average Crossover) is determined by the short-term weekly moving average crossing positively or negatively with the long-term weekly moving average.
- The risk range is a function of the month-end closing price and the “beta” of the sector or market. (Ranges reset on the 1st of each month)
- The table shows the price deviation above and below the weekly moving averages.
Last week, we noted that “the ‘relentless rally’ continued this past week and has pushed most markets and sectors well above their normal risk ranges. Given the more extreme short-term overbought conditions, investors should look for a correction over the next week or two to relieve some of that pressure.” Such was the case this week, and several markets and sectors are now below their normal risk ranges. One primary concern is the number of markets and sectors with bearish weekly signals. Such is historically only seen during more protracted corrections and bear markets, which suggests that we may be stuck in this back-and-forth market for a while longer. Continue to trade cautiously and hold higher-than-normal levels of cash.

Weekly SimpleVisor Stock Screens
We provide three stock screens each week from SimpleVisor.
This week, we are searching for the Top 20:
- Relative Strength Stocks
- Momentum Stocks
- Technical Strength W/ Dividends
(Click Images To Enlarge)
RSI Screen

Momentum Screen

Technically Strong With Dividends

SimpleVisor Portfolio Changes
We post all of our portfolio changes as they occur at SimpleVisor:
May 28th
“We recently added to our long-bond ETF (EDV) exposure for a reflexive trade given the very overbought conditions of interest rates. Today, we are clipping the profits on the trade and looking for the next opportunity.”
Both Models
- Reduce EDV to 5% of the portfolio.
Lance Roberts, C.I.O., RIA Advisors


Lance Roberts is a Chief Portfolio Strategist/Economist for RIA Advisors. He is also the host of “The Lance Roberts Podcast” and Chief Editor of the “Real Investment Advice” website and author of “Real Investment Daily” blog and “Real Investment Report“. Follow Lance on Facebook, Twitter, Linked-In and YouTube
Customer Relationship Summary (Form CRS)