


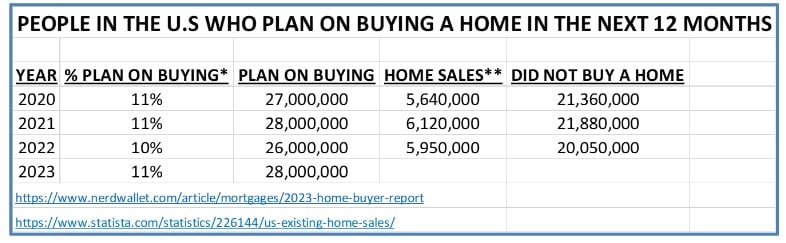
The personal finance company Nerdwallet has employed Harris to do a poll about housing every year since 2017. For the past 4 years, the poll has shown that between 10% and 11% of the U.S. population plans to buy a house in the following 12 months. That means that approximately 27 million Americans plan on buying a home in 2023. If these numbers seem surprising, they should, since home sales have been between 5.6 million and 6.1 million from 2020 to 2022. That means that over 75% of the would-be buyers, do not buy a house.
There are several possible big takeaways from this study, but two seem apparent:
- Demand for housing far outweighs the supply
- If a larger number of potential buyers did buy a house, that would necessitate even higher prices.
We have been telling the demand outweighs the supply story to clients since 2017. The table below should seem familiar to most of you, but at the risk of being repetitive, we will explain the demand-supply situation again.
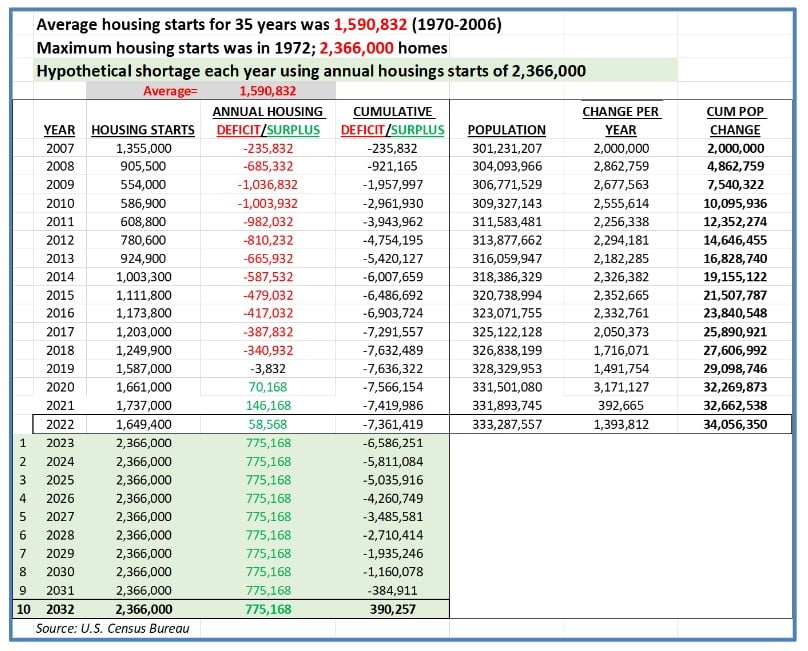
The table below shows the following for each year starting in 2007:
- Housing starts – additions to housing inventory
- Annual shortage or surplus – this is just housing starts in relation to the 35-year average of housing starts or 1,590,832 new homes. If less homes than the average are built, there is a deficit. If more homes than the average are built there is a surplus.
- Cumulative deficit/surplus – this keeps track of the total number of homes that are missing from the market each year since 2007. (ie. Homes that are not available for the normal demand).
The table shows that during and following the housing bust (2007-2018) a deficit of 7.6 million homes was created in the U.S. At the same time the U.S. population grew by 27 million people. The years since 2018 have hardly made a dent in the cumulative deficit. The deficit is now 7.3 million homes.
The bottom of the table provides an improbable hypothetical scenario. The most home starts in the past 53 years was in 1972, of 2,366,000 homes. If we assumed that 2,366,000 homes were built beginning in 2023 and every year after that, it would take 10 years to reduce the deficit. Not only is this highly unlikely, but by that time the U.S. population is expected to have grown by another 22 million (U.S. Census).
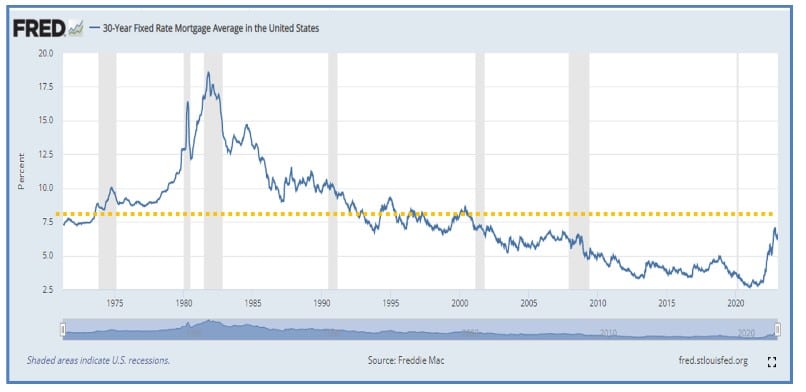
One of the main reasons given for dropping prices has been the quick increase in mortgage rates.
“Another potential point of confusion: high mortgage rates. About 3 in 5 Americans (61%) say current mortgage rates are “unprecedented,” that is they’ve “never been what they are now,” according to the survey.
This perception by buyers is just not true. The chart below shows the average mortgage rate since 1970. “Over the last 50 years, NerdWallet reports, 30-year mortgage rates have averaged 7.75 percent.”. The orange line below shows the 50-year average in relation to historical mortgage rates.
How does all of this affect home prices? The answer is merely supply and demand mixed with a little historical perspective.
- Each year the demand for homes is about 4.5 times greater than the number of homes that actually sell. à 27 million / 6 million = 4.5.
- There is a giant cumulative deficit of homes in the U.S. à 7.3 million
- Even at the highest housing start rate in the past 53 years, it would take 10 years to erase the deficit. In other words, demand will exceed supply for the foreseeable future.
- The current level of mortgage rates is only shocking in relation to the lower-than-normal levels that have existed since 2002. The current average mortgage rate is still below the long-term average.

Sources:
https://www.census.gov/content/dam/Census/library/publications/2020/demo/p25-1144.pdf
https://www.nerdwallet.com/article/mortgages/2017-home-buyer-reality-report
https://www.nerdwallet.com/article/mortgages/2023-home-buyer-report
https://www.census.gov/content/dam/Census/library/publications/2020/demo/p25-1144.pdf


Jeff Marcus founded Turning Point Analytics (TPA) in 2009 after 25 years on trading desks and 13 years as a head trader to provide strategic and technical research to institutional clients. Turning Point Analytics (TPA) provides a unique strategy that works as an overlay to clients’ good fundamental analysis. After 10 years of serving only large institutions, TPA now offers its research services to mid and small managers, RIA’s, and wealthy sophisticated individuals looking for a way to increase their returns and outperform their peers.
Subscribe 2 Week Trial
Customer Relationship Summary (Form CRS)