


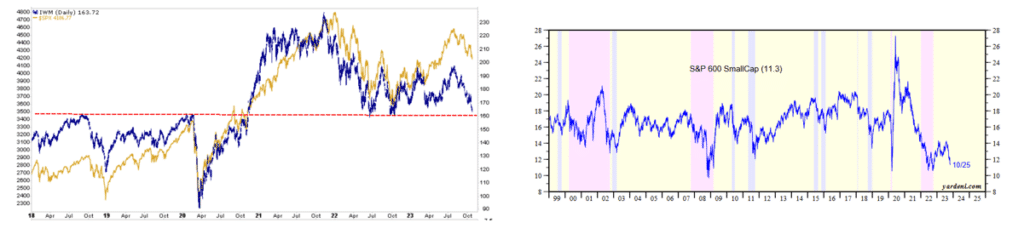
Since the rally kicked off last October, the ‘Magnificent Seven’ have outperformed all major stock indexes. Among the laggards is the Russell 2000 Index. The Russell 2000 is made up of the smallest 2000 public U.S. stocks. The graph on the left shows that since April, IWM (Russell 2000 ETF) is down 15% from the three recent peaks. Importantly, it is back to a critical technical line that provided good support in 2022. The same line acted as resistance in 2018/2019. Further, it marks the pre-pandemic highs. We will follow the index in relation to the support/resistance line closely.
Per Ed Yardeni, the forward P/E ratio of the Russell 2000 is 11.3. His graph to the right shows the valuation is near the lowest it has been in 25 years. For reference, the forward P/E on the S&P 500 is 18 and in the middle of its 25-year range (13-26).
So why are Russell 2000 stocks trading at such cheap valuations and underperforming the broader markets? For starters, passive investing has been steadily growing in popularity. As a growing number of investors chase the largest indexes and the largest stocks, smaller stocks lag. On the economic front, smaller companies generally have more trouble passing on inflation to their customers. The result is slimmer profit margins than larger companies. Lastly, many smaller companies are more indebted and have less access to the capital markets. It is estimated that a quarter to a third of Russell companies pay more in debt costs than they earn. Investors refer to such companies as zombies. Higher rates threaten zombies and other companies with high debt levels. The Russell 2000 is undoubtedly cheap, but do your homework because high amounts of debt and rising rates are a recipe for bankruptcy for some of these companies.
What To Watch Today
Earnings

Economy

Market Trading Update
As discussed yesterday morning on Before The Bell, we now have a confirmed break of the 200-DMA. The selling continued into the close yesterday as the previous safe haven of large-cap technology stocks has come under pressure. With the break, there is some minor support between current levels and the 50% retracement level of the rally that started in November last year. The market is oversold technically on many levels, which suggests further downside is likely limited. However, the potential upside is also likely limited for now, with several resistance levels overhead. Use rallies back toward the 50-DMA to reduce risk and raise cash as needed. While a year-end rally is likely, there is currently a risk of further downside before the rally begins. Remain cautious for now.


Q3 GDP Comes In Red Hot
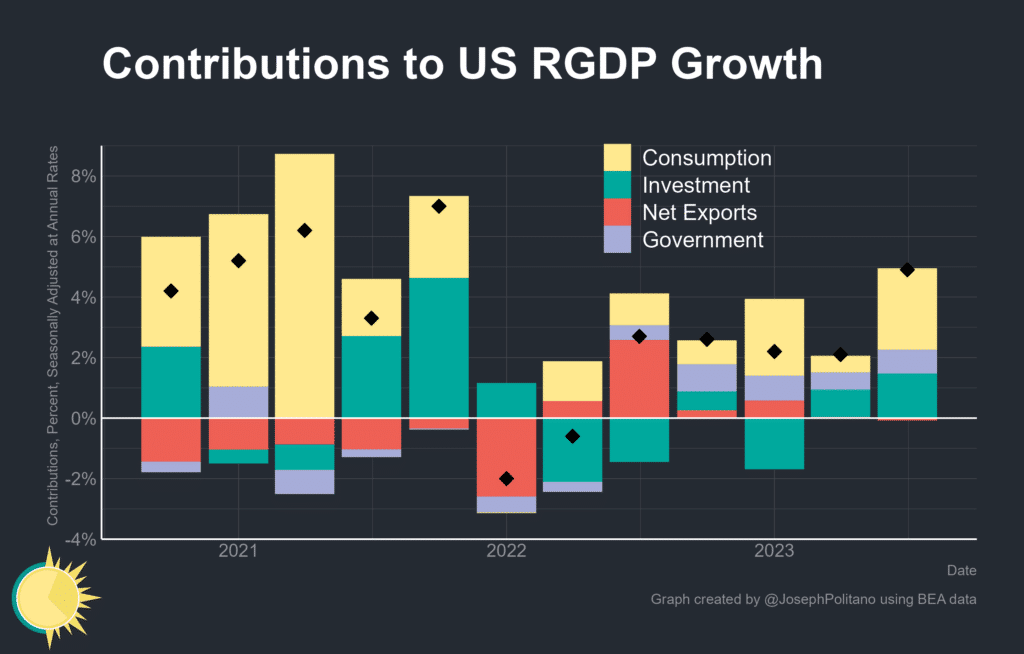
Q3 GDP grew at an annualized rate of 4.9%, well above expectations of 4.4%. Consumer spending led the charge, rising 4%, a nice increase from 0.8% last quarter. Government spending, +4.6%, also propelled GDP higher. The contributions to GDP are shown below, courtesy of Joseph Poitano. The price deflator was +3.5%, 1% more than expectations. While that may be cause for concern at the Fed, the core price deflator, excluding food, energy, and housing, was only +1.8%. Today’s monthly PCE prices index will give us a more current read of inflation.
The initial stock and bond market reactions were positive. Based on the Atlanta Fed GDPNow estimate of 5.4%, Investors were expecting a higher number than analysts were expecting. Further, GDP lags. Not only does it report data that is several months old, the data tends to be revised over time. Often, heading into a recession, GDP is revised sharply lower.
Albert Edwards Questions The Hot Economy
Albert Edwards shares the graph below, which questions yesterday’s strong GDP print. He cautions that we should keep a close eye on core durable goods orders as they tend to correlate with economic activity. Per Edwards:
For all the talk of a resilient economy, core orders (non-defense cap goods ex aircraft) look pretty weak in real terms. The data is published in nominal terms, and the Conf Board publishes the real data later
His broader point is that inflation is distorting economic data. Inflation is impossible to measure with great accuracy. Therefore, looking at nominal and real data side by side is helpful. As he shows, the volume of durable goods orders is at a 15-year high, yet on an inflation-adjusted basis, it is well below the highs and in line with recessionary periods.
From our point of view, the economy is not in a recession, but it’s also likely not as strong as some data might lead us to believe.

Tweet of the Day

Please subscribe to the daily commentary to receive these updates every morning before the opening bell.
If you found this blog useful, please send it to someone else, share it on social media, or contact us to set up a meeting.
Post Views: 5
2023/10/27