


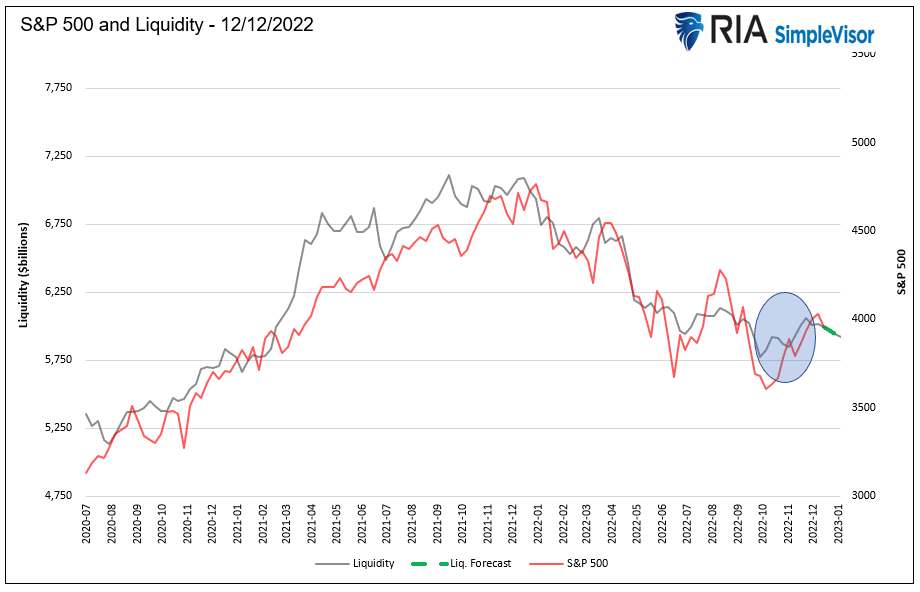
The U.S. Treasury department hit its debt limit on August 1st. As a result, they are quickly draining their Treasury General Account (TGA), i.e. “checking account”, to keep the amount of total debt outstanding below their cap. The U.S. Treasury’s actions have effectively boosted financial liquidity in the short run. To wit, in our article, S&P 3500 By Year End, we note that government-sponsored liquidity comes from three sources: the TGA, Fed’s Repo Program, and Fed’s balance sheet. The article provides more background on the three liquidity sources and how to compute net liquidity.
In part due to the Treasury’s actions, liquidity has been increasing over the last five weeks. The Fed continues to reduce its balance sheet, which drains liquidity, but its actions are offset by falling Treasury and repo balances. Net liquidity has risen by $244 billion over the period. Not surprisingly, as shown below, the S&P 500 has been following liquidity higher. While bullish for the moment, TGA balances will increase once the debt cap is resolved, and Treasury replenishes its TGA account. Net liquidity will likely start falling again once this occurs.
The Fed is not the only game in town, but they are the biggest game in town. While many other factors account for stock price performance, liquidity may be the most important to grasp.
What To Watch Today
Economy
- 6:00 a.m. ET: NFIB Small Business Optimism, November (90.5 expected, 91.3 prior)
- 8:30 a.m. ET: Consumer Price Index, month-over-month, November (0.3% expected, 0.4% prior)
- 8:30 a.m. ET: CPI excluding food and energy, MoM, November (0.3% expected, 0.3% prior)
- 8:30 a.m. ET: Consumer Price Index, YoY, November (7.3% expected, 7.7% prior)
- 8:30 a.m. ET: CPI excluding food and energy, YoY, November (6.1% expected, 6.3% prior)
- 8:30 a.m. ET: CPI Index NSA, November (298.118 expected, 298.012 prior)
- 8:30 a.m. ET: CPI Core Index SA, November (300.430 expected, 298.012 prior)
- 8:30 a.m. ET: Real Average Hourly Earnings, year-over-year, November (-2.8% prior)
- 8:30 a.m. ET: Real Average Weekly Earnings, year-over-year, November (-3.7% prior)
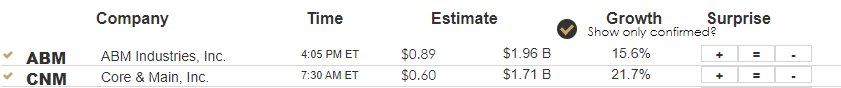
Earnings
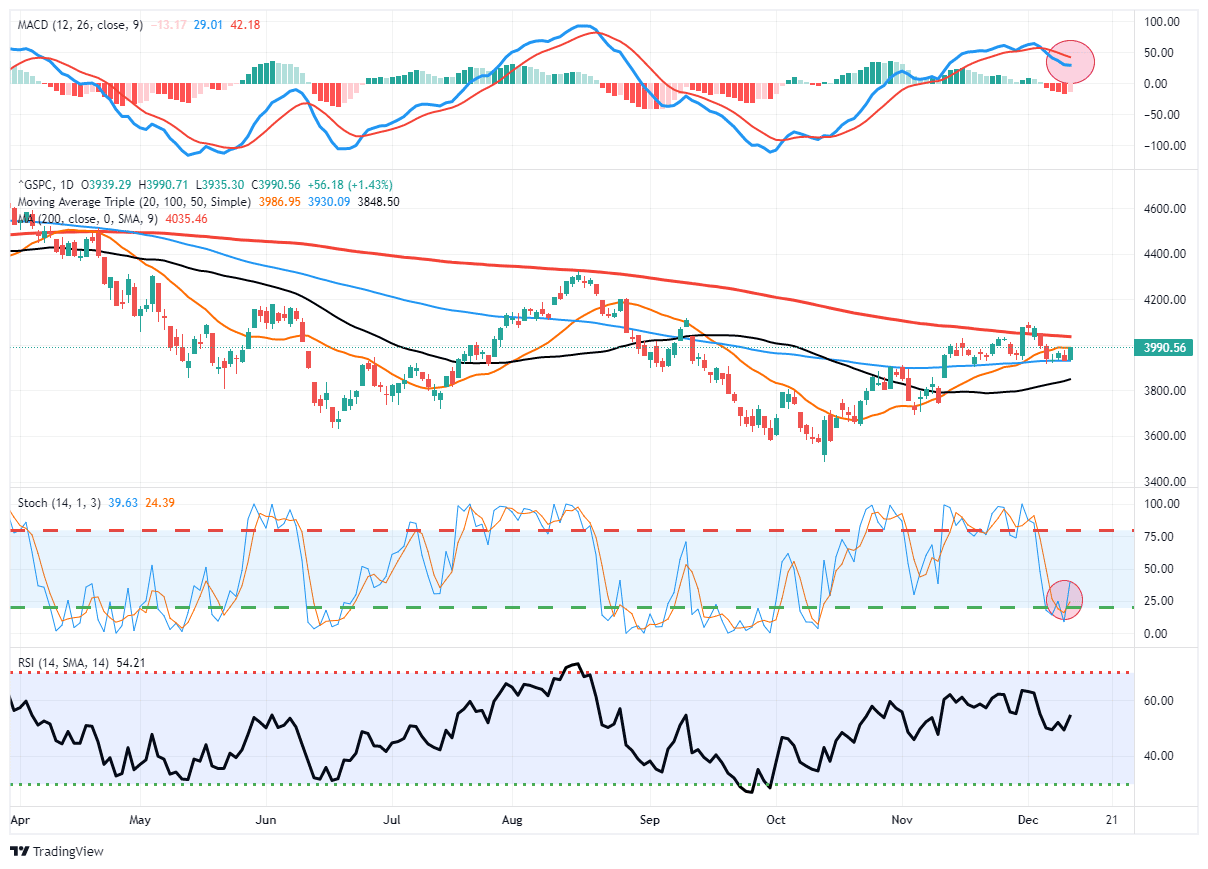
Market Trading Update
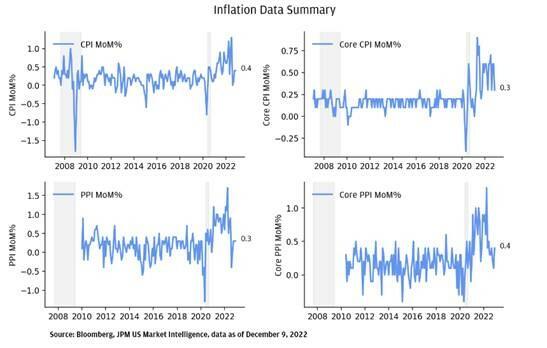
Today is CPI day. The current expectation is for a slightly cooler print and for the inflation rate to decrease again as the year-over-year comparisons remain elevated. Once again, in hopes that signs of weaker inflation will lead the Fed to take its foot off the gas, markets rallied sharply ahead of the number bouncing off the 100-DMA support level. That was good news, but the 20-DMA contained the rally. With short-term indicators oversold, the rally was not surprising, and as we move into the end of the month, we should see some additional buying.
However, we suggest remaining cautious ahead of the Fed. If the market rallies today on a weaker inflation print, Mr. Powell will likely deliver a steeply hawking statement at Wednesday’s FOMC press conference. He has been clear that until inflation comes down markedly, they are not “pivoting” any time soon.
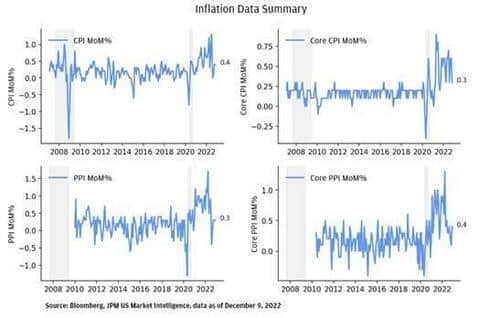
Inflation Preview
Via ZeroHedge:
- The consensus is looking for a mixed release, with the headline rate of consumer prices decelerating slightly to 0.3% M/M in November (prev. 0.4%), while the core rate is expected to remain unchanged at +0.3% M/M (prev. 0.3%).
- On an annual basis, the headline CPI YoY is expected to print 7.3% (vs. 7.7% prior), while core CPI is expected to rise 6.1% Y/Y vs 6.3% prior.
- In October, core CPI fell sharply after hefty readings in both August and September, and along with other inflation metrics, has resulted in a reassessment of inflation expectations, with many now more forcefully making the argument that inflation pressures have turned a corner; Morgan Stanley itself looks for inflation to remain at these more moderate levels going forward, as the disinflationary forces continue, and the bank expects the November report to confirm the slowdown.
- While the data is unlikely to shift the dial too much for the December FOMC (the Fed announcement is due the day after the CPI data), where a 50bps rate rise is assumed to be a done deal given the recent commentary from Fed officials, it could be influential in shaping expectations of where the terminal rate will eventually be (currently, markets expect rates to peak at 4.75-5.00% in March 2023, where it is expected to remain until the November 2023 meeting, after which the market expects rate cuts).
Regarding S&P’s reaction function to the headline CPI YoY print, here is the framework Goldman is using…
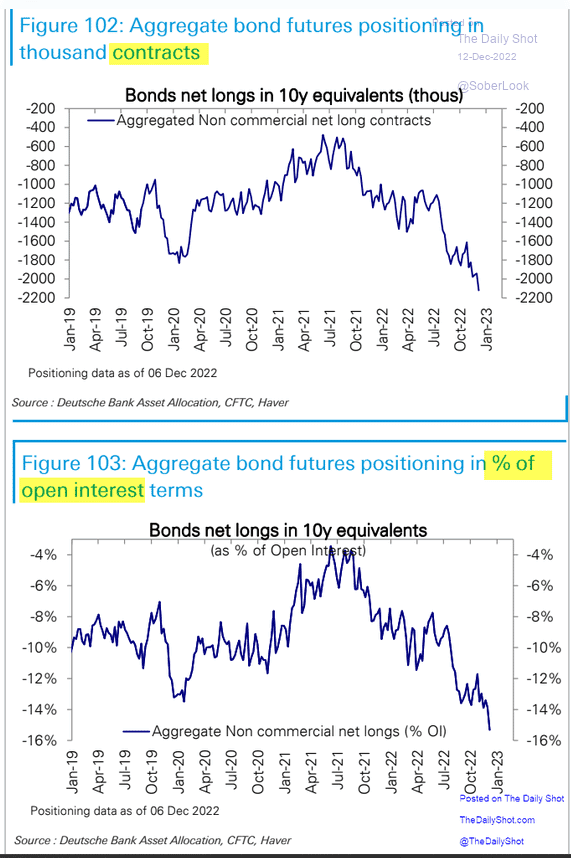
Fuel For a Bond Rally
We have repeatedly said that weakening inflation and slowing economic growth may be the impetus pushing bond yields lower. The graphs below from Deutsche Bank argue that technicals and a potential short squeeze may also play a role. The number of short bond futures positions held by non-commercial accounts is currently at its highest level in at least three years. Non-commercial accounts are hedge funds, CTAs, and other speculators. If yields continue to decline rapidly, said investors will have to cover their short positions. The possibility for a buying stampede exists if yields fall rapidly enough. Conversely, they may exit their short positions in a more orderly manner, which will still require buying, but it may not be enough of a pace to create a short squeeze.
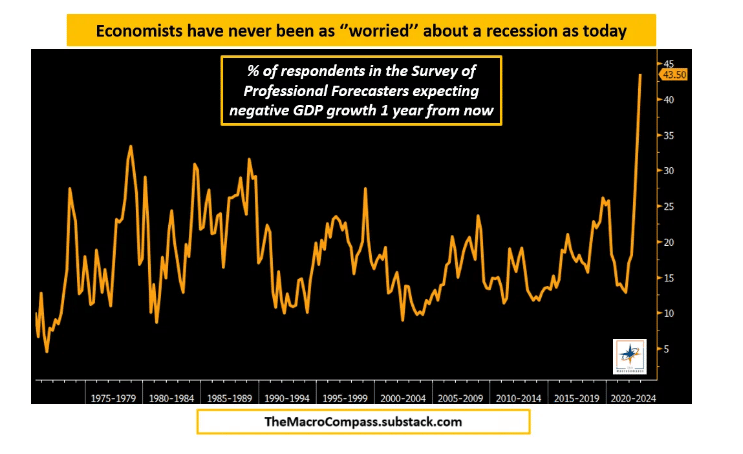
Is a Recession Inevitable?
Yield curves, sentiment/manufacturing surveys, and Wall Street all warn that a recession in 2023 is probable. The graph below from @macroalf shows 43.5% of the respondents in the U.S. Survey of Professional Forecasters also expect negative GDP growth within a year. As shown, that reading dwarfs prior expectations leading up to recessions. If a good majority of economists think a recession is coming, can they be right? Recessions often come as a surprise despite mounting financial and economic evidence. This is yet another graph that begs us to consider whether or not this time will be different.

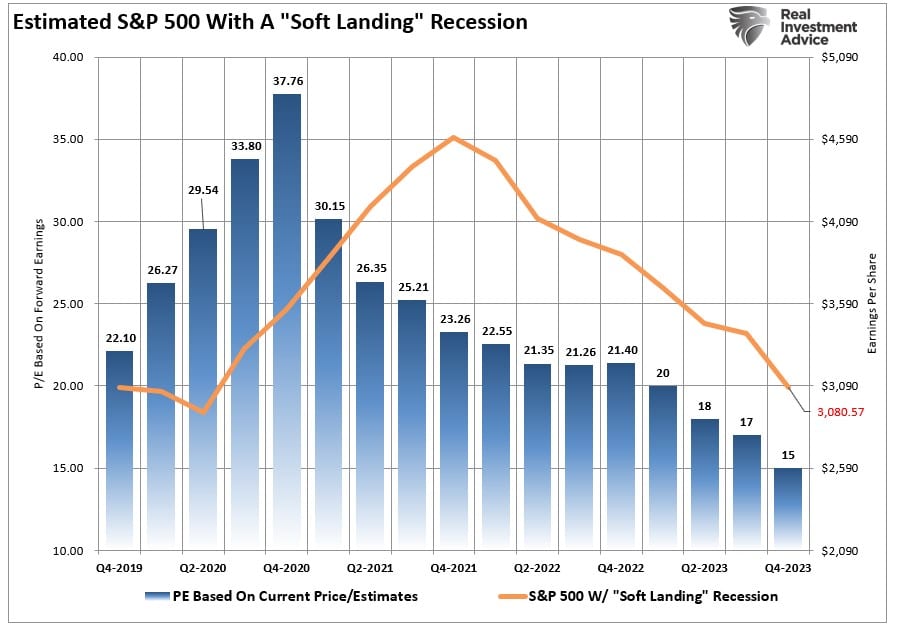
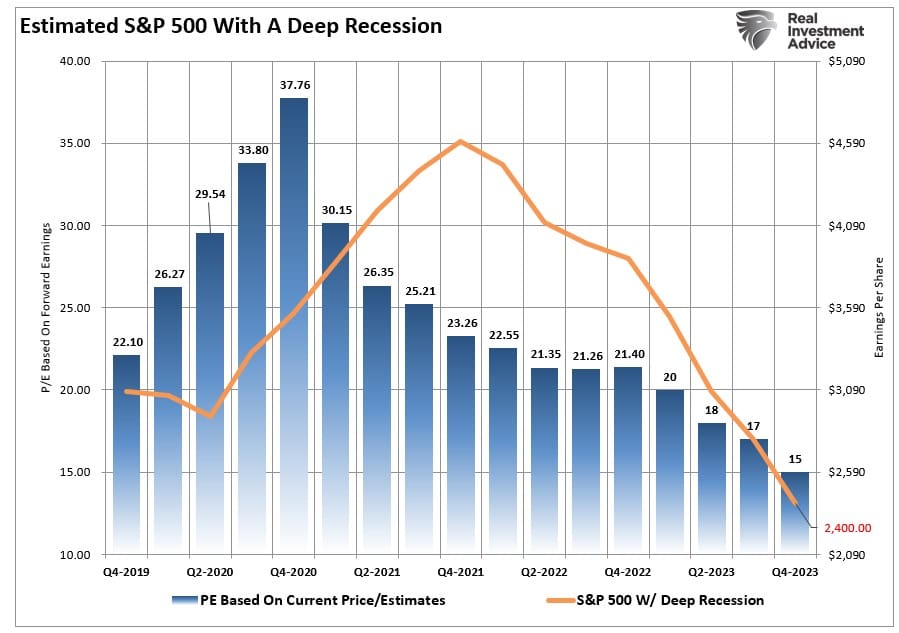
2023 S&P 500 Price Targets
In our latest Weekly Bull/Bear Report, Lance Roberts thinks about the year ahead and puts price targets on the S&P 500 based on valuations and earnings projections. His conclusion is rather simple, given that valuations remain above average and earnings are likely to decline, the S&P 500 will likely decline next year. The two graphs below show his estimates, which are predicated on whether or not a recession occurs. To get the Bull/Bear Report for free in your email inbox every week, go to Real Investment Advice and subscribe.
Lance’s summary-
As stated, many things can occur when estimating future price targets. However, based on current earnings estimates and historical median valuations, both cases suggest poor returns over the next 12 months.
That is just the math.
Tweet of the Day
Please subscribe to the daily commentary to receive these updates every morning before the opening bell.
If you found this blog useful, please send it to someone else, share it on social media, or contact us to set up a meeting.