


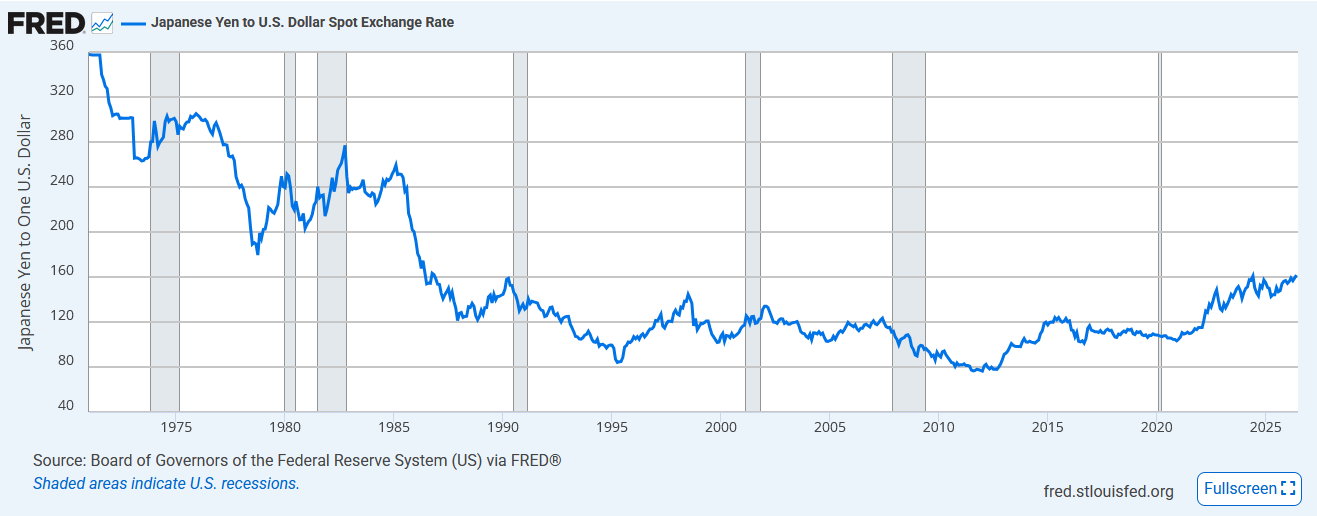
As shown below, the Japanese yen has fallen to levels not seen since the late 1980s. (Note the chart quotes yen per dollar, thus a higher figure represents a depreciating yen) We have written extensively about why the yen matters to US markets: the yen carry trade. The trade is relatively simple. An investor borrows yen at low interest rates in Japan, converts the proceeds to dollars, and buys higher-yielding US assets, typically stocks or bonds. As we wrote in 2022, putting down $100,000 to borrow $1,000,000 in yen and buying a 3% Treasury note can generate nearly a 30% return, assuming the yen’s value doesn’t change versus the dollar. The success of the trade depends almost entirely on a weak or stable yen.
The risk in a carry trade arises when the currency appreciates against the dollar. Given that the carry trades are estimated at $10 to $20 trillion in aggregate, a forced unwind can have global impacts. We saw this play out in August 2024, when Japanese currency intervention spurred a rapid strengthening of the yen, triggering a 10% decline in the S&P 500 in a matter of days.
Today, the yen is weakening. This keeps the carry trade economically attractive rather than under stress. But Bank of Japan officials are increasingly discussing its weak currency as a source of domestic inflation, since Japan imports nearly 100% of its energy needs. Prolonged weakness sets up the conditions for the next reversal whenever the BOJ decides to stop it.
In a section below, we detail what this condition implies for markets and provide links to prior pieces on the yen carry trade and Japan.
What To Watch Today
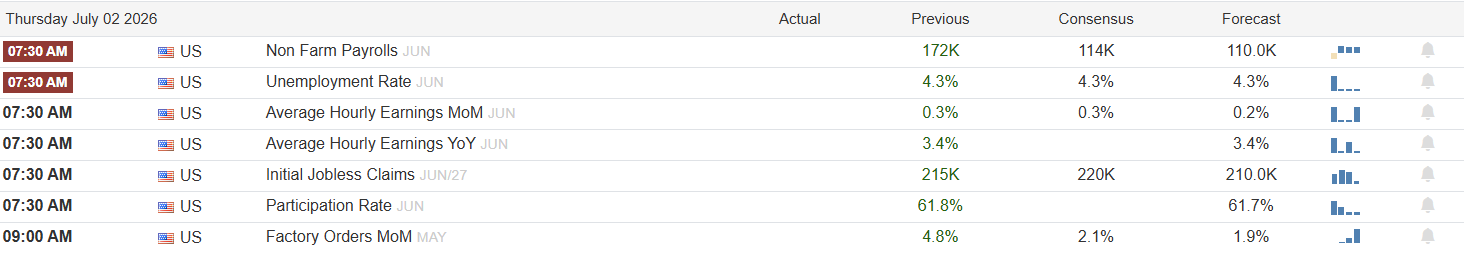
Earnings

Economy
Market Trading Update
Yesterday, we flagged July’s seasonal edge, the firmest stretch of the summer calendar. Today, widen the lens to the entire second half, because the first six months have given us a specific setup.
The S&P 500 closed the first half up about 9.5%, finishing June at 7,499 after tagging a record 7,620 on June 2. Here is why that exact number matters. Carson Investment Research flagged a clean historical bucket: the years when the S&P rises between 5% and 10% at the June midpoint. Our 9.5% lands right at the top.
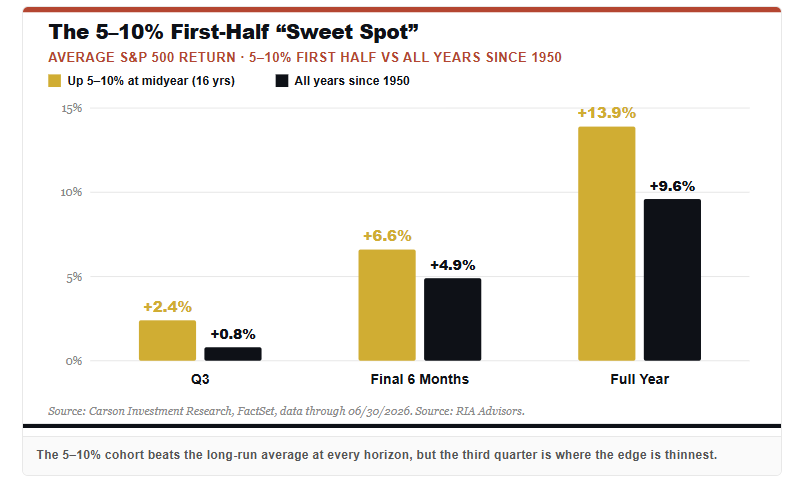
The base rate is compelling. Since 1950, that setup has shown up 16 times. In those years, the final six months finished higher 87.5% of the time, averaging a 6.6% gain, and the full year came in positive 93.8% of the time, averaging 13.9%. Every one of those readings beats the all-years baseline, where the last six months rise 72% of the time and average 4.9%. A market already up 5% to 10% by mid-year has, more often than not, kept climbing into December.
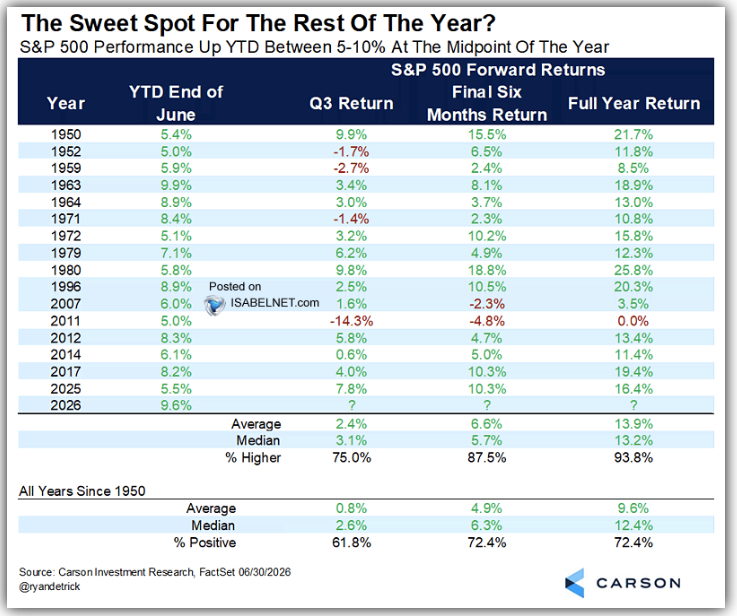
But a base rate is a set of odds, not a PROMISE, and the path is rarely the smooth line the average implies. The third-quarter column is the weakest, appearing higher only 75% of the time and averaging just 2.4%. The chop tends to arrive first. 2011 sat in this same bucket and then dropped 14.3% in the third quarter before clawing back to flat on the year. Now, layer on the calendar we keep flagging. 2026 is a mid-term election year, and August through October is historically the weakest, most volatile stretch of the cycle. As Bob Farrell reminds us, the market rarely rewards the crowd that assumes the easy path.
So how are we playing it? We stay constructive, because the odds favor participation. We are letting current allocations work into July’s tailwind and keeping the Mag 7 add we made into the selloff on its defined earnings-season exit. But we will manage risk harder as August approaches, because the third quarter is where the air pockets live. The bottom line is simple. A 5-to-10% first half tilts the odds toward a higher finish. It does not promise a straight line, and the discomfort usually shows up before the payoff.

A Yen Carry Trade Unwind
As we lead, the carry trade thrives with a weak yen, as we have today. Despite higher Japanese borrowing costs, the yen has depreciated significantly against the dollar, more than offsetting the higher interest costs for carry trades. A weakening yen means the trade remains profitable, and the leverage the carry trade provides to markets continues to build.
The likely catalyst for change is the Bank of Japan (BOJ). BOJ officials are concerned that prolonged yen weakness is inflationary as it raises import costs. If currency-driven inflation intensifies and public pressure mounts, the depreciating yen could force the BOJ to pursue additional rate hikes to strengthen the currency. Additionally, the BOJ could intervene in the currency markets to support the yen.
That is the mechanism that triggered in 2024. On July 11th, the BOJ intervened in currency markets. The Nasdaq got hammered while the Russell 2000 surged. Given that the Nasdaq was the likely home for much of the yen carry-trade investment, the market divergences were a clear sign of carry-trade unwinding.
The risk today to US investors is that higher Japanese yields and a stronger yen could force a rapid, disorderly reversal of the carry trade. Bear in mind that the more the yen falls, the more the trade grows, and the larger the unwind will be whenever the BOJ finally acts. Below, we share articles we have written on the topic:
Related RIA Coverage:
More Market Wisdom: Jesse Livermore Part 2
In Part One, we shared some market wisdom from one of the greatest traders, Jessie Livermore. While Livermore’s name is not always mentioned alongside other great investors and analysts, such as Warren Buffett and Peter Lynch, his sage advice is priceless. Interestingly, much of what Livermore teaches his readers runs counter to what Warren Buffett and Peter Lynch preach to investors. This is likely because Buffett and Lynch are more fundamentally grounded, while Livermore was a much more market technical analyst who acutely understood his behavioral flaws and those of competing investors.
While we should respect and read as much as we can about the legends of the investment world, we must also keep in mind that there is no such thing as a proven method for investing. Every investment strategy, no matter how conservative or risky, has flaws. Livermore’s trading record is no exception, as he died broke. That said, his acute knowledge of investor behavior is priceless. With that, we now proceed to rules 10 through 21.

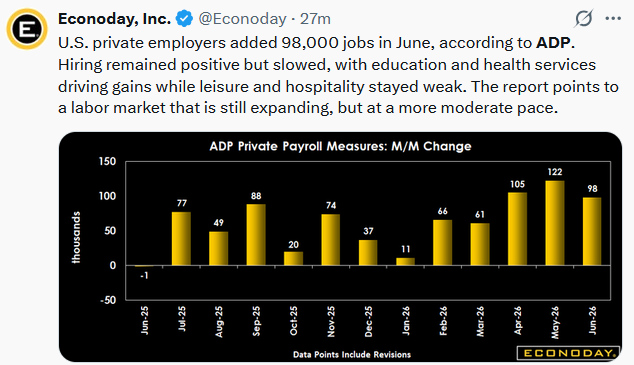
Tweet of the Day
New UPDATED Trading Rules With Desktop Printout
“Want to achieve better long-term success in managing your portfolio? Here are our 15-trading rules for managing market risks.”
Please subscribe to the daily commentary to receive these updates every morning before the opening bell.
If you found this blog useful, please send it to someone else, share it on social media, or contact us to set up a meeting.