


This is the least likely time to worry about home prices in the past 50 years.
Too many individuals let the constant everyday news noise, normally driven by headlines without historical context, affect their beliefs and actions. In this report, we will strive to provide historical context. We have been are still sanguine on the U.S. housing market in general and Massachusetts in particular.
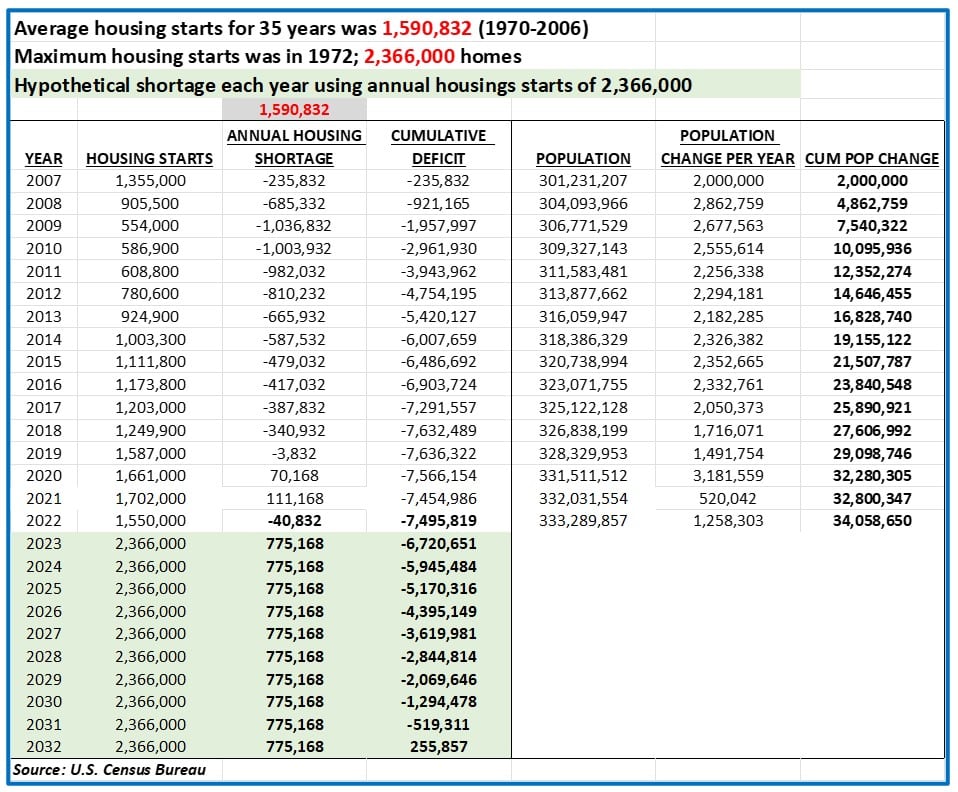
As we talk about the economy and housing, keep in mind what we have tried to drill home for readers for the past 4 years – there is a historic housing shortage that will take not years, but decades to rectify. The table below shows that even if Housing Starts annually somehow managed to stay at its highest level ever recorded (2.3 million homes in 1972), it would still take until 2032 to reduce the deficit created from 2007 to 2019. (Of course, that does not take into account that the U.S. population has grown by over 34 million since 2007.)
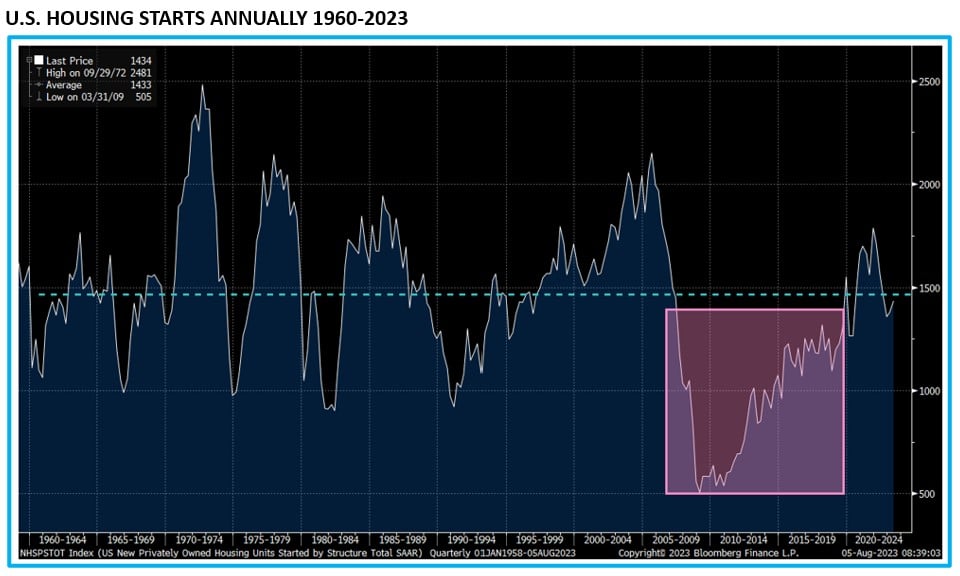
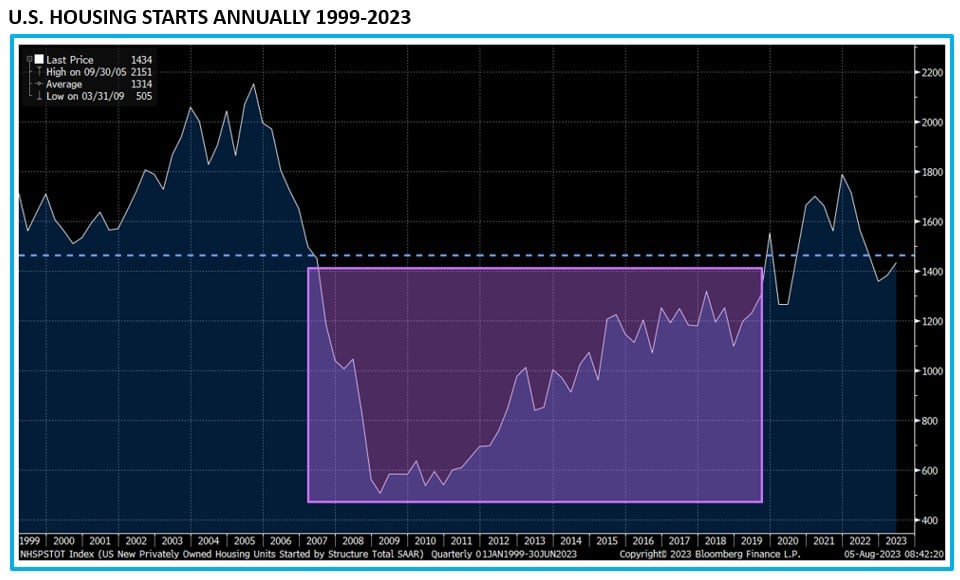
The charts below show the Housing Start deficit in sharp relief.
This deficit of Housing Starts led directly to a 10-year under-average housing inventory. See the chart below.
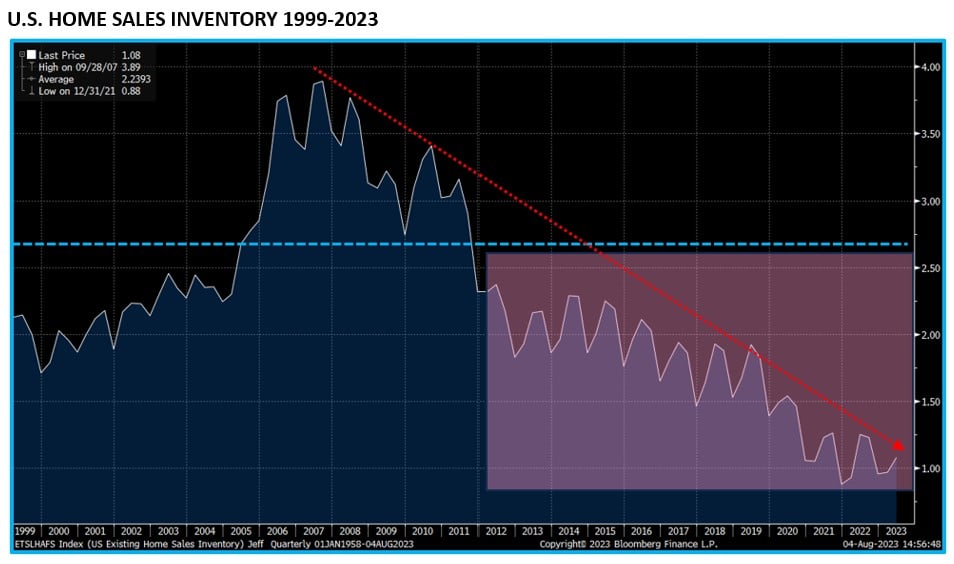
Combine the housing supply deficit with the effects of Covid – remote work and government cash – and you get the bump we saw from 2020 to the present (chart below).
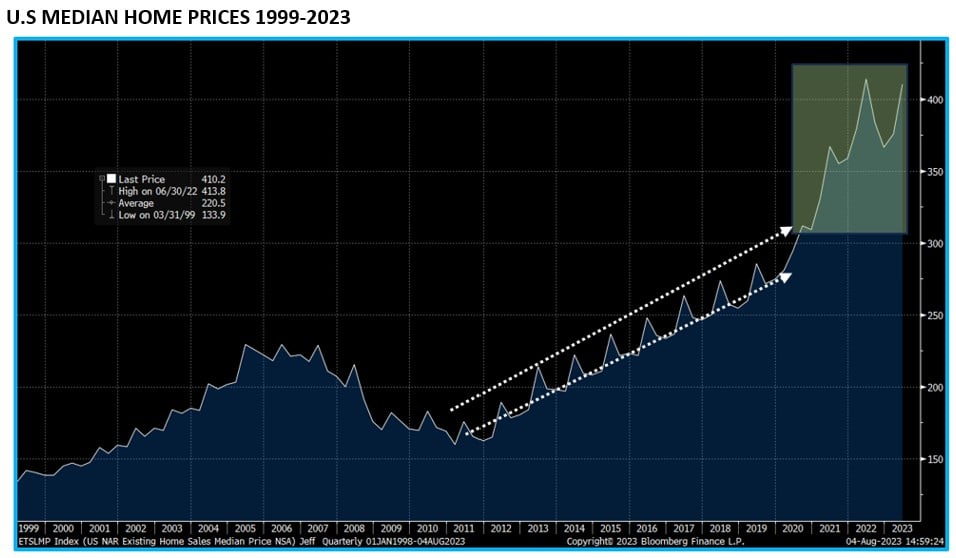
Even without the shortage of homes starts, however, the lessons of history are clear – housing prices continue to rise throughout good and bad times.
The charts below line up the Median U.S. Home Price from 1970 to present day with the major factors that should effect prices:
- Unemployment – a good barometer for the economy
- Average 30-Year Mortgage Rate – the price of borrowing for a home
- Stock prices – a good measure of economic strength and wealth creation.
Each chart also shows U.S. recessions by the shaded areas. Why are we showing you all these charts? Because one thing is clear over the past 60+ years. Through all the recessions, rising and falling employment, massive changes in mortgage rates, and huge stock market moves, the only time Home Prices declined for a sustained period of time was the Housing Bust. That decline in prices was caused not by high home prices, weak employment, or high rates. That decline was caused by the housing market itself – overleveraged homeowners and banks, lax lending requirements, and a mortgage-back security market that resembled a Ponzi scheme. None of those conditions exists today.
1970-2023 Charts: Median Home Prices, Unemployment Rate, Average 30-Year Mortgage, the S&P500.
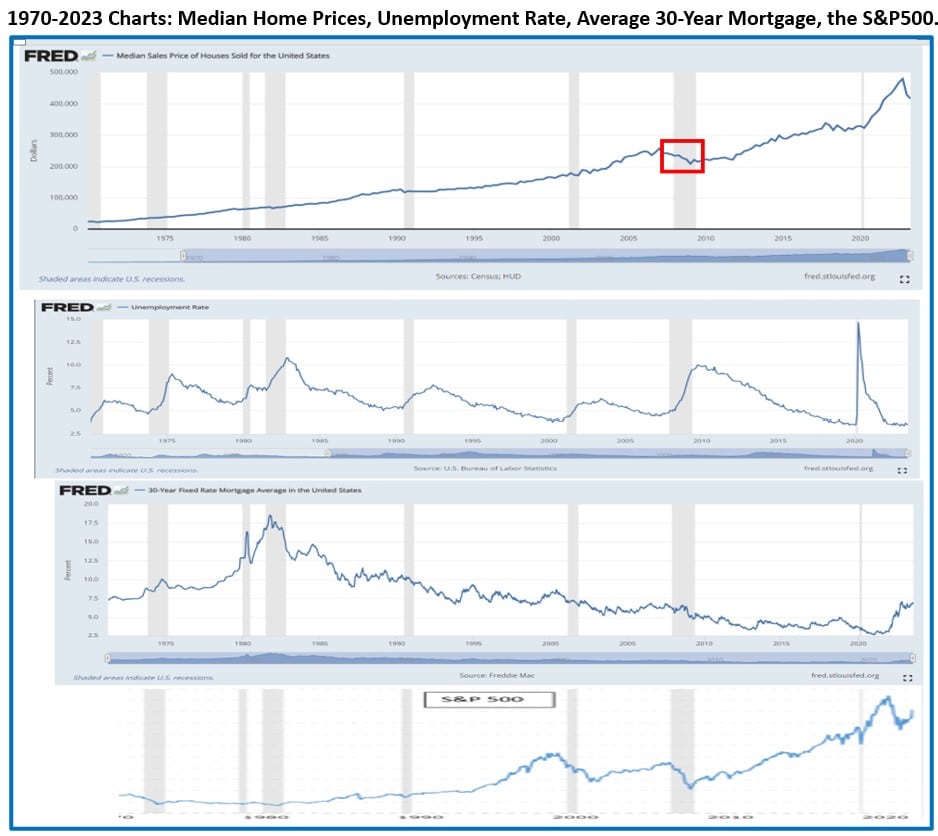
People may be concerned about the almost constant parade of bad news. They may worry about a political system in crisis, global warming or the war in Ukraine. The truth is that there have always been exogenous events occurring coincident with the consistent march of higher home prices. The charts above include wars in Vietnam, Iraq, and Afghanistan. The time period covers the resignation of one president and the impeachment of 2 others. The charts above also include the oil embargo and resulting gas shortage, the savings and loan crisis, the Tech bubble bursting, 9/11, and Brexit. These exogenous events still did not cause a large or sustained housing decline.
The conclusion seems obvious. Home prices climb consistently. This seems like the least likely time to worry about home prices, since we are now experiencing the worst deficit in housing supply in the past 50 years.


Jeff Marcus founded Turning Point Analytics (TPA) in 2009 after 25 years on trading desks and 13 years as a head trader to provide strategic and technical research to institutional clients. Turning Point Analytics (TPA) provides a unique strategy that works as an overlay to clients’ good fundamental analysis. After 10 years of serving only large institutions, TPA now offers its research services to mid and small managers, RIA’s, and wealthy sophisticated individuals looking for a way to increase their returns and outperform their peers.
Subscribe 2 Week Trial
Customer Relationship Summary (Form CRS)