


There are few scars as deep and long-lasting for homeowners or anyone involved in the real estate market than the memory of the Housing Crisis of 2008-2009. Many people swore off real estate after the Great Recession; reciting the mantra of “never again”. Now, with the U.S. Median Home Price at $396,300 (9/30/22) up from $274,400 (9/30/19) or up 69% in the past 3 years, the term “Housing Crash” is being dragged out in article after article. As many analysts and pundits call for large impending price declines or worse, we just wanted to show the real difference between 2022 and 2007.
We will address the major concerns about the housing market, but one of the most important truths was stated in TPA’s recent World Snapshot’s: Why A Sustained Drop In Home Prices Is Impossible (8/19/22) and The Truth About Housing Inventory (10/7/22). There is a historic lack of housing inventory in the U.S., which is a direct result of a lack of home building in the wake of the 2008-2009 crisis. The huge supply-demand imbalance makes a wave of selling overwhelming buyer demand close to impossible.
Why 2022 is not 2007
THE DATA DOES NOT LIE:
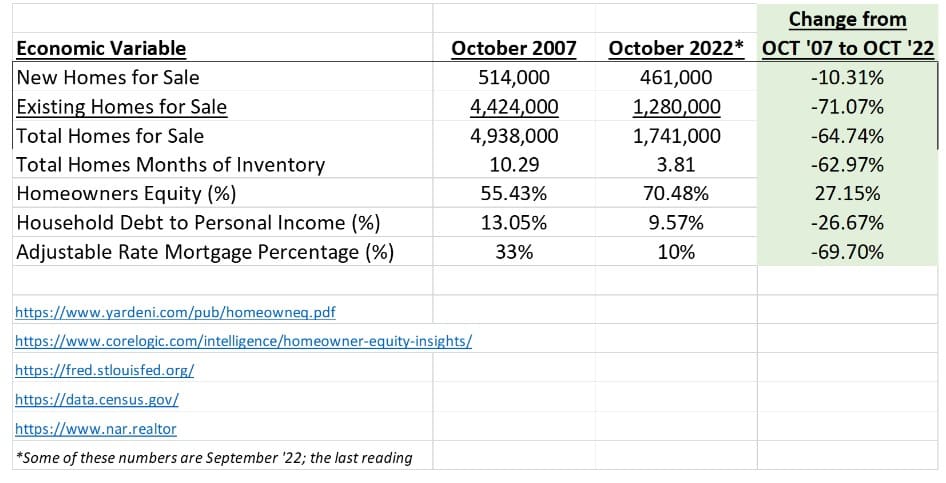
THE DATA EXPLAINED:
- Supply – many pundits have pointed to the months supply of new homes rising as a reason for extreme concern. In The Truth About Housing Inventory, we addressed this directly. New Homes make up a small percentage of homes sold. If you want to look at supply you need to count both existing homes for sale and new homes for sale. The table above shows that;
New homes for sale in 2022 are 10% lower than they were in 2007
Existing homes for sale in 2022 are 71% lower than they were in 2007
Total homes for sale are 64% lower than they were in 2007
Total homes months of inventory is 62% lower than in 2007
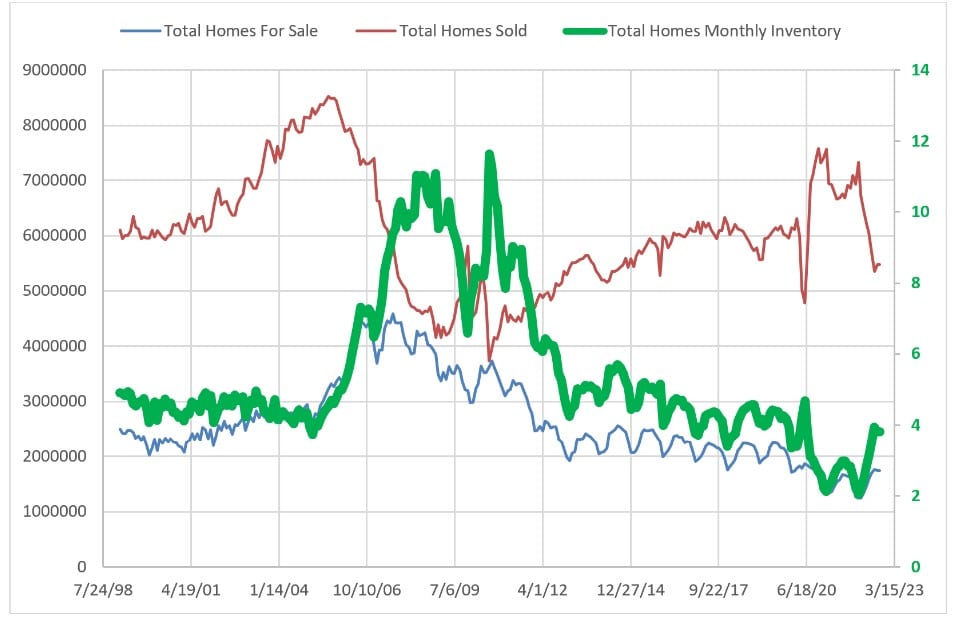
The chart below is from The Truth About Housing Inventory and shows that inventory is at historic lows.
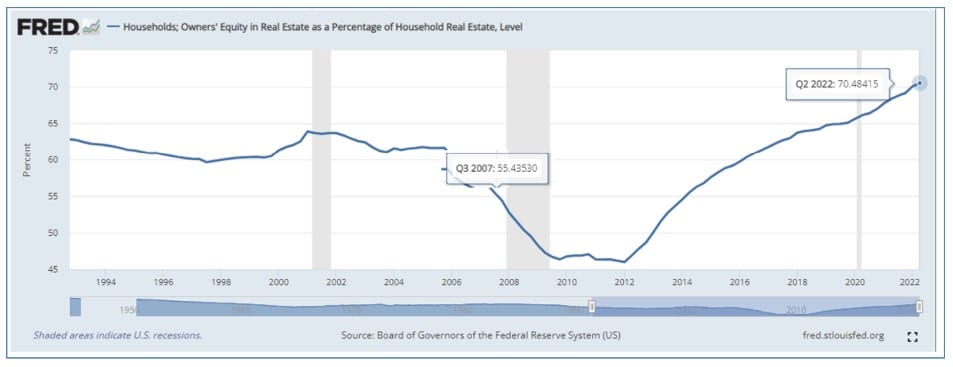
- Homeowners Equity
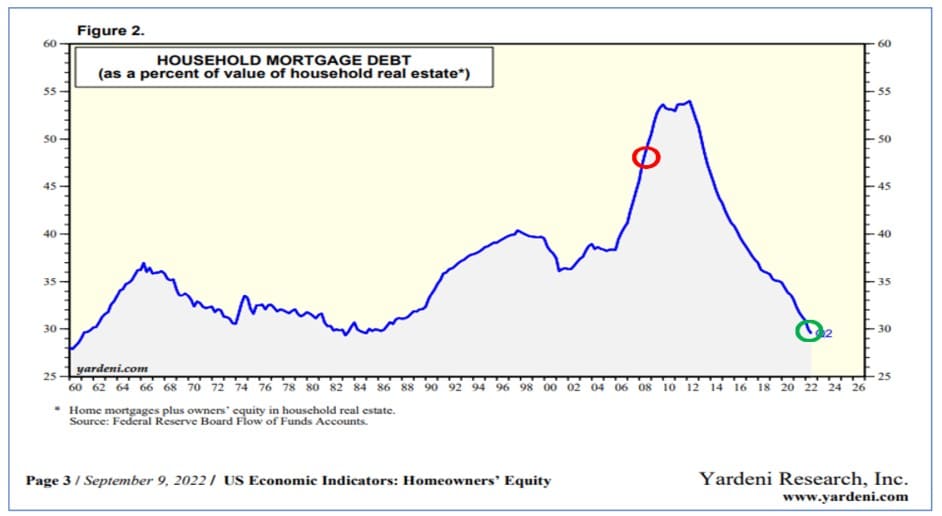
One of the main issues of the Housing Crisis was the lack of restrictions on credit. Many homeowners used their houses like ATMs. Homeowner Equity, as measured by the FED, was at 55% in 2007. Today, Homeowner Equity is at 30-year highs of over 70%.
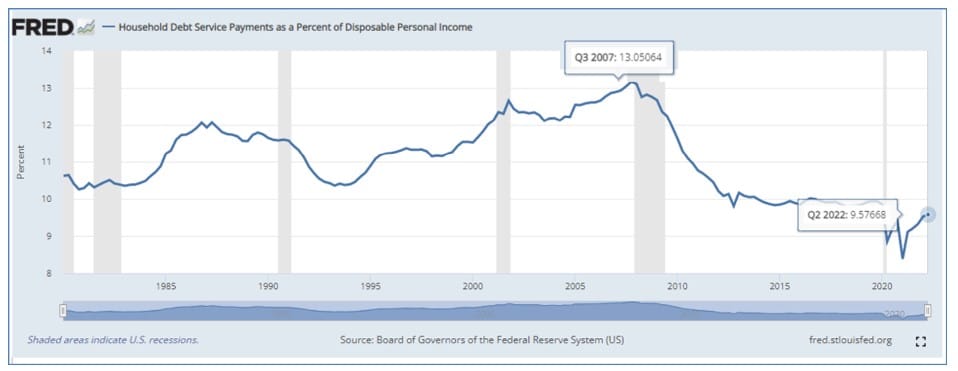
- Household Debt
The FED chart below shows that Household Debt, another piece of the 2008-2009 crisis, is also much different than in 2007. In October 2007, Household Debt as a percent of Household Income was over 13%. Today it is near a 40 year low of 9.5% or 26% lower than in 2007.
Also, the chart below from Yardeni Research shows that Household Mortgage Debt as a percentage of the value of Household Real Estate is also at 40-year lows.
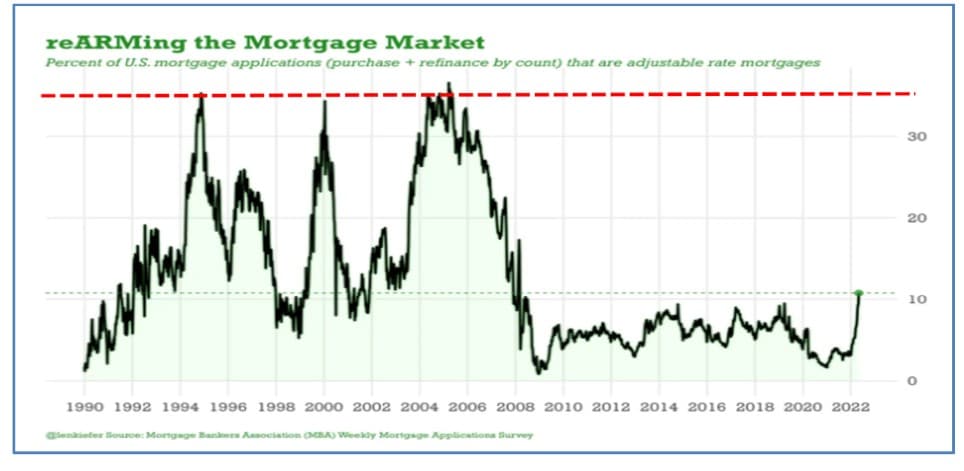
- Adjustable-Rate Mortgage Fears
A huge element of the 2008-2009 crisis was the number of adjustable-rate mortgages. These allowed people who really could not afford their homes to buy them as they counted on an ever-increasing level of home prices. When the rates reset at much higher levels, these people could no longer afford their payments. The chart below shows that, even though variable-rate mortgages have increased in number, the percentage of variable-rate mortgages is still far below the 16-year period between 1990 and 2006. The 10% figure today is 69% below the 33% that existed in 2007.
The data shows that unlike 2007, supply far outweighs demand, people have very high levels of home equity, household debt is at the low end of historic levels, and most homeowners have locked in low fixed rates. The ingredients that made up the recipe for disaster in 2007, do not exist in 2022.


Jeff Marcus founded Turning Point Analytics (TPA) in 2009 after 25 years on trading desks and 13 years as a head trader to provide strategic and technical research to institutional clients. Turning Point Analytics (TPA) provides a unique strategy that works as an overlay to clients’ good fundamental analysis. After 10 years of serving only large institutions, TPA now offers its research services to mid and small managers, RIA’s, and wealthy sophisticated individuals looking for a way to increase their returns and outperform their peers.
Subscribe 2 Week Trial
Customer Relationship Summary (Form CRS)