


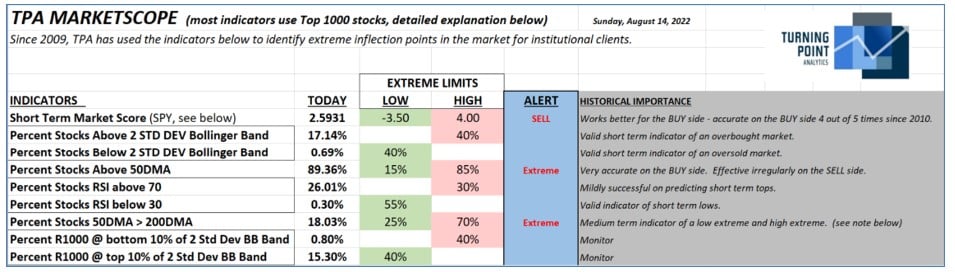
TPA Marketscope is showing conflicting alerts. The percent of Russell 1000 stocks trading above their 50DMA is now 89%. A reading over 85% is a historical extreme. This is in stark contrast with the longer-term indicator of the percent of stocks trading 50DMA>200DMA, which connotes a long-term uptrend. This alert has been at an extreme for long-term uptrends since 6/26/22. So, it would seem, at first blush, that the market is now short-term overbought and long-term oversold, but TPA states in the Marketscope that the percent of stocks trading above their 50DMA is a very good short-term buy indicator, but is an inconsistent sell indicator.
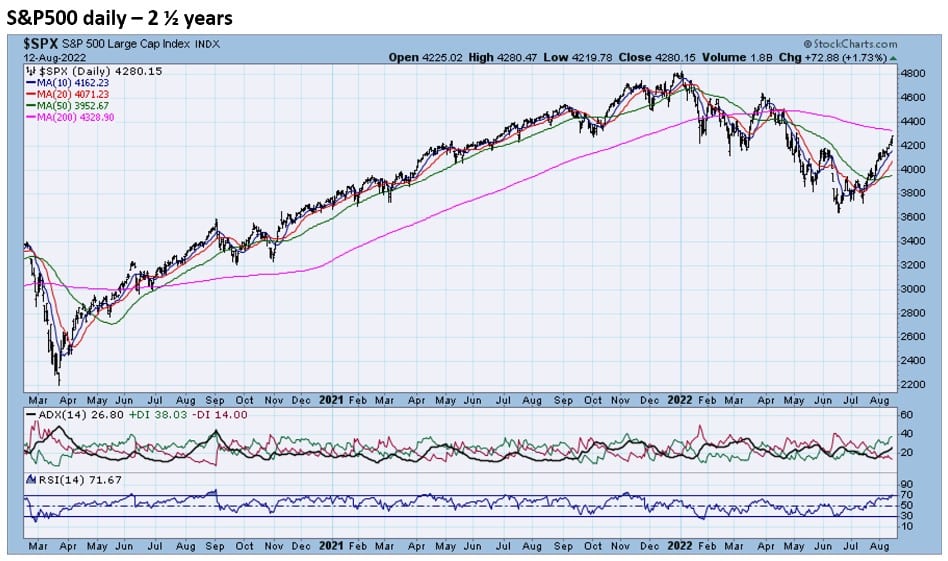
Clients should be careful, since the S&P500’s RSI stands at 72; indicating this is not the place to be aggressive. Still, given the long-term extreme that still shows stocks being oversold and TPA-RRG’s reports showing a huge shift from value to growth, clients should give the percent of stocks above the 50DMA much less weight. TPA still sees stocks moving higher over time.


Jeff Marcus founded Turning Point Analytics (TPA) in 2009 after 25 years on trading desks and 13 years as a head trader to provide strategic and technical research to institutional clients. Turning Point Analytics (TPA) provides a unique strategy that works as an overlay to clients’ good fundamental analysis. After 10 years of serving only large institutions, TPA now offers its research services to mid and small managers, RIA’s, and wealthy sophisticated individuals looking for a way to increase their returns and outperform their peers.
Subscribe 2 Week Trial
Customer Relationship Summary (Form CRS)