


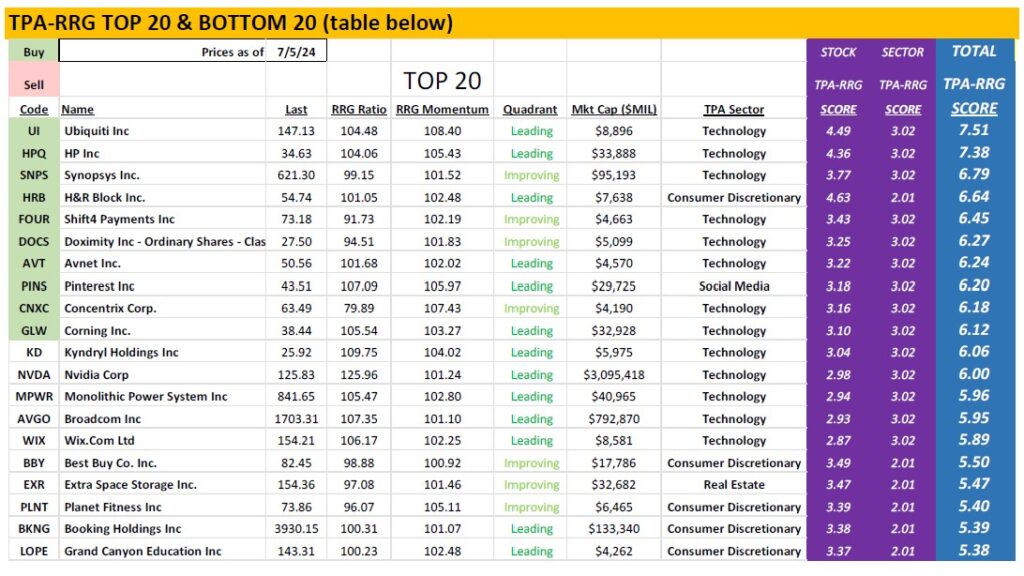
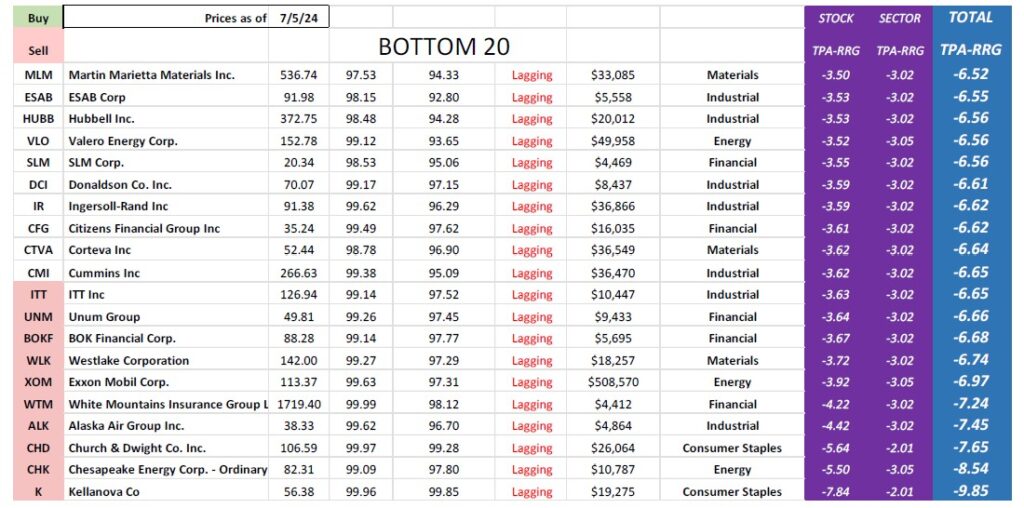
Click on any image below for the entire TPA-RRG Report!

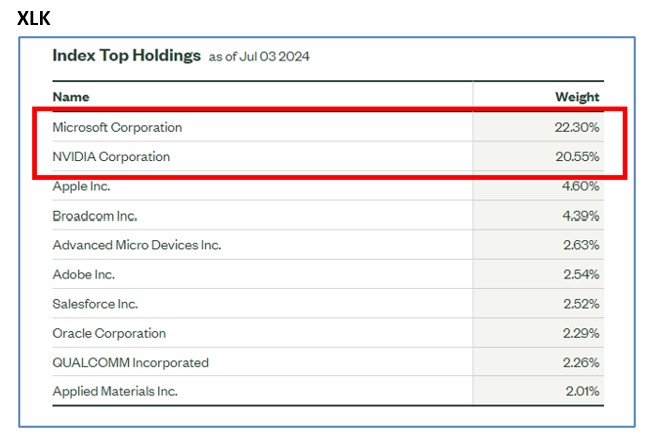
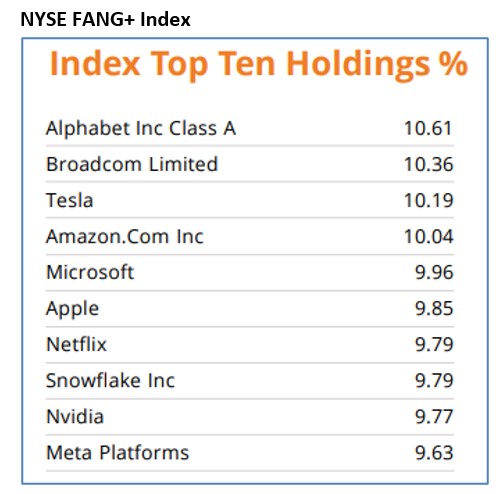
XLK is comprised of mostly MSFT and NVDA, so another TECH index may be more helpful for our analysis. NYSE FANG includes GOOGL, AVGO, TSLA, AMZN, MSFT, AAPL, NFLX, SNOW, NVDA, and META.
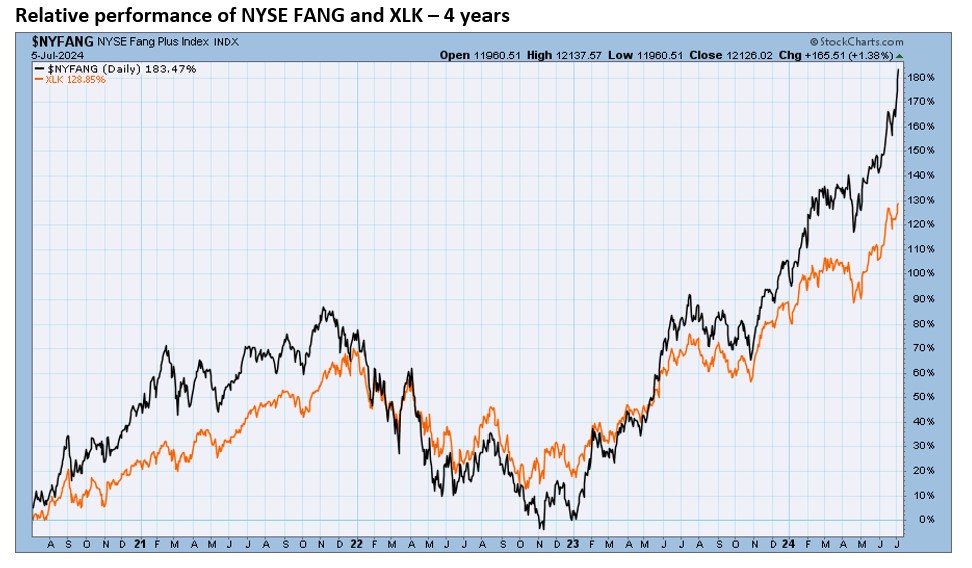
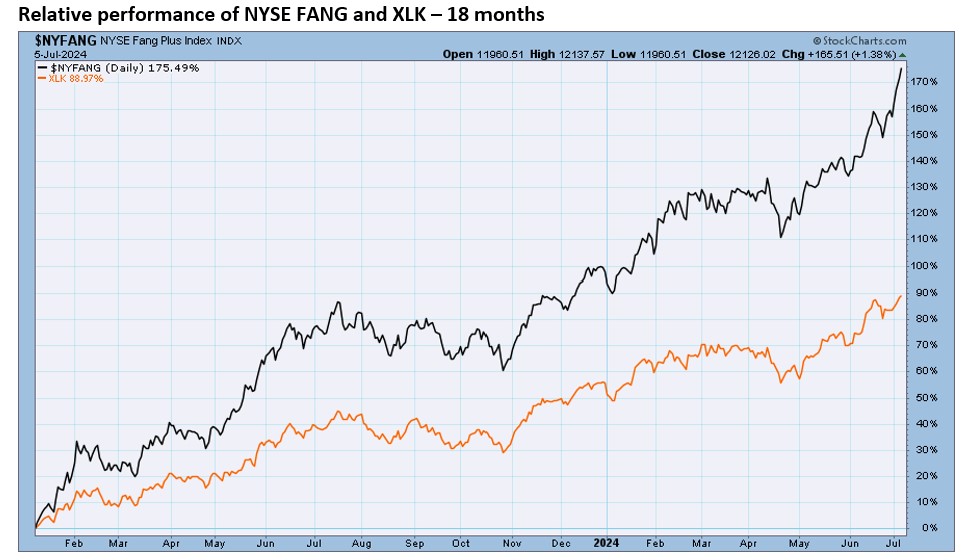
If we compare NYSE FANG and XLK, we see that in the past year, FANG has pulled ahead. The second chart below shows that FANG has outperformed XLK by 86.52% net (175.49% – 88.97%) in the past 18 months. FANG’s performance was 97% greater than XLK in the past 18 months.
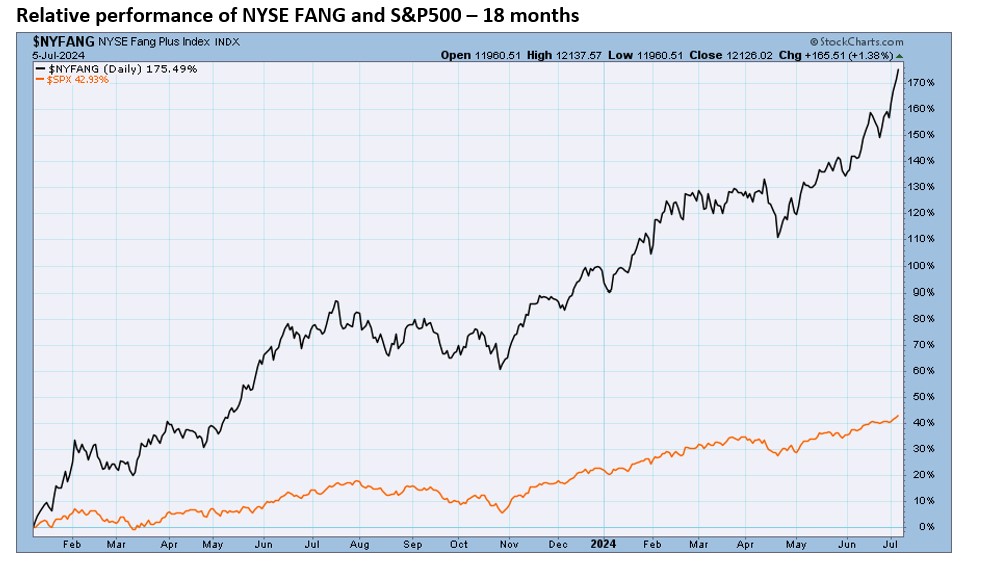
Finally, let’s look at FANG compared to the market benchmark S&P500 in the past 18 months. FANG’s performance in the past 1 ½ years is more than 4 times greater than the S&P500 (175.49% versus 42.93%). This is a historical aberration.


Jeff Marcus founded Turning Point Analytics (TPA) in 2009 after 25 years on trading desks and 13 years as a head trader to provide strategic and technical research to institutional clients. Turning Point Analytics (TPA) provides a unique strategy that works as an overlay to clients’ good fundamental analysis. After 10 years of serving only large institutions, TPA now offers its research services to mid and small managers, RIA’s, and wealthy sophisticated individuals looking for a way to increase their returns and outperform their peers.
Subscribe 2 Week Trial
Customer Relationship Summary (Form CRS)