


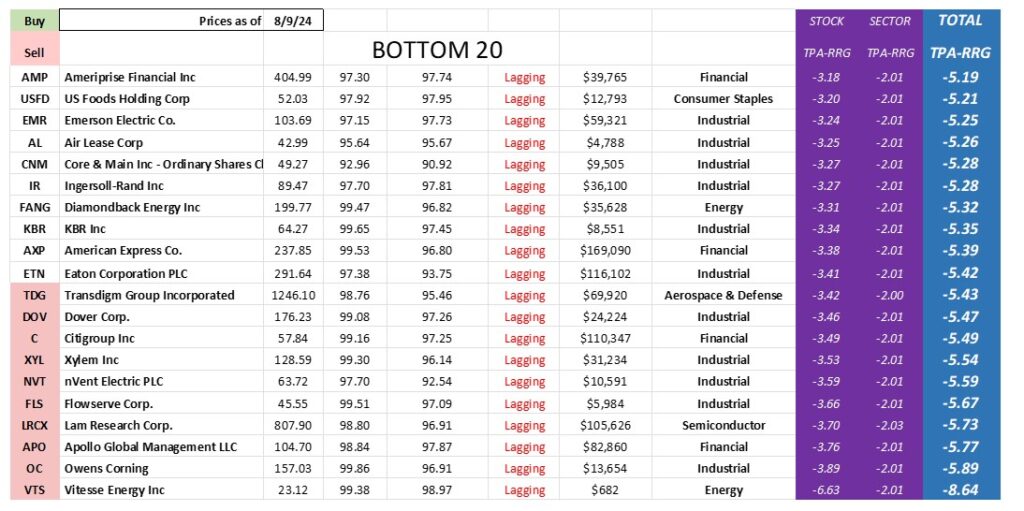
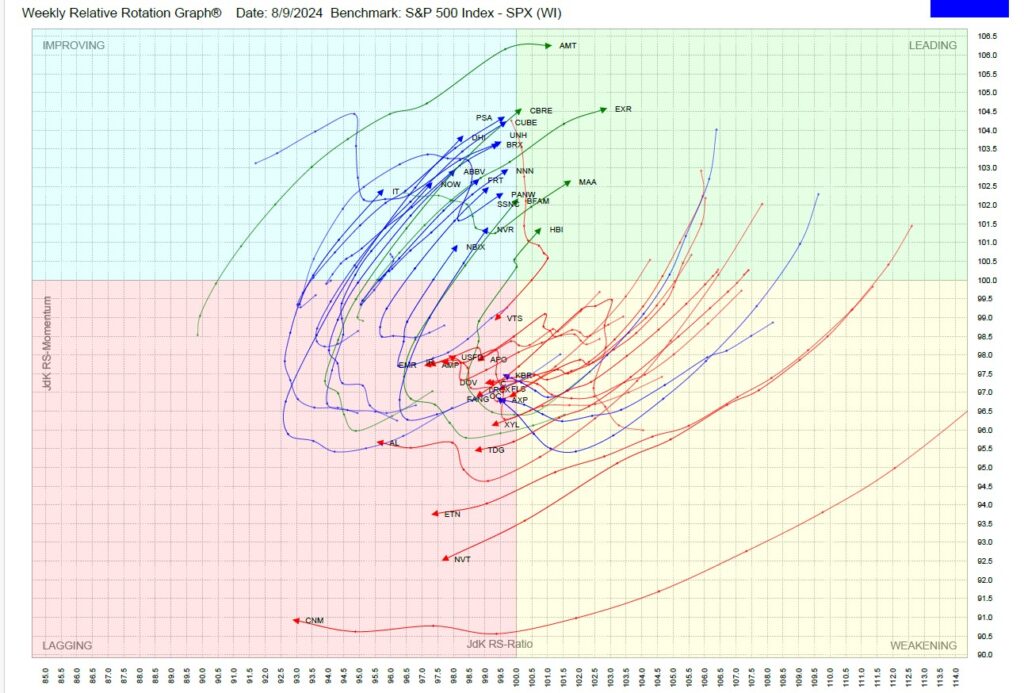
Click on any image below for the entire TPA-RRG Report!
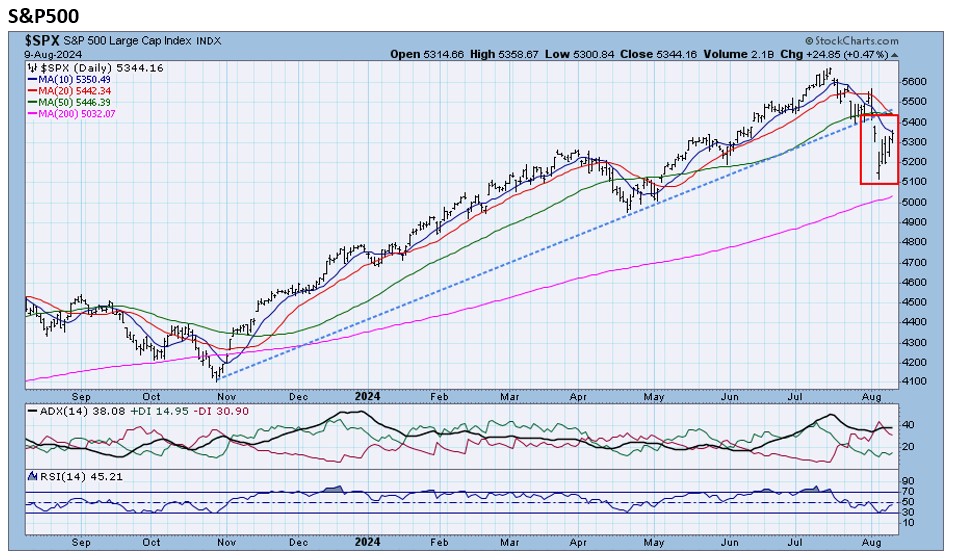
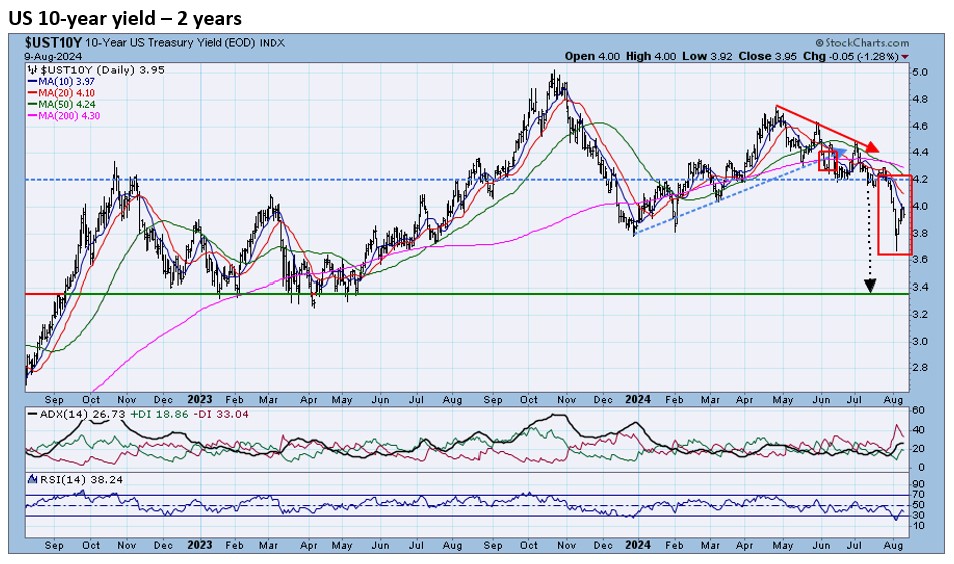
The 4 charts below show that:
- The decline of stocks is not over
- The decline in rates is not over
- Chart 1: The S&P500 broke down through its 9-month uptrend line. It did this on a huge gap-down day, confirming the move.
- Chart 2: The recent rally will run into resistance at the break at about 5370.
- Chart 3: The downtrend in the 10-year yield since late April led to a breakdown below support at 4.20%
- Chart 4: Long-term support for the 10-year is far below Friday’s close of 3.93%; all the way down at 3.4%.
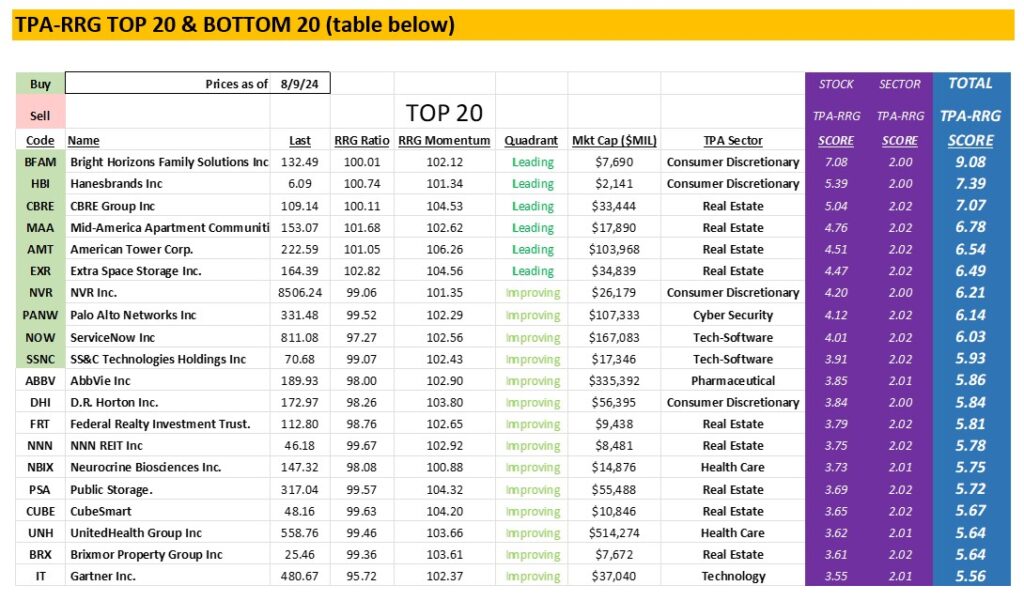
Stocks down and rates down mean that the former stock market leaders will stall, and new leaders will emerge.


Jeff Marcus founded Turning Point Analytics (TPA) in 2009 after 25 years on trading desks and 13 years as a head trader to provide strategic and technical research to institutional clients. Turning Point Analytics (TPA) provides a unique strategy that works as an overlay to clients’ good fundamental analysis. After 10 years of serving only large institutions, TPA now offers its research services to mid and small managers, RIA’s, and wealthy sophisticated individuals looking for a way to increase their returns and outperform their peers.
Subscribe 2 Week Trial
Customer Relationship Summary (Form CRS)