


Sectors
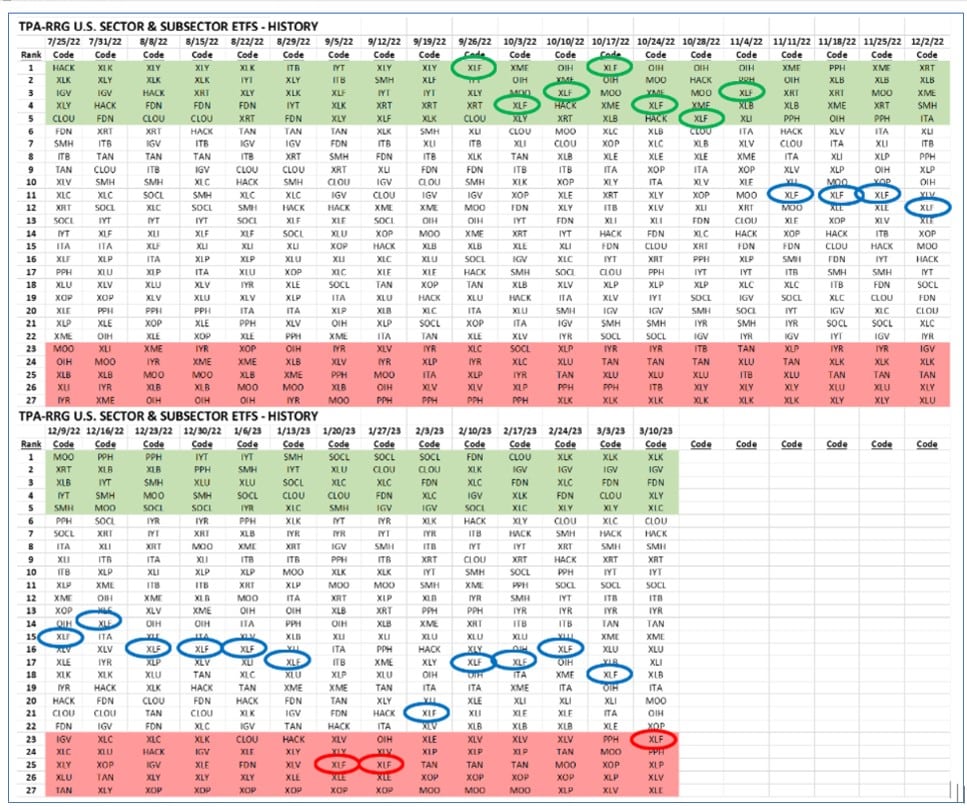
The recent events in the Financial sector are interesting when viewed through the TPA-RRG lens of the last 24 weeks. The sector history table below is provided each week in the TPA-RRG report. It shows the ranking of sectors each week. Note, that the Financials were the top-ranked sector in the 9/26/22 report. Following along with the chart below of XLF/SPY or the relative performance of Financials vs. the overall market, this high rank would give readers the green light to be in Financials until mid-November, when the sector’s relative performance began to wane. Then, in mid-January, the real warning signal came for anyone reading TPA-RRG. This warning would have alerted clients to the dangers that would eventually befall the sector.

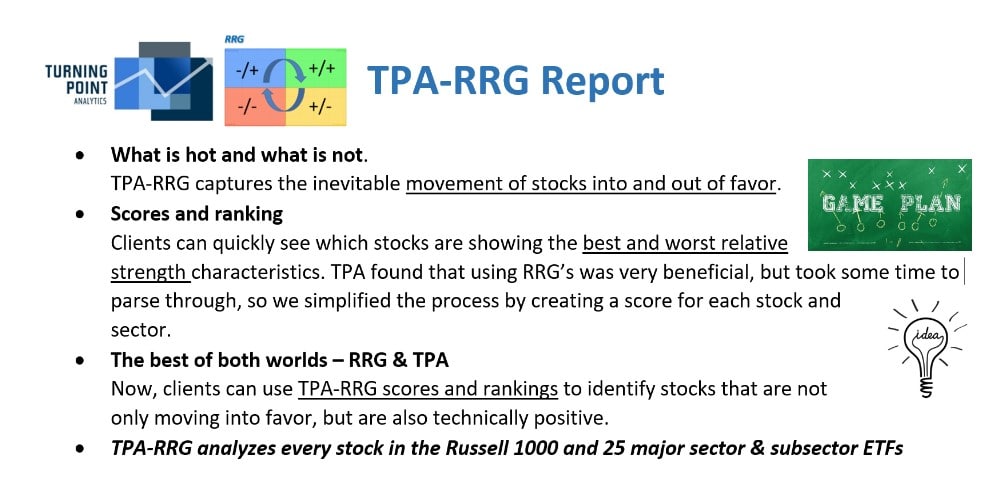
Click on either image below for the entire TPA-RRG Report!


Jeff Marcus founded Turning Point Analytics (TPA) in 2009 after 25 years on trading desks and 13 years as a head trader to provide strategic and technical research to institutional clients. Turning Point Analytics (TPA) provides a unique strategy that works as an overlay to clients’ good fundamental analysis. After 10 years of serving only large institutions, TPA now offers its research services to mid and small managers, RIA’s, and wealthy sophisticated individuals looking for a way to increase their returns and outperform their peers.
Subscribe 2 Week Trial
Customer Relationship Summary (Form CRS)