


Click on any image below for the entire TPA-RRG Report!
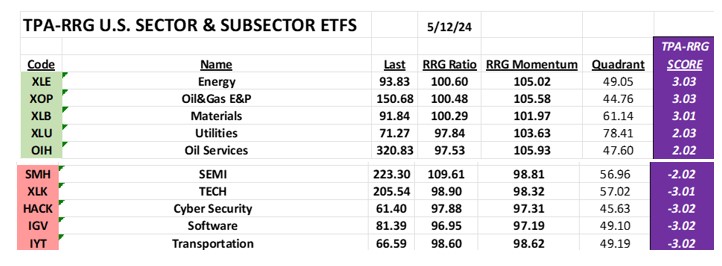
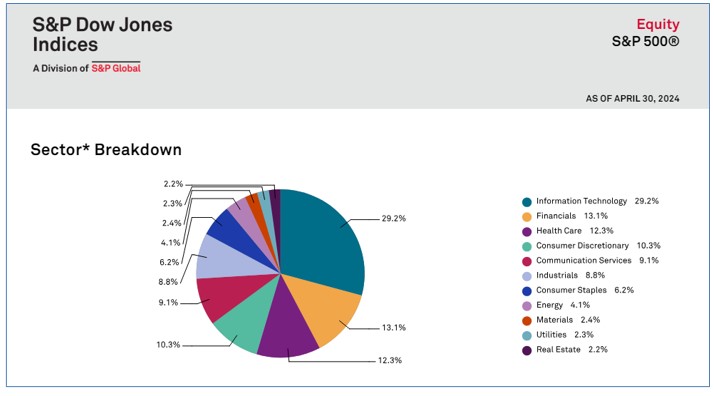
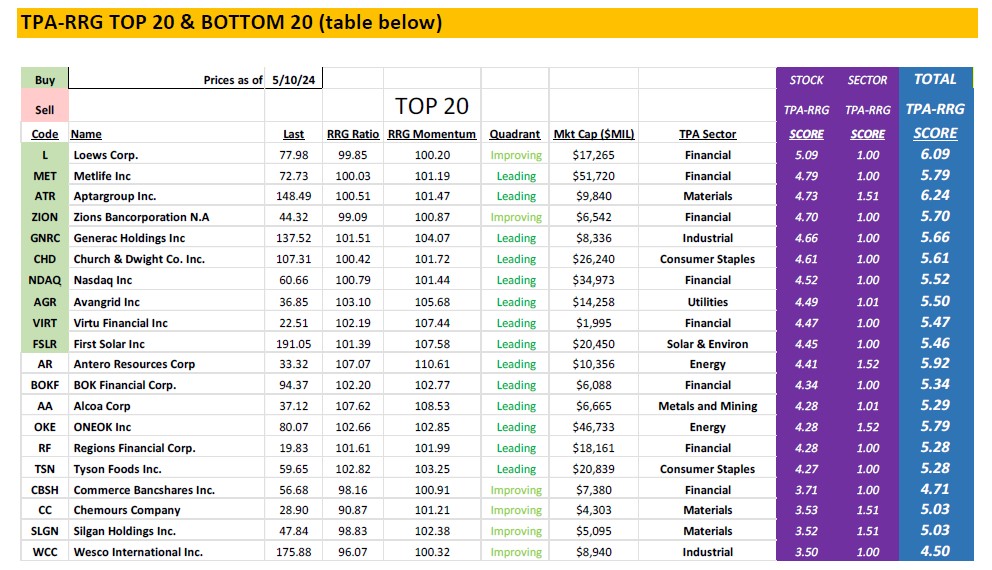
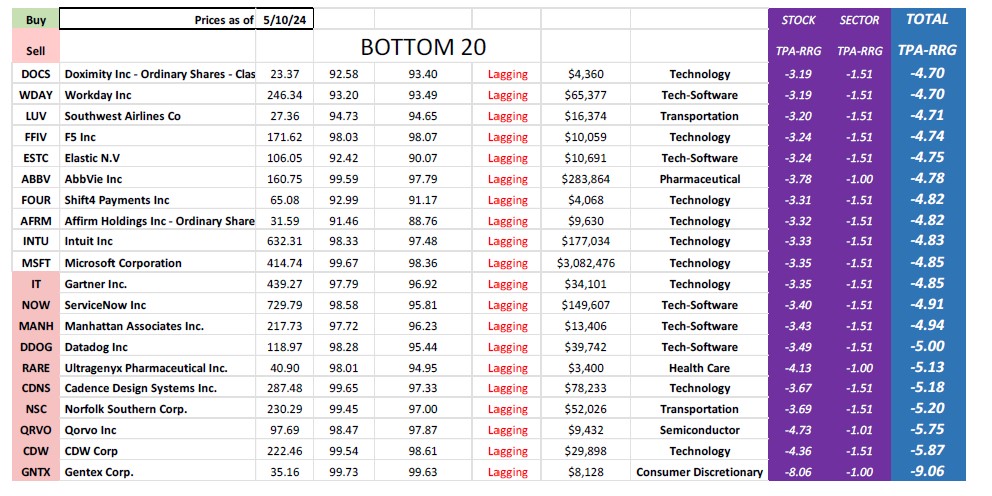
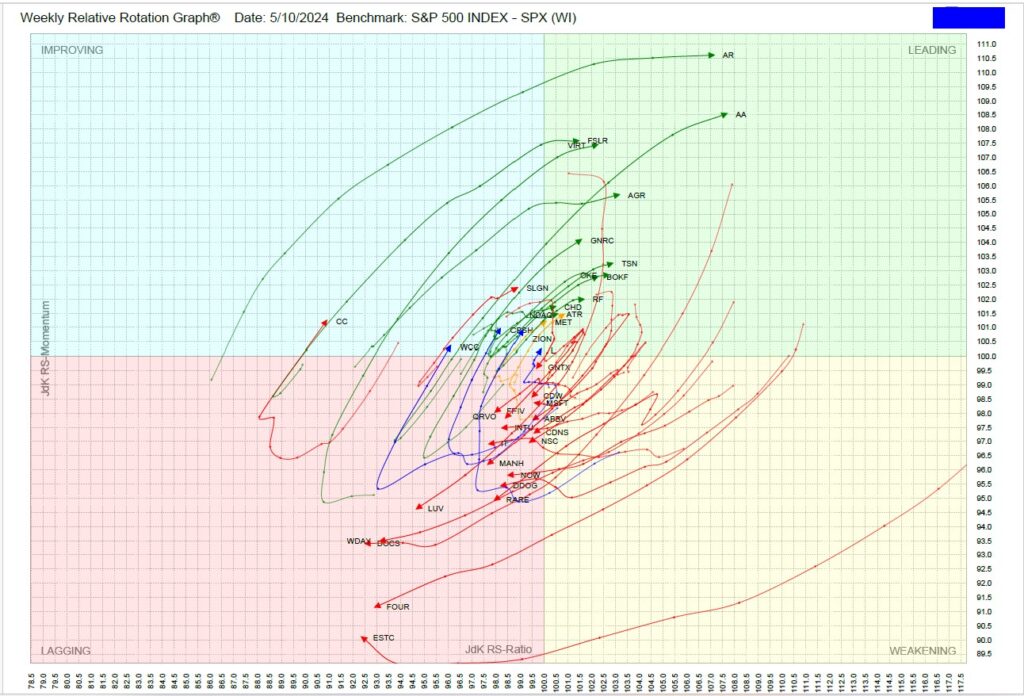
Energy is hot and TECH is not. 3 of the top 5 sectors are Energy. 4 of the bottom 5 sectors are TECH (table below). Unfortunately, if things do not change this may prove a problem for the market since Energy makes up a little over 4% of the S&P500, whereas TECH represents over 29%. (Pie chart below).


Jeff Marcus founded Turning Point Analytics (TPA) in 2009 after 25 years on trading desks and 13 years as a head trader to provide strategic and technical research to institutional clients. Turning Point Analytics (TPA) provides a unique strategy that works as an overlay to clients’ good fundamental analysis. After 10 years of serving only large institutions, TPA now offers its research services to mid and small managers, RIA’s, and wealthy sophisticated individuals looking for a way to increase their returns and outperform their peers.
Subscribe 2 Week Trial
Customer Relationship Summary (Form CRS)