


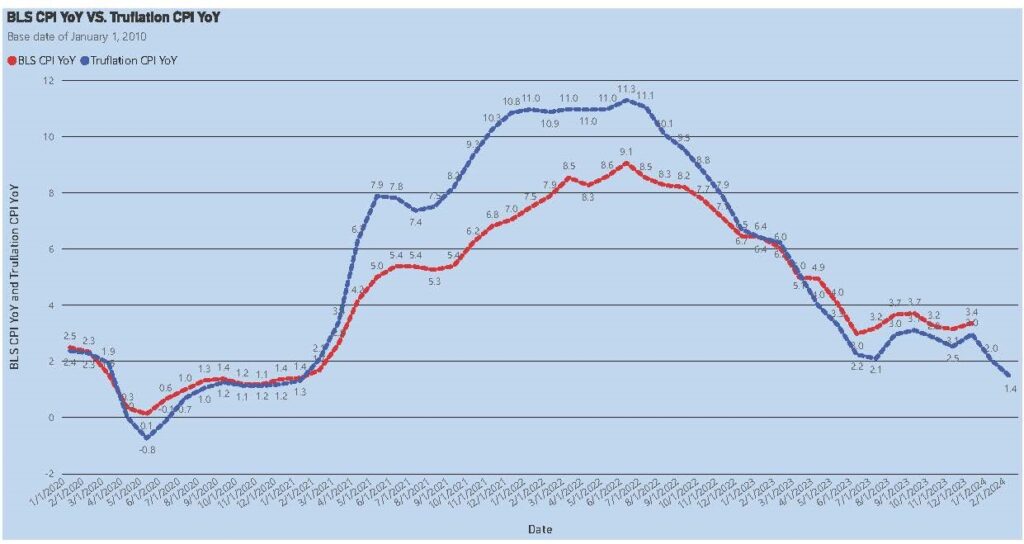
On January 23, we led the Daily Commentary with a couple of paragraphs titled Is Trueflation A Better Gauge Of Inflation? If you want to learn more about the benefits of the Trueflation inflation calculation versus the popular CPI index, check out the article. About three weeks ago, when we wrote it, the Trueflation inflation index was 1.85%. Today, it stands at 1.35%. That is a significant decline in just three weeks! While we believe it’s impossible to measure inflation accurately, following the trends of Trueflation, CPI, and other inflation gauges is paramount to better forecast how the Fed will conduct monetary policy. Clearly, the trend in Trueflation is lower. Will the CPI report, released at 8:30 ET today, follow?
To help answer the question, the graph below compares Trueflation and CPI since 2020. As shown, Trueflation tends to be more volatile than CPI. It accentuates the highs and lows. However, of great importance is that their trends are highly correlated. Per Danielle DiMartino Booth, they have a correlation of .97. If CPI continues to track Trueflation closely, today’s CPI data and or those coming in the next few months could be well below expectations and likely prompt the Fed to ease the Fed Funds rate.
What To Watch Today
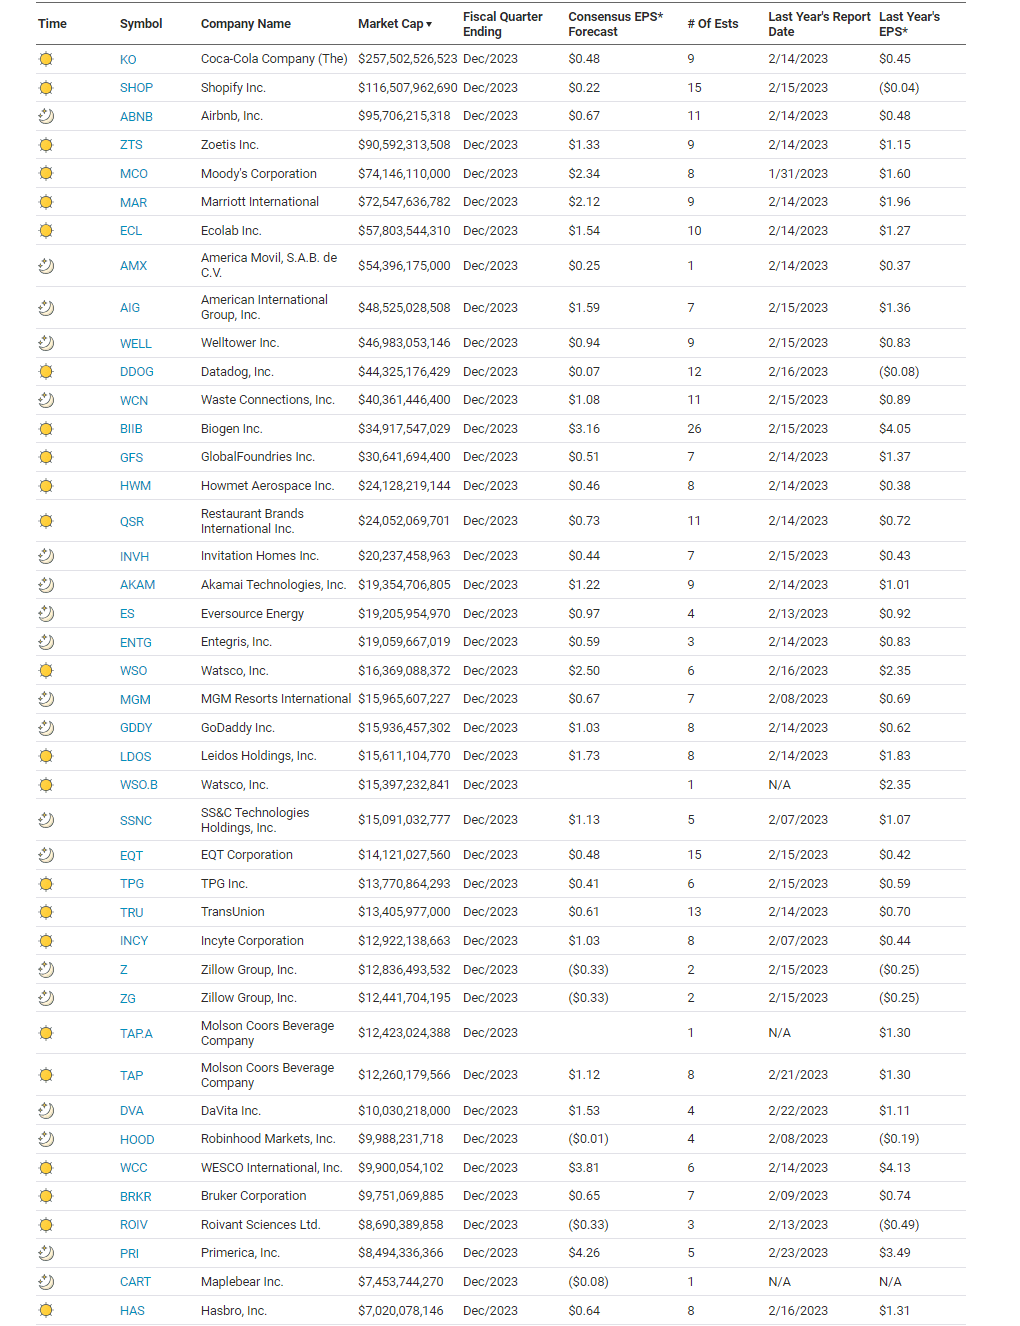
Earnings
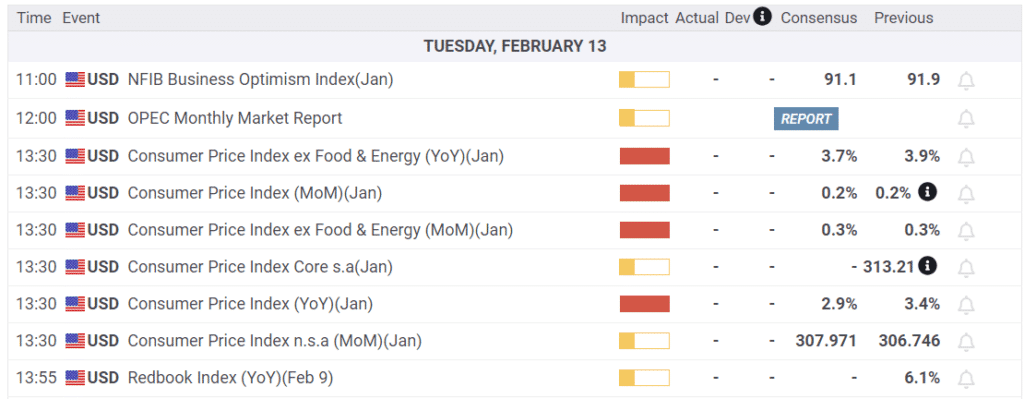
Economy
Market Trading Update
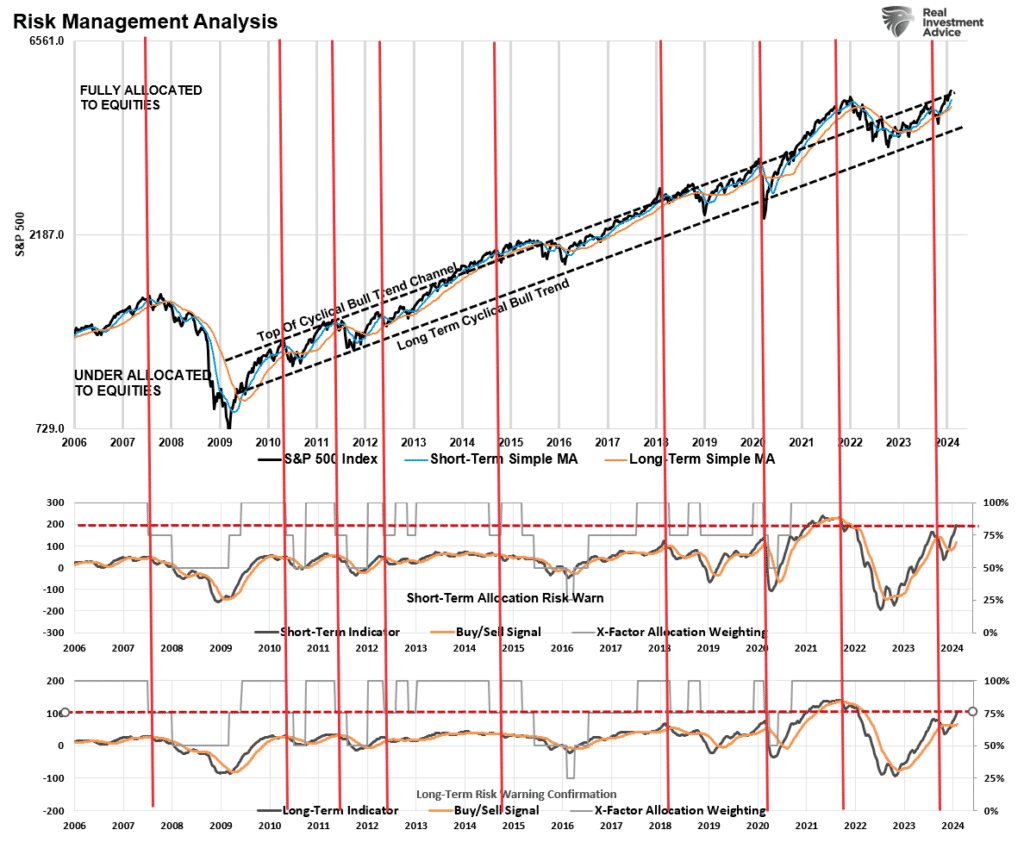
As noted in this past weekend’s newsletter, we began the process of taking profits and rebalancing portfolio risks yesterday. To wit:
“While we have warned of a potential correction over the past couple of weeks, it reminds us much of June and July last year, where similar warnings for a 10% correction went unheeded. As such, we will rebalance exposures next week by taking profits in some positions with significant gains for the year and adding to current positions where we are underweight. We suspect the current environment is much the same as 2022, and the bullish rally will go further to suck the last of the holdouts in. However, we want to make adjustments before the correction comes”
While the changes were minor and only minimally affected portfolio performance, it is the beginning of preparing the portfolio for a period of consolidation or correction. Our weekly market gauge is still on solid buy signals, and it will take some time to trigger an outright sell signal. As such, we want to maintain equity exposure while markets are running. However, with markets becoming well deviated above their running trend line from the Financial Crisis lows and the previously confirmed signals led to decent corrections, we want to start preparing now for what could be a reversal sometime between March and the election.
As noted in yesterday’s commentary, while we are highly confident that a correction is coming, the timing of that event is uncertain. However, once signals are triggered, we will become more aggressive in the risk reduction process.

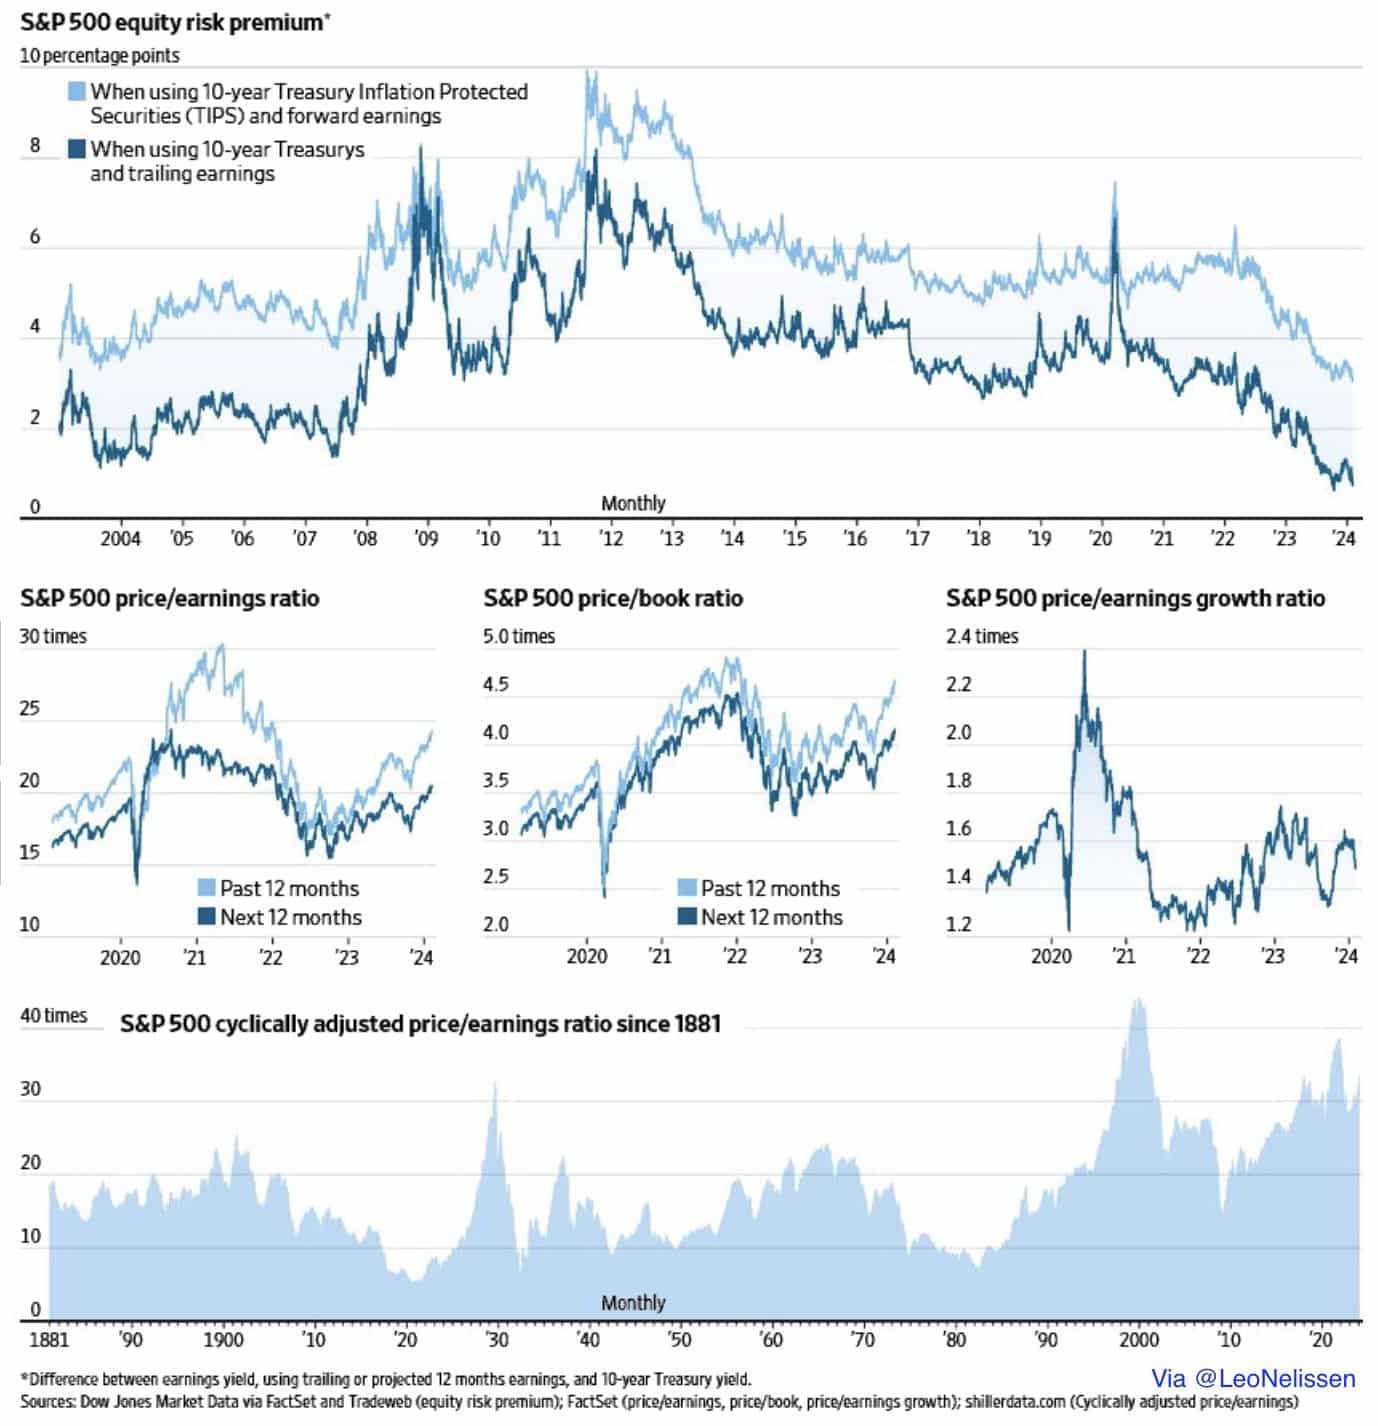
The S&P 500 Is Not Cheap, But It Can Get More Expensive
The comprehensive set of graphs below shows five widely followed measures of valuations for the S&P 500. The top graph, equity risk premiums, shows they are at their most expensive levels in 20 years. However, the four other gauges show valuations are rich but certainly have room to run before they reach their 20-year peaks. The point of sharing this is to remind you that valuations are high. Therefore, future returns may likely be lower, and risks are higher. But, as the saying goes, “Markets can stay irrational for longer than you can stay solvent.”
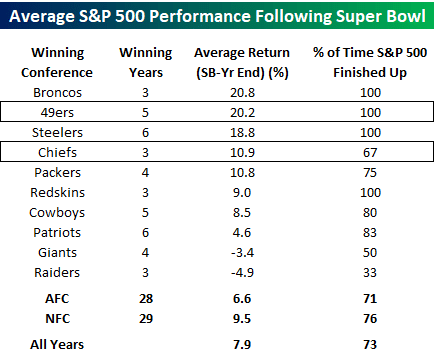
Chiefs Win The Super Bowl, But Investors Were Rooting For The Niners
The Chiefs won for the second time in a row and the third time with quarterback Patrick Mahomes. In their prior three Super Bowl Wins, including Super Bowl IV -1970), the S&P 500 has been up two of the three years. The average return was 10.9%. After Super Bowl wins for the 49ers, the market’s preferred winner, the S&P 500, has been up 100% of the time, offering an average gain of 20.2%.
Further concerning for the superstitious is the following Super Bowl Indicator courtesy of Investopedia:
The Super Bowl Indicator suggests that the championship game of the National Football League (NFC) predicts the direction that the stock market will move that year. According to the theory, if a team from the National Football Conference (NFC) wins the Super Bowl, the markets will rise, but a victory by the representative of the American Football Conference (AFC) foretells a year of market declines.
The indicator makes the headlines this time every year. However, we caution you not to read too much into it. In statistics, we call such a relationship between non-related events a spurious correlation.
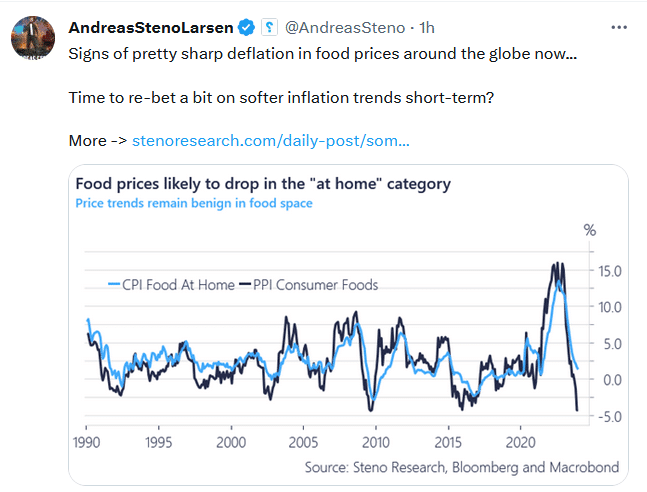
Tweet of the Day
“Want to have better long-term success in managing your portfolio? Here are our 15-trading rules for managing market risks.”
Please subscribe to the daily commentary to receive these updates every morning before the opening bell.
If you found this blog useful, please send it to someone else, share it on social media, or contact us to set up a meeting.
Post Views: 0
2024/02/13