


Two-year Treasury note yields neared 3.50% yesterday, the highest level since 2007. At that time, a series of interest rate hikes by the Fed, which brought Fed Funds from 1% to 5.25%, were starting to dampen real estate prices. As a result, the Fed had just started to reduce interest rates. Many investors thought the Fed’s new easing campaign would avoid problems. Few appreciated the magnitude of the debt excesses built over the prior five years and the fact that it can take six to nine months before the effects of higher yields are truly felt.
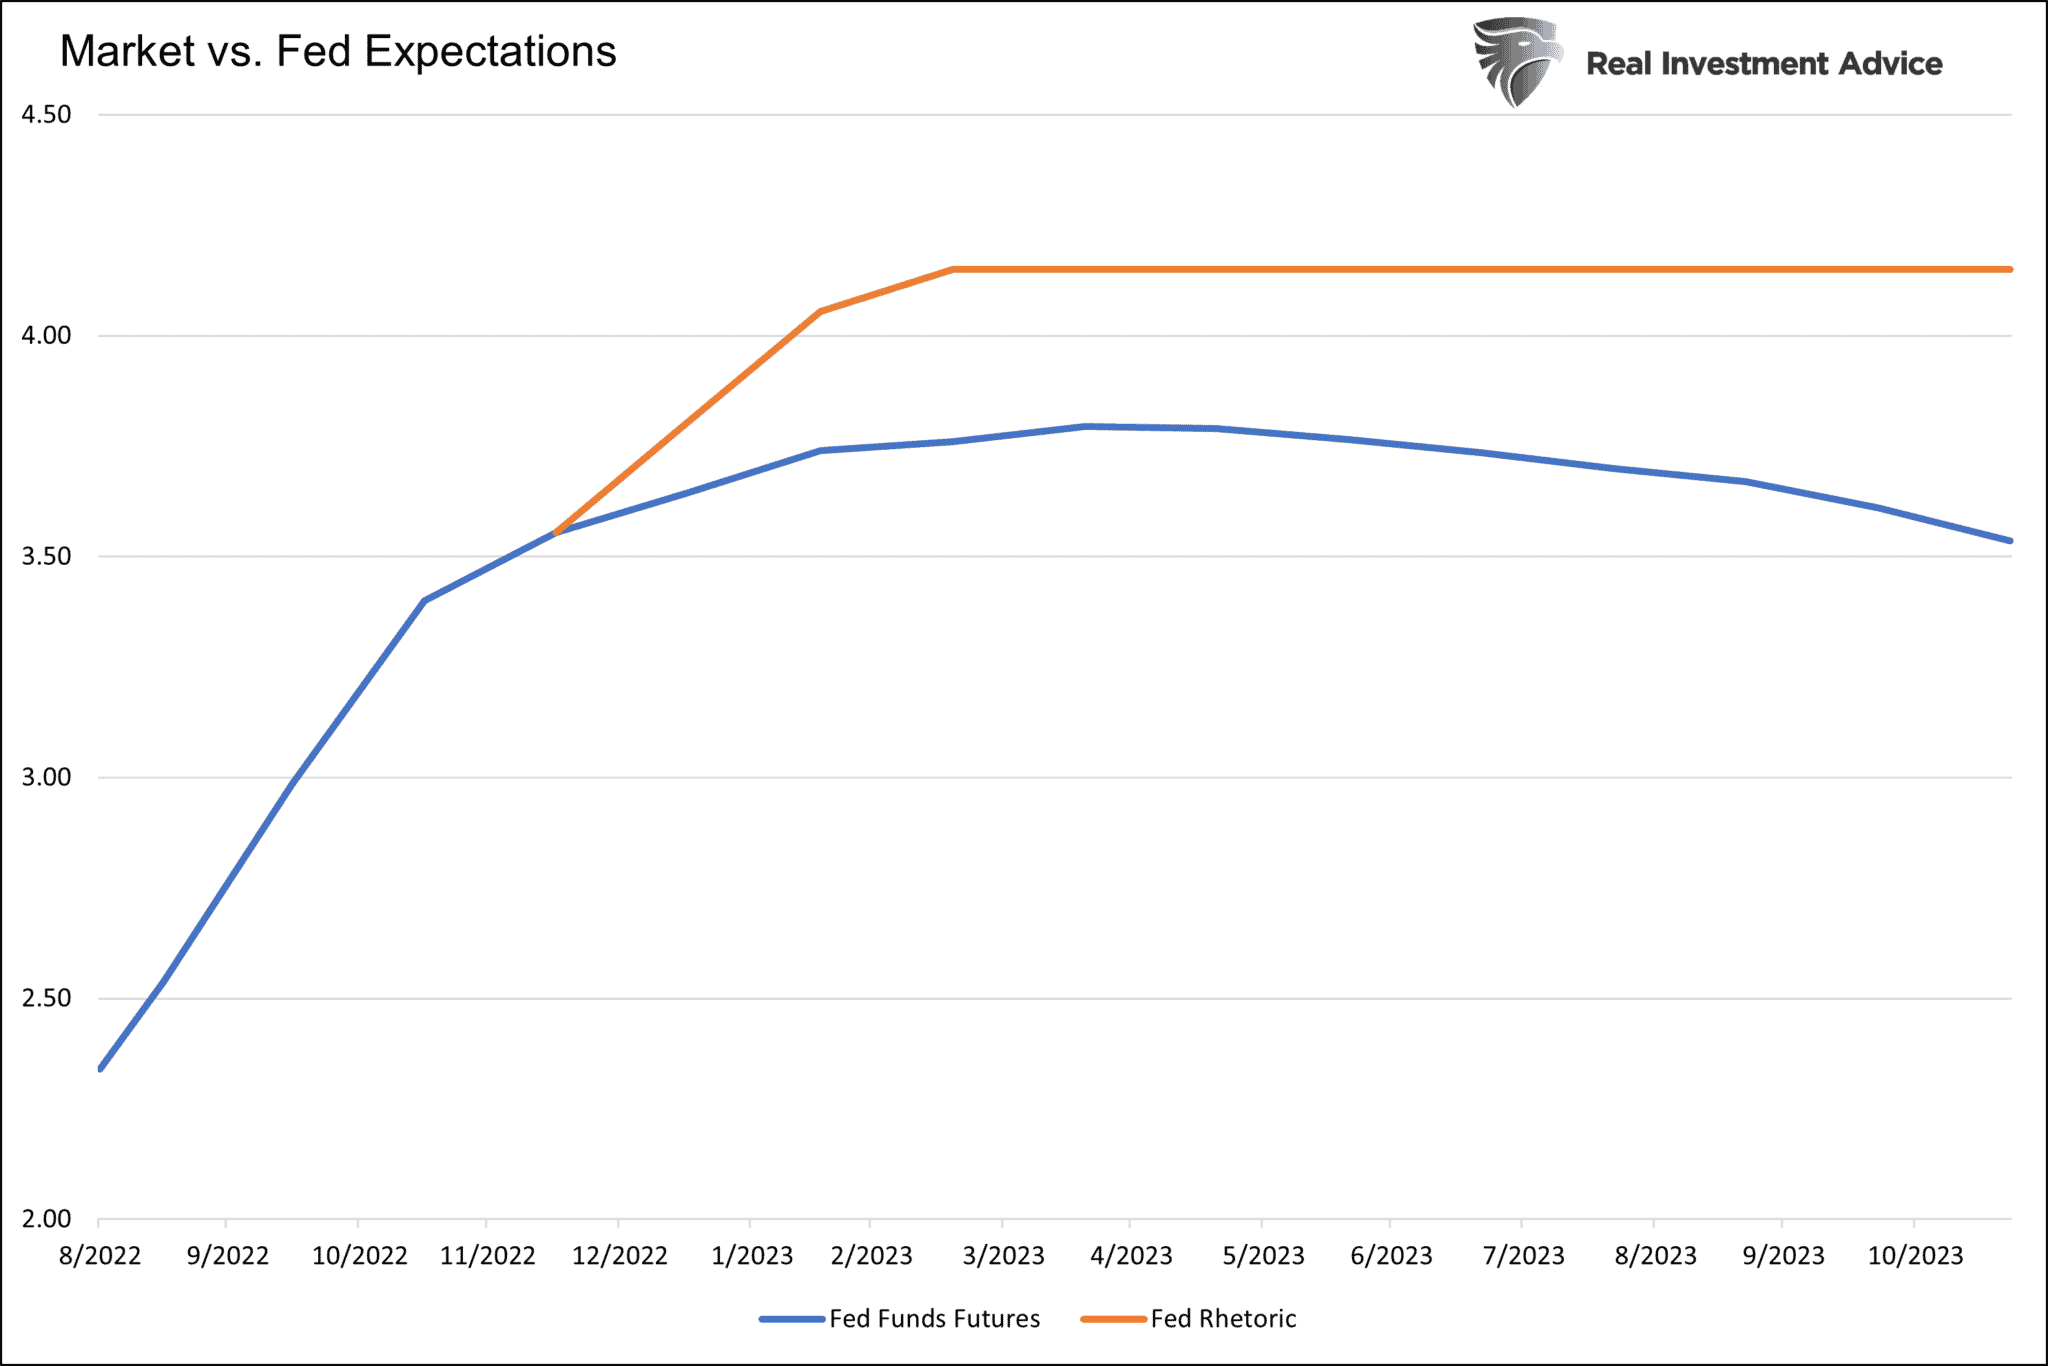
Two-year yields were slightly over 1% six months ago. Now, those yields are higher by almost 2.5% since then. The associated economic effects of higher yields are just beggining to be felt. The problem we potentially face is the Fed is determined to keep fighting inflation despite not appreciating how prior rate hikes will weigh on the economy. As such, the market doesn’t believe the Fed will forsake the economy to fight inflation. The graph below shows the disconnect between Fed policy plans and market expectations. The Fed may regret its rhetoric and actions in six to nine months. Today, however, they feel it is necessary to end high inflation.


What To Watch Today
Economy
- 9:00 a.m. ET: FHFA House Pricing Index, month-over-month, June (0.8% expected, 1.4% prior)
- 9:00 a.m. ET: House Price Purchasing Index, quarter-over-quarter, Q2 (4.6% prior)
- 9:00 a.m. ET: S&P CoreLogic Case-Shiller 20-City Composite, month-over-month, June (0.90% expected, 1.32% prior)
- 9:00 a.m. ET: S&P CoreLogic Case-Shiller 20-City Composite, year-over-year, June (19.20% expected, 20.50% prior)
- 9:00 a.m. ET: S&P CoreLogic Case-Shiller U.S. National Home Price Index, year-over-year, June (19.75% prior)
- 10:00 a.m. ET: Conference Board Consumer Confidence, August (98.0 expected, 95.7 prior)
- 10:00 a.m. ET: JOLTS Job Openings, July (10.375 million expected, 10.698 million prior)
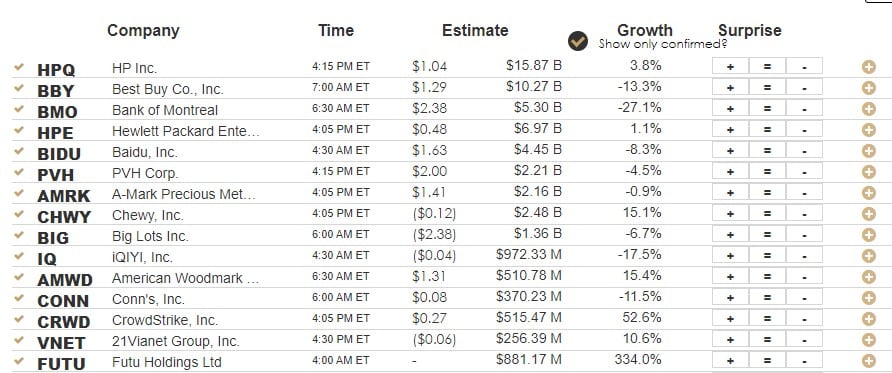
Earnings
Market Trading Update
As noted yesterday morning:
“Given the sharp market sell-off on Friday, some follow-through selling on Monday would be of no surprise.
However, with the markets once again deeply oversold, a reflexive bounce is likely. With the market failing a test of resistance at 4160ish, and with the MACD still on a “sell signal,” we continue to suggest selling any rallies for the time being.“
We saw that yesterday as the market rallied to almost breakeven during the trading session, only to slip into the close as sellers emerged. We continue to suspect a test of the 50-dma is likely, which is critical for the markets to hold. However, for the “bears,” the “head and shoulders” topping pattern is now completed with a failed neckline retest. Until this pattern reverses, we have to assume lower prices, particularly as the Fed remains focused on tightening monetary policies to combat inflation.

Bull or Bear Market?
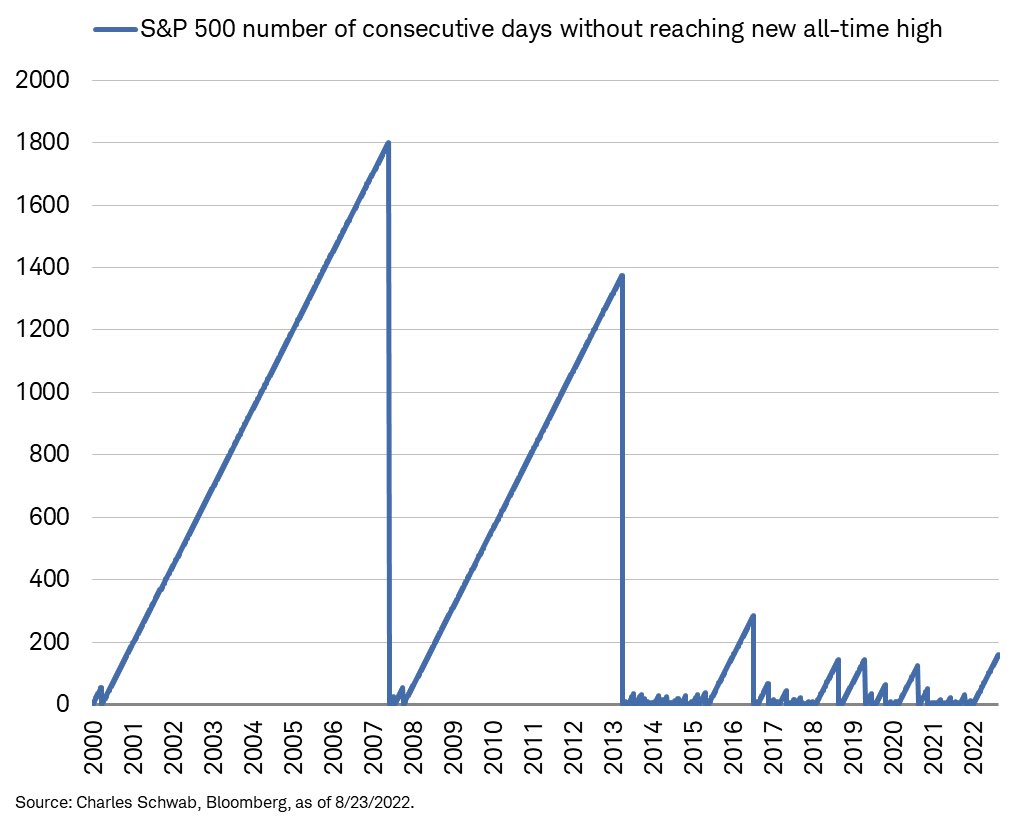
No one knows how this bearish episode plays out, but it is very important to keep considering the bearish case in terms of losses and time as well as the potential upside of the bullish case. To help provide context for the range of possibilities, we share the graph below. It shows that if markets are in a bear market like in 2000 or 2008, we may have a long wait until markets recapture the all-time highs of late 2021. However, new highs could come sooner than expected if this is a stumble like in 2015-2016.
Sector Leadership Is Shifting Again
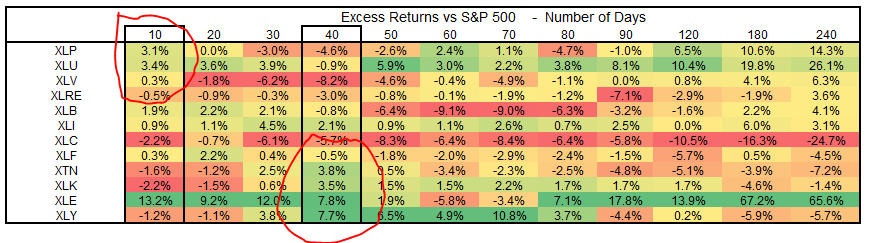
The table below shows each sector’s recent performance versus the S&P 500. During the market decline from January to June, the safer, more conservative sectors tended to lead the way. For instance, look at the excess returns for the past 180 days in the second to last column on the right. Excluding Energy, Utilities and Staples led the way. Now, look at the last 40 days, which saw a strong market except for the previous few days. The worst performing sectors were those that outperformed in the first six months.
With the market falling again, those lower beta, more conservative companies are again in the leader position over the last ten days. Conversely, Discretionary, Technology, and Transportation struggled early in the year and are showing relative weakness over the last ten days. On a side note, Communications remains the year’s worst relative performer and consistently struggles during market declines and rallies.
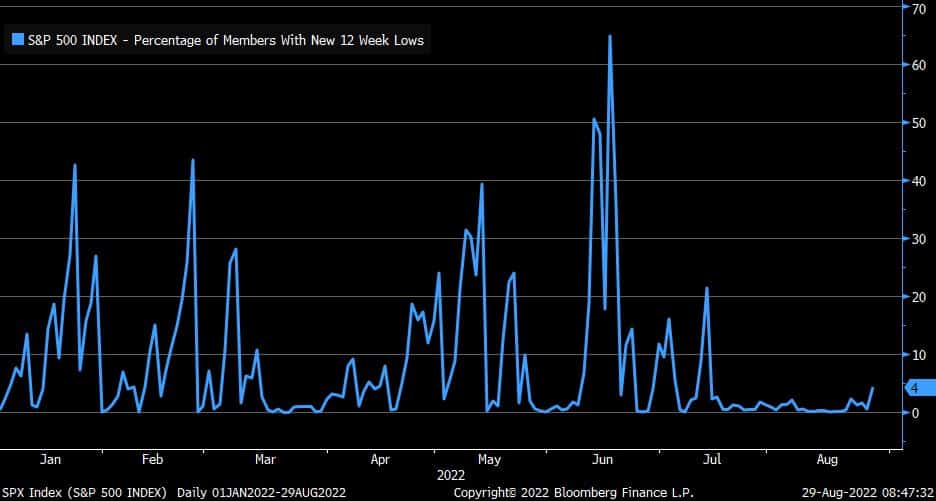
Was Friday’s 3%+ Decline a Washout?
Unfortunately, the answer is not likely. The Bloomberg graph below shows that the capitulation low in June happened when nearly 70% of the S&P 500 was trading at 12-week lows. Similarly, the lows in early May, mid-January, and February also saw the percentage of stocks at 12-week lows rise appreciably. Currently, only 4% of stocks are at their respective 12-week lows.
Tweet of the Day
Please subscribe to the daily commentary to receive these updates every morning before the opening bell.
If you found this blog useful, please send it to someone else, share it on social media, or contact us to set up a meeting.