


Turning Point Analytics utilizes a time-tested, real-world strategy that optimizes the clients entry and exit points and adds alpha. TPA defines each stock as Trend or Range to identify actionable inflection points.
In the short run, the market is a voting machine, but in the long run, it is a weighing machine. – Benjamin Graham
S&P 1500+ DAILY SNAPSHOT COMMENTS & CHARTS Thursday, March 10, 2022
Todays TPA Trend-Range Report included below. TPA Trend-Range Strategy explained below.
Links for Explanations of Technical terms at the bottom of the report
SELL:
TYL fell below its 16-month uptrend line in January and below its 22-month uptrend line in February. TYLs decline since the November 2021 peak is more of an increasingly steep curve than a downtrend line (zoom chart). This puts the next level of long-term support far below Wednesdays close; near the 2019 breakout or 40% lower (weekly chart).
TYL Tyler Technologies Inc. 418.6500 Stop = 445.8623 Target = 313.9875

TYL – zoom

TYL – weekly

SELL:
BLD fell below its 22-month uptrend line in February. The 5.85% rally yesterday merely puts BLD at resistance from the new 2022 downtrend line (zoom chart). Long-term support is 40% below Wednesdays close. The Home Building sector has also broken below its long-term uptrend; portending negatively for BLD.
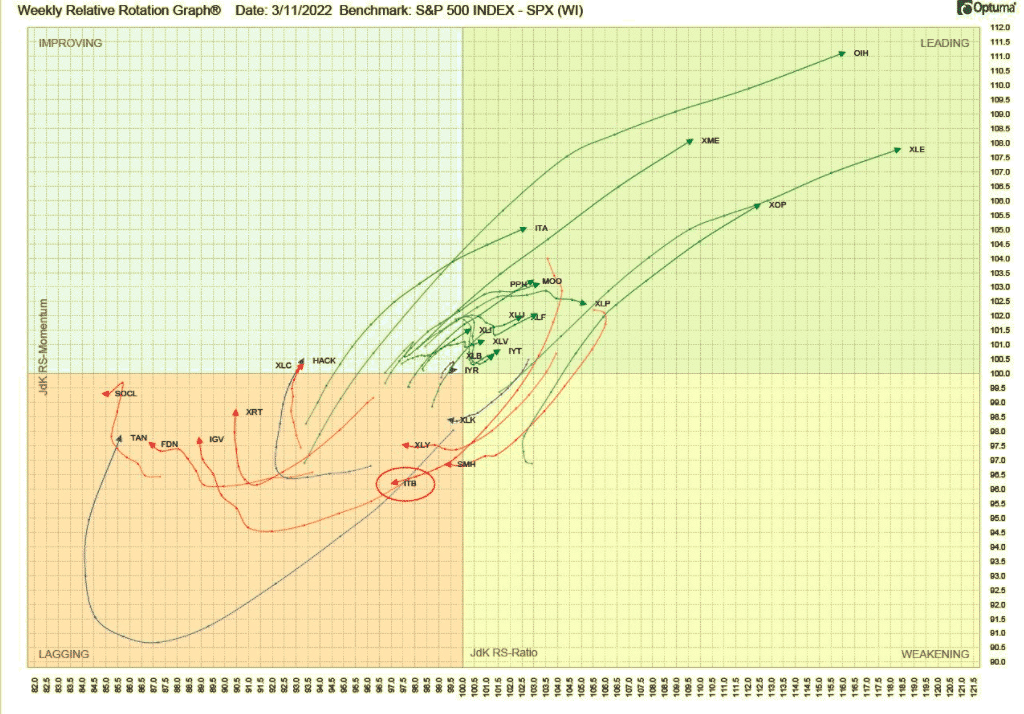
RRG analysis shows that ITB (the Home Building ETF) has moved decidedly into the Lagging quadrant among the 25 major sectors and subsectors.
BLD TopBuild Corp 214.6400 Stop = 228.5916 Target = 160.9800

BLD – zoom

BLD – weekly

ITB – weekly

Relative Rotation Graphs (RRG) explanation video
RRG written explanation
TPA TREND-RANGE STRATEGY (see explanation below)
TPA TREND-RANGE REPORT (New and improved!)


TPA TREND-RANGE STRATEGY EXPLAINED
Alerts:
- Uptrend stocks trading below short term moving averages:
- Possible buy at uptrend support (chart 1)
- Possible sell if medium-term trend break (chart 2)
- Downtrend stocks trading above short-term moving averages
- Possible sell at downtrend resistance (chart 3)
- Possible buy if medium-term trend break (chart 4)
- Range stocks (low trend strength) at the top or bottom 10% of their 2 STD DEV Bollinger Band
- Possible buy at bottom of range (chart 5)
- Possible sell at top of range (chart 6)
Medium-term Trend Strength determined by DMI ADX
Uptrend trend strength & DMI+ > DMI-
Downtrend trend strength & DMI- > DMI+
Range low trend strength
Actionable stocks fit one of the 6 TPA charts at the bottom of this report
TPA looks first to Trend-Range for actionable ideas. Other variables must also be examined including, but not confined to, TPAs ongoing macro investment themes, relative strength compared to the market, sector, and subsector, overbought or oversold characteristics, other technical patterns that may exist, patterns that involve fundamentals or EPS surprise, longer-term support and resistance levels, and longer-term uptrends and downtrend lines.


CLICK ON LINKS BELOW FOR TECHNICAL INDICATOR EXPLANATIONS:
ASCENDING – DESCENDING TRIANGLE
DIRECTIONAL MOVEMENT INDEX (DMI)
MACD-MOVING AVERAGE CONVERGENCE-DIVERGENCE
RELATIVE STRENGTH & PEER STOCK PERFORMANCE
SUPPORT, RESISTANCE, BREAKOUT, BREAKDOWN
Visit TPA at http://www.turningpointanalyticsllc.com/
ALWAYS REMEMBER: No strategy exists in a vacuum always evaluate the relevant sector & market.
Over 80% of portfolio performance is determined by sector and market forces (Ibbotson & Kaplan study January/Febuary2000)
Turning Point Analytics Disclaimer
Turning Point Analytics (TPA) is only one of many tools that an investor should use to make a final investment decision. TPA is an overlay on top of a clients good fundamental or macro analysis. TPA does not create or provide fundamental analysis. The information in this communication may include technical analysis. Technical analysis is a discipline that studies the past trading history of a security while trying to forecast future price action. Technical analysis does not consider the underlying fundamentals of the security in question and it does not provide information reasonably sufficient upon which to base an investment decision. Investors should not rely on technical analysis alone while making an investment decision. Before making an investment decision, investors should consider reviewing all publicly available information regarding the security in question, including, but not limited to, the underlying fundamentals of the security and other information which is available in filings with the Securities and Exchange Commission. The information and analysis contained in reports provided by TPA are copyrighted and may not be duplicated or redistributed for any reason without the express written consent of TPA. The information in this communication is for institutional or sophisticated investors only. By accepting this communication, the recipient agrees not to forward, and/or copy the information to any other person, except as permitted, or required by law. TPA does not guarantee accuracy or completeness. TPA is a publisher of technical research and has no investment banking or advisory relationship with any company mentioned in any report. Reports are neither a solicitation to buy nor an offer to sell securities. Past performance is in no way indicative of future results. Opinions expressed are subject to change without notice. TPA will provide, upon request, the details of any past recommendations. TPAs analysis and recommendations should not be used as the sole reason to buy or sell any security. TPA may compensate brokers and intermediaries for sales and marketing services. You understand and acknowledge that there is a very high degree of risk involved in trading securities and/or currencies. The Company, the authors, the publisher, and all affiliates of Company assume no responsibility or liability for your trading and investment results. It should not be assumed that the methods, techniques, or indicators presented will be profitable or that they will not result in losses. Statements, data, and analysis made by TPA or in its publications, are made as of the date stated and are subject to change without notice. TPA and/or its officers and employees may, from time to time acquire, hold, or sell a position in the securities mentioned herein. Upon request, TPA will furnish specific information in this regard. TPA will not be held liable for losses caused by conditions and/or events that are beyond TPAs control including, but not limited to war, strikes, natural disasters, new government restrictions, market fluctuations, and communications disruptions.


Jeff Marcus founded Turning Point Analytics (TPA) in 2009 after 25 years on trading desks and 13 years as a head trader to provide strategic and technical research to institutional clients. Turning Point Analytics (TPA) provides a unique strategy that works as an overlay to clients’ good fundamental analysis. After 10 years of serving only large institutions, TPA now offers its research services to mid and small managers, RIA’s, and wealthy sophisticated individuals looking for a way to increase their returns and outperform their peers.
Subscribe 2 Week Trial
Customer Relationship Summary (Form CRS)