


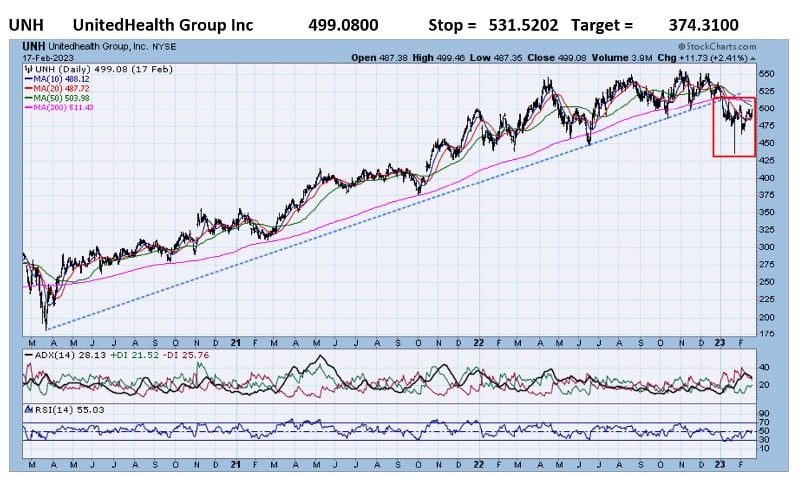
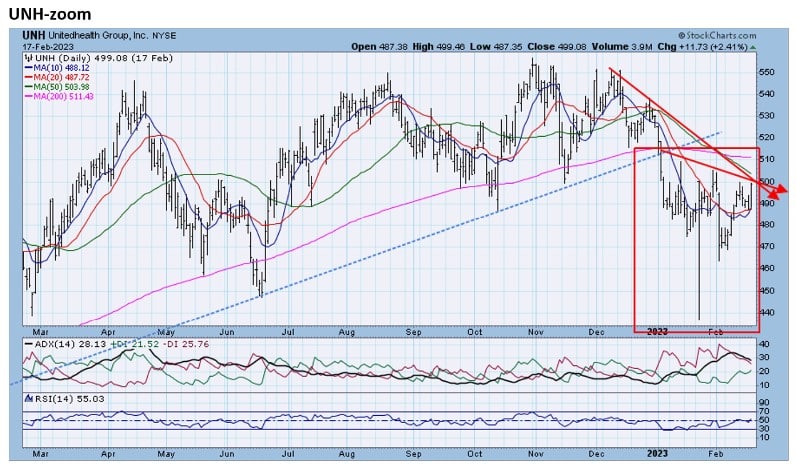
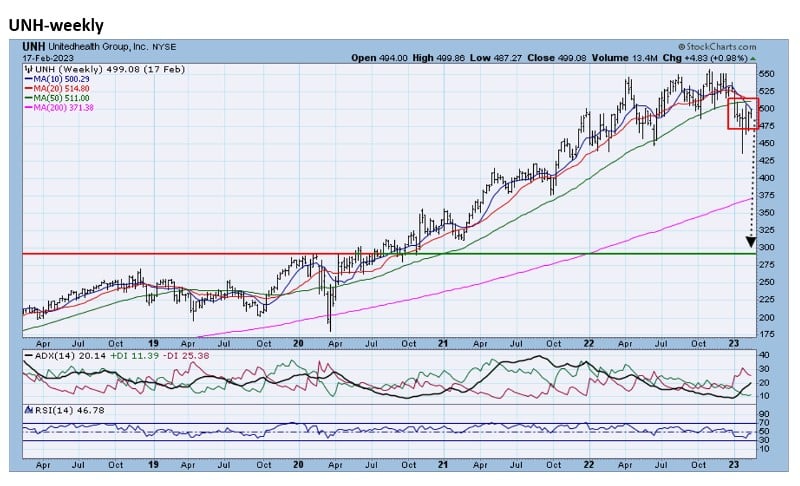
- UNH fell below its formerly consistent 33-month uptrend line at the start of 2023. UNH had rallied 190% from the March 2020 lows to the highs of November 2022. 200DMA support is no longer valid. The zoom chart reveals that UNH has broken down below the 200DMA and that it has established short-term downtrends. The weekly chart shows that this break leaves UNH vulnerable to long-term support, which is far below Friday’s close.
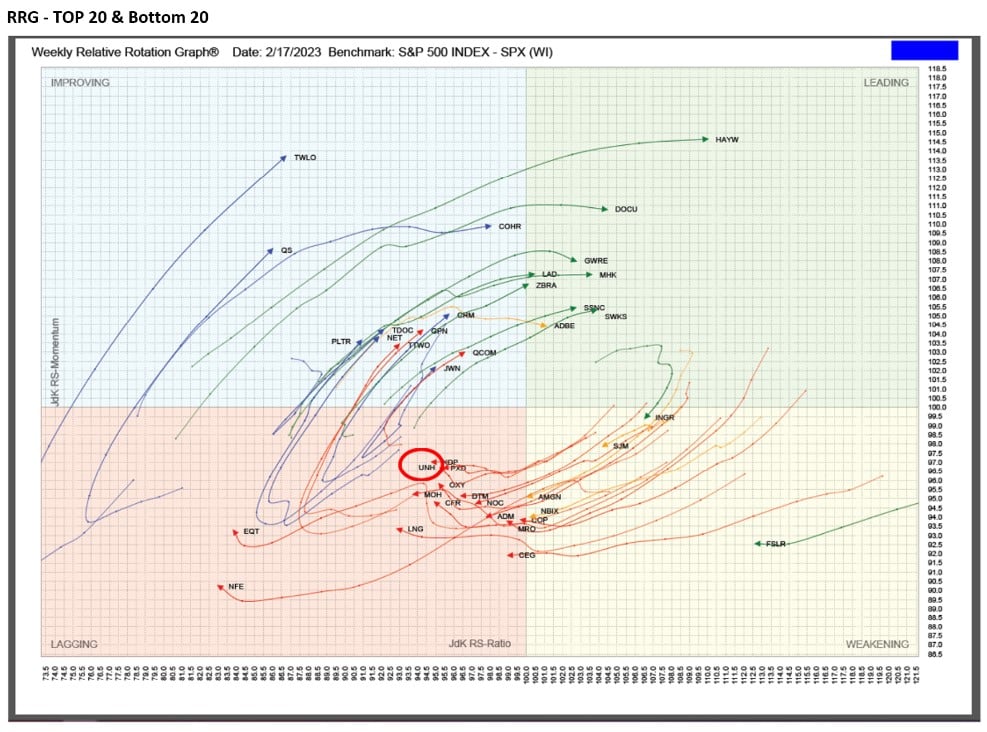
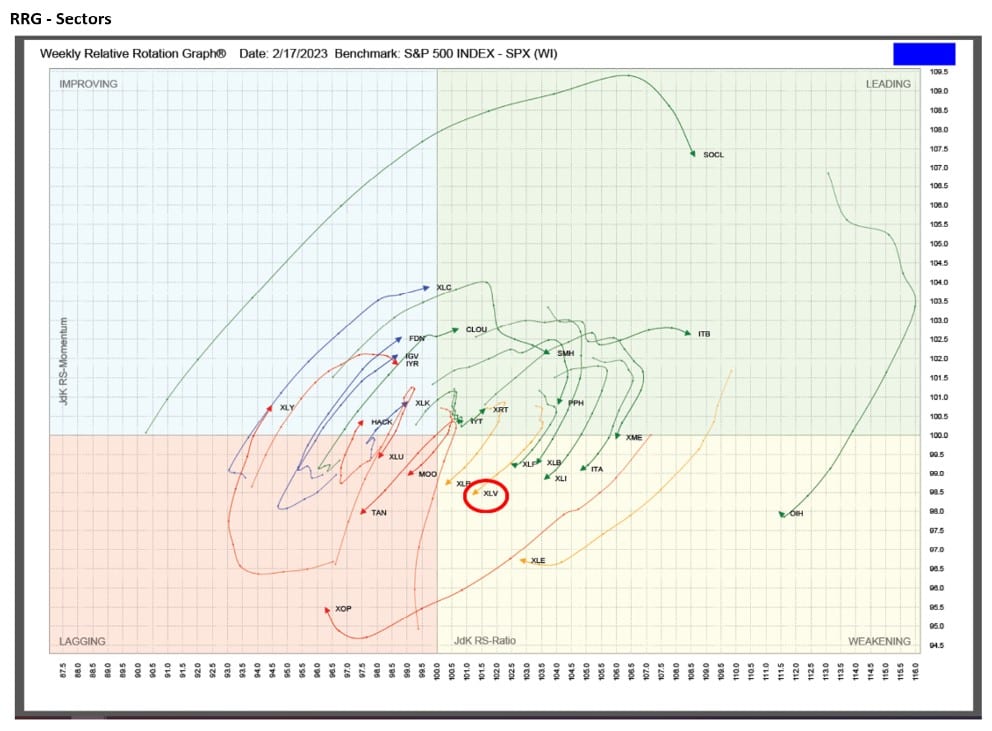
RRG analysis shows that UNH has moved out of the Leading quadrant and is headed toward the Lagging quadrant. Also, Healthcare has moved out of the Leading quadrant and is losing momentum. UNH was one of the Bottom 20 in this week’s TPA-RRG report.
Relative Rotation Graphs (RRG) – explanation video


Jeff Marcus founded Turning Point Analytics (TPA) in 2009 after 25 years on trading desks and 13 years as a head trader to provide strategic and technical research to institutional clients. Turning Point Analytics (TPA) provides a unique strategy that works as an overlay to clients’ good fundamental analysis. After 10 years of serving only large institutions, TPA now offers its research services to mid and small managers, RIA’s, and wealthy sophisticated individuals looking for a way to increase their returns and outperform their peers.
Subscribe 2 Week Trial
Customer Relationship Summary (Form CRS)