


Our goal was to see if history can guide us in determining when an extreme in consensus will provide a high probability time to buy stocks. At the same time, we would like to observe economic data to see if that confirms the timing. Spoiler – consensus extreme should tell investors that if its not time to buy, its probably not time to sell.
We used the following for analysis:
- Stocks = S&P500
- Economic indicators to track (data from Bloomberg)
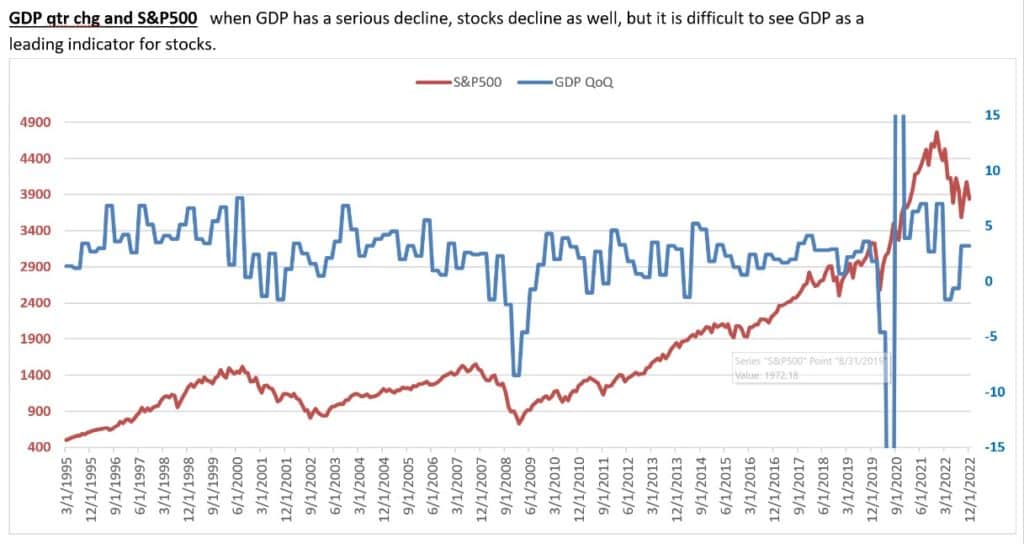
- GDP change (QoQ)
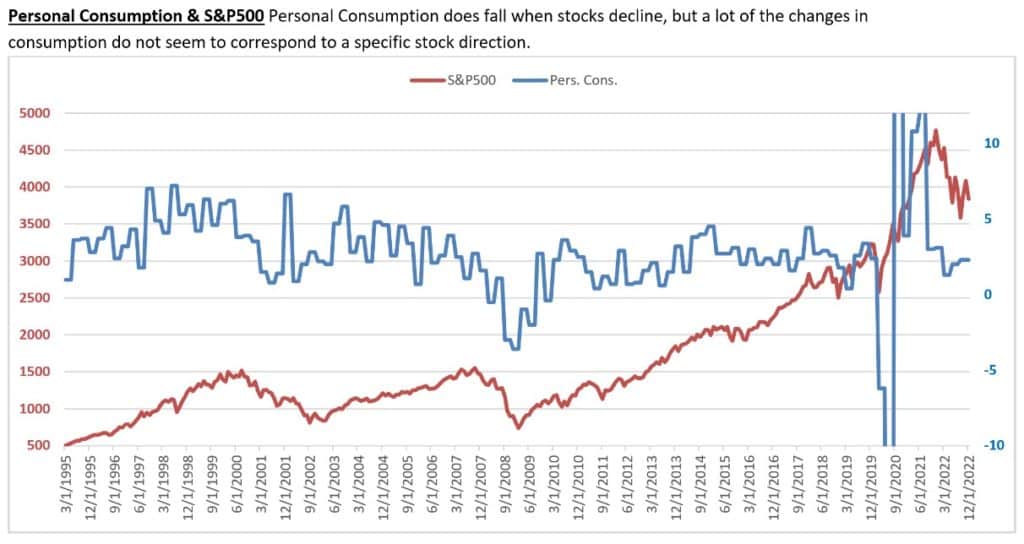
- Personal Consumption
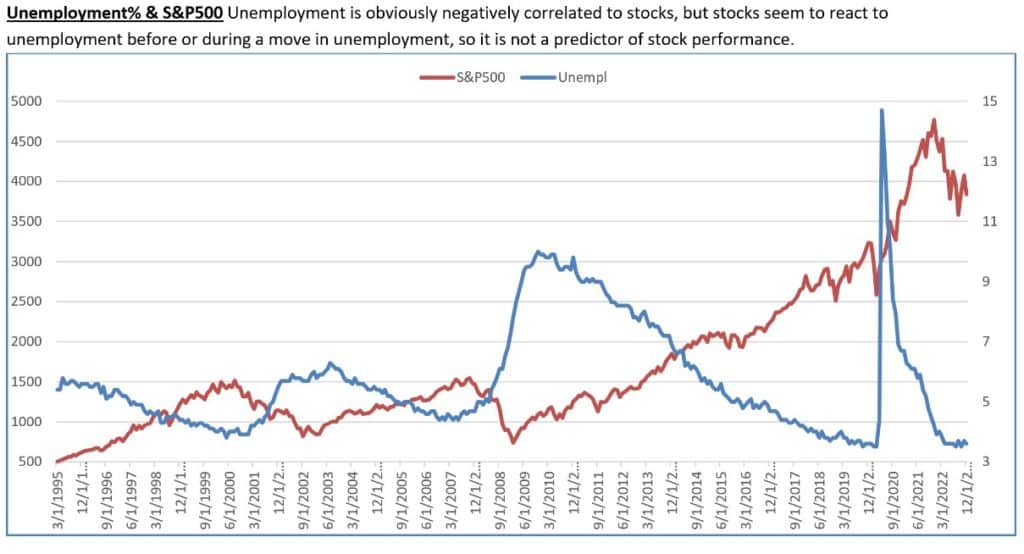
- Unemployment
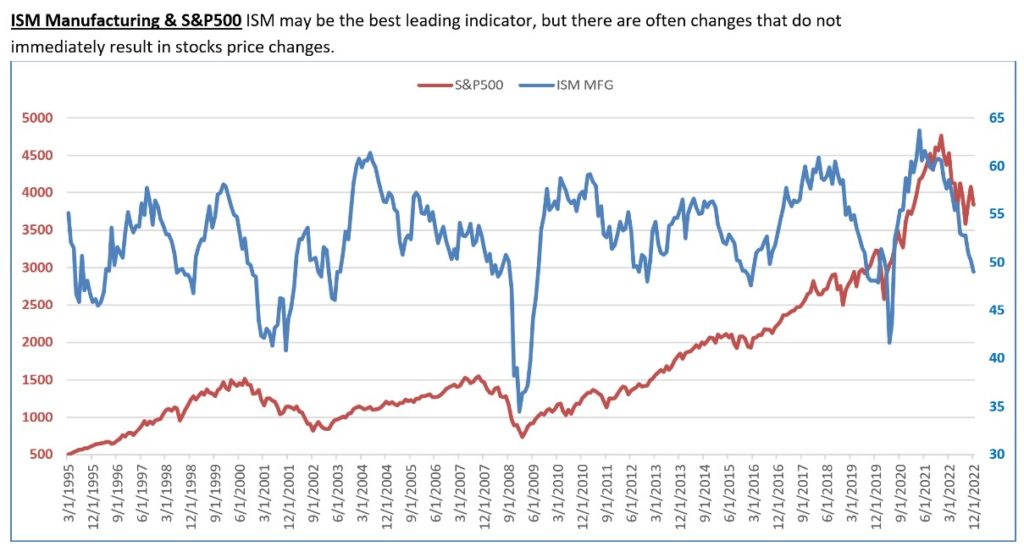
- ISM Manufacturing
- Consensus – the Bank of America Global Fund Manager Survey (The December survey covered 281 fund managers with $728 billion under management.)
Their conclusion: “BofA December Global Fund Manager Survey FMS in a Nut: investors bearish growth, bullish China reopening, v bullish inflation & bonds, bearish US$, short covering stocks, tech, EM, Europe; bond bears burnt but FMS cash levels still high (5.9%), risk appetite still low, allocation still defensive (BofA Bull & Bear Indicator @ 2.6)…we say Jan/Feb “pain trade” is up for bond yields & risk assets.”
Consensus Indicators we used:
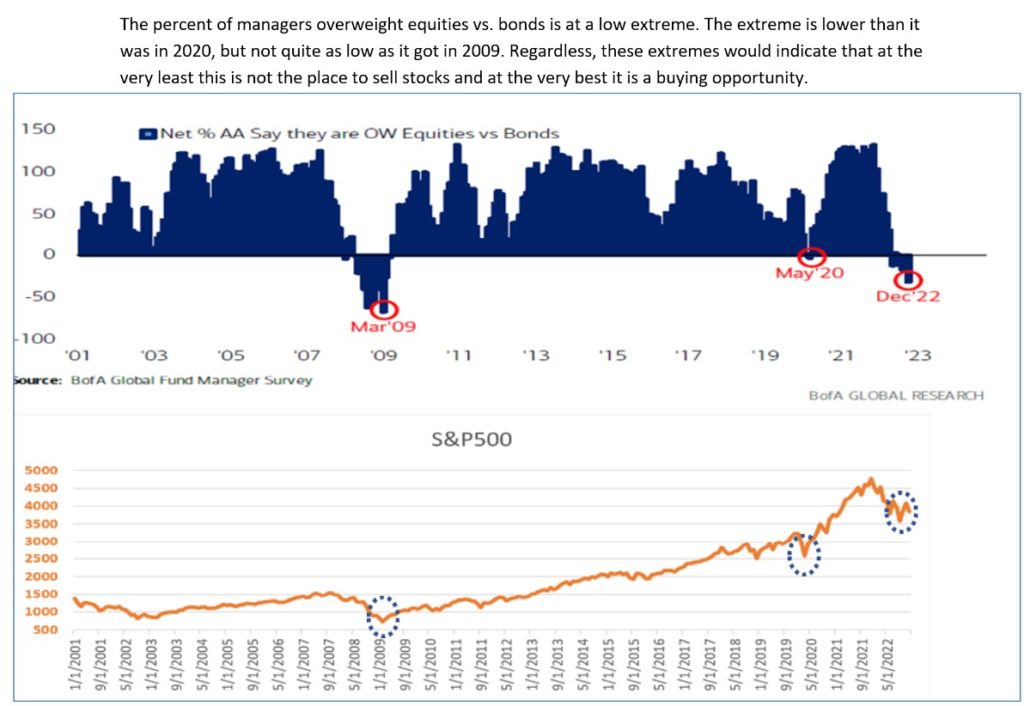
- Precent overweight long equities vs. bonds
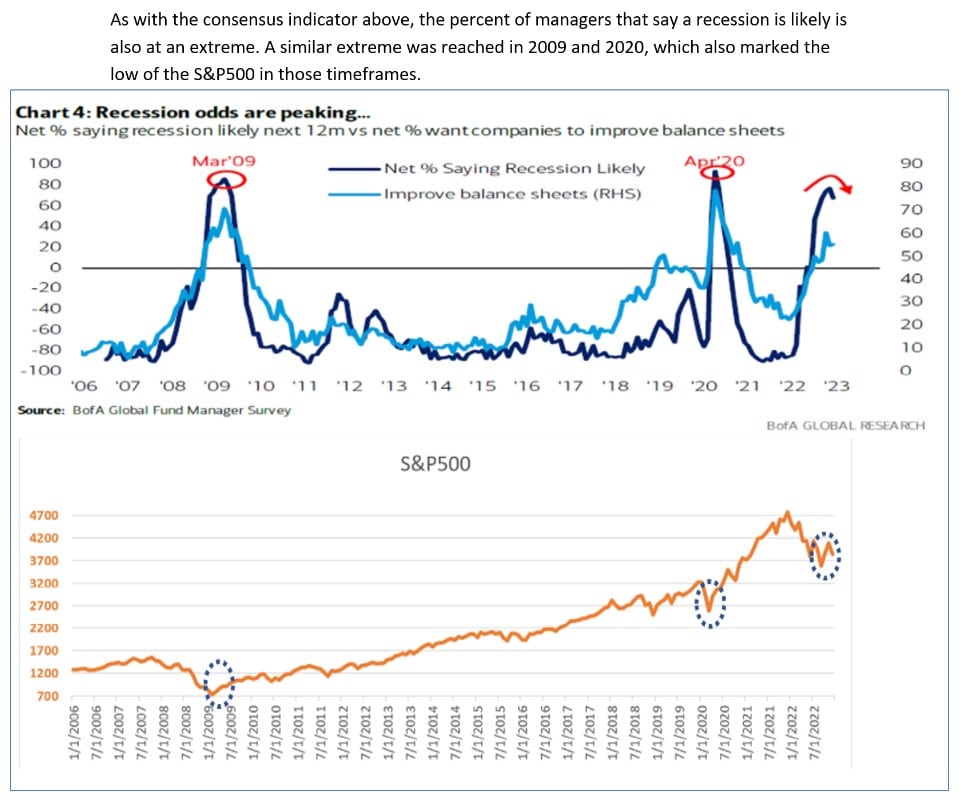
- Percent that say a recession is likely
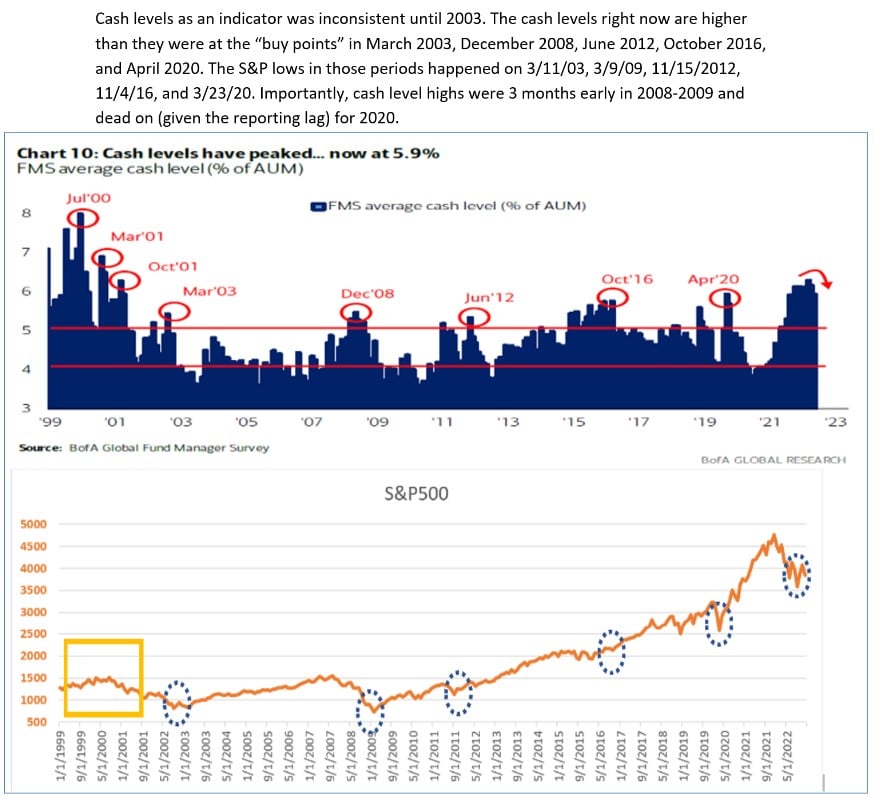
- Average cash level (%)


Conclusions:
- The economy has yet to show the problems many are forecasting. Looking at the current numbers versus historical averages, the economy looks like it is still in good shape.
- 2 of the 3 economic variables have declines as the stock market has retreated (employment remains strong). It is difficult to know what to take away from these recent declines as we look at the historic evidence.
- Consensus numbers speak of true panic. Historically, when the numbers have reached these extremes, the market is closer to a buy than a sell.


Jeff Marcus founded Turning Point Analytics (TPA) in 2009 after 25 years on trading desks and 13 years as a head trader to provide strategic and technical research to institutional clients. Turning Point Analytics (TPA) provides a unique strategy that works as an overlay to clients’ good fundamental analysis. After 10 years of serving only large institutions, TPA now offers its research services to mid and small managers, RIA’s, and wealthy sophisticated individuals looking for a way to increase their returns and outperform their peers.
Subscribe 2 Week Trial
Customer Relationship Summary (Form CRS)