


We share the Weekly Gamma Bands Update by Viking Analytics. The report uses options gamma to help you better manage risk and your equity allocations.
The S&P 500 (SPX) closed nearly 185 points lower on the week ending March 10th, and more than 125 points below the gamma flip level near 3,988.
The gamma band model enters the week with a 30% allocation to the SPX. The model will flip to a full allocation when the slope of the gamma neutral line turns positive. The model will increase to a higher allocation if the market rises and closes above the gamma flip level, currently near 3,988. This model will fall to a 0% allocation if SPX closes below the lower gamma level currently near 3,854.
The chart below shows how price (in black) relates to the gamma flip (in blue) and the lower gamma level (in red). The indicator below the price chart shows the daily positioning allocations.
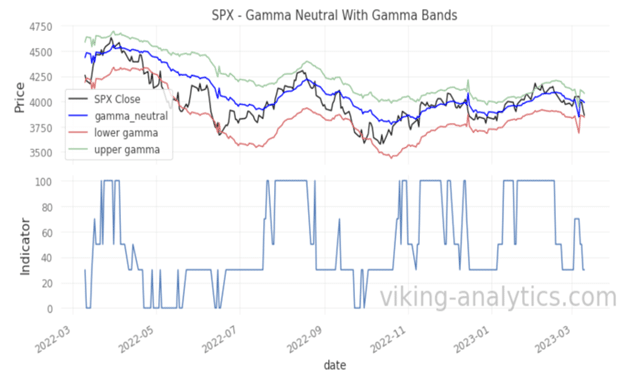
The Gamma Band model can be viewed as a trend following model that is shows the effectiveness of tracking various levels of market gamma. When the daily price closes below Gamma Flip, the model will reduce exposure to avoid price volatility and sell-off risk. There is also an allocation adjustment on the trend slope of the gamma flip line.
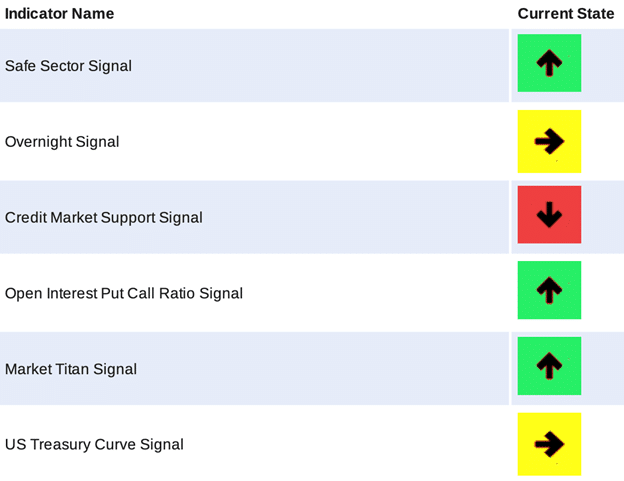
Market Navigator Signals
Our Market Navigator Report encapsulates data from the broader market and the economy to provide a near-term outlook for the stock market. At the moment, our signals provide a mixed outlook.
Please visit our website for more information or to download sample reports.
Disclaimer
This is for informational purposes only and is not trading advice. The information contained in this article is subject to our full disclaimer on our website.
[1] The Gamma Band model in our SPX Market Report adjusts position size DAILY based upon the daily closing levels of SPX value and calculated Gamma Neutral. The Weekly Gamma Band model is shown for illustrative purposes only.
Authors
Erik Lytikainen, the founder of Viking Analytics, has over twenty-five years of experience as a financial analyst, entrepreneur, business developer and commodity trader. Erik holds an MBA from the University of Maryland and a BS in Mechanical Engineering from Virginia Tech.
Rob McBride has 15+ years of experience in the systematic investment space and is a former Managing Director at a multi-billion dollar hedge fund. Rob has deep experience with market data, software and model building in financial markets. Rob has a M.S. in Computer Science from the South Dakota School of Mines and Technology.

Erik Lytikainen, the founder of Viking Analytics, has over twenty five years of experience as a financial analyst, entrepreneur business developer and commodity trader. Erik holds an MBA from the University of Maryland and a BS in Mechanical Engineering from Virginia Tech. You can learn more about his work on his website: www.viking-analytics.com.