


We share the Weekly Gamma Bands Update by Viking Analytics. The report uses options gamma to help you better manage risk and your equity allocations.
This week we share the Gamma Band update and a proprietary article Viking Analytics only released to their clients.
Gamma Band Update
The S&P 500 (SPX) closed 75 points higher on the week ending March 3rd, and 25 points above the gamma flip level near 4,020.
Our gamma band model enters the week with a 70% allocation to the SPX. The model will flip to a full allocation when the slope of the gamma neutral line turns positive. The model will drop to a 30-50% allocation if the market falls and closes below the gamma flip level, currently near 4,020. This model will fall to a 0% allocation if SPX closes below the lower gamma level currently near 3,870.
The chart below shows how price (in black) relates to the gamma flip (in blue) and the lower gamma level (in red). The indicator below the price chart shows the daily positioning allocations.
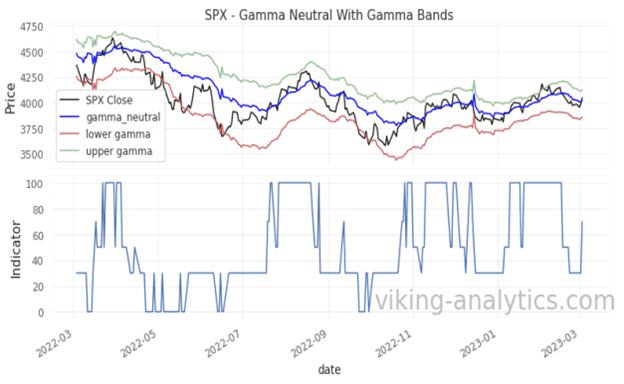
The Gamma Band model[1] can be viewed as a trend following model that is shows the effectiveness of tracking various levels of market gamma. When the daily price closes below Gamma Flip level, the model will reduce exposure to avoid price volatility and sell-off risk. There is also an allocation adjustment whether the trend of gamma flip is positive or negative. If the market closes below what we call the “lower gamma level,” the model will reduce the SPX allocation to zero.
The main premise of this model is to maintain high allocations to stocks when risk and corresponding volatility are expected to be low. For investors who have been conditioned to “buy low and sell high,” it is counter-intuitive to increase allocations when the market rises, but this approach has shown to increase risk-adjusted returns in the back-test.
The Gamma Band model is one of several indicators that we publish daily in the SPX Report (click here for a sample report). Another report (the Market Navigator Report) provides signals from the broader market and the economy as a whole. At the moment, our signals are leaning favorable/bullish.
Please visit our website to learn more about our daily reports.
Overnight Divergence
The overnight return in US equity indices has been well researched. In a recent article published by The Federal Reserve Bank of NY titled “The Overnight Drift” they highlight that the largest positive returns are between 2 and 3 in the morning US Eastern Time. They conclude the reason for this is from order imbalance during the U.S. close which tends to mean revert when the balance is negative. Stated in simple terms, when U.S. stock indices go on sale, European buyers load up at 2 am. If US stock indices rally into the close the European buyers wait for another sale. This creates a positive bias in the overnight returns.
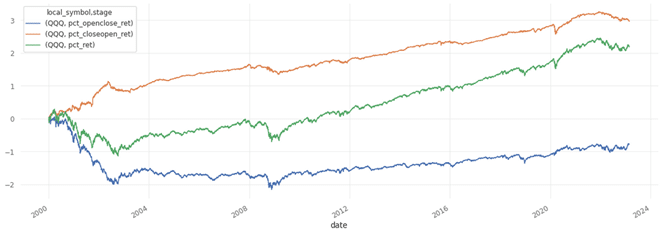
How large is this ‘overnight drift’? Figure 1 shows QQQ from 2000 to 2023. This is a non-compounding cumulative sum of the daily percent returns. The blue line is the open to close period, the intraday return. The orange line is the close-to-open period, the overnight return. The green line is the buy-and-hold return. As you can see, there is a long and persistent deviation in the cumulative returns for intra-day and overnight periods.
Figure 1
In addition to the persistently higher returns in the overnight session, we have found that divergences between the overnight and the intra-day period can highlight trouble ahead. The intra-day traders and the overnight traders have different perspectives on risk and reward. The overnight trading flows are more likely to be large institutions; the intra-day trading flows include retail day traders and meme stock traders. In the best environment, both groups are comfortable taking risk. When one of them takes their chips off the table, it is generally a good idea to lower your risk threshold.
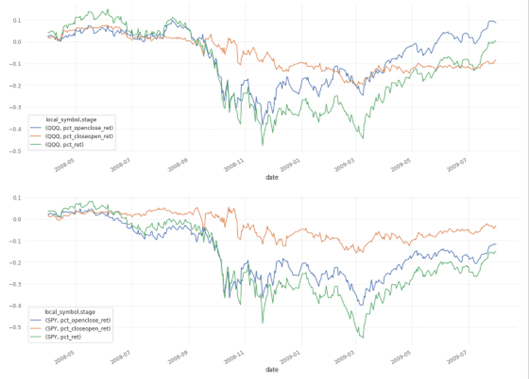
Let’s consider July 2007 to March 2008 in Fig 2 below. At the start day, traders (Blue line), and institutional traders (Orange line) were comfortable with QQQ and SPY. The first cracks appeared in SPY in late July as day traders sold and institutional traders held steady. In November QQQ begins to show stress as day traders sell and institutional traders continue to hold steady. From the December 2007 to January 2008 time frame the cracks further develop and institutional traders begin to take risk off the table in late January.
Figure 2
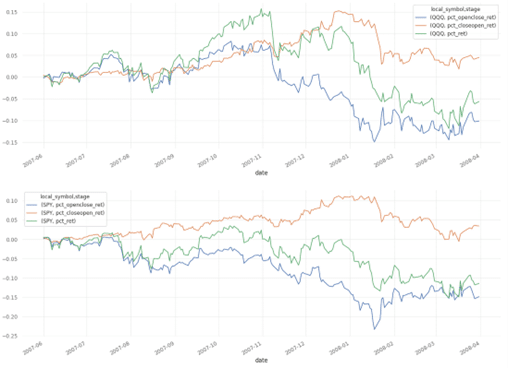
In Figure 3 we see the cracks develop into a market meltdown from September through December 2008. The day traders again are the first to take risk off, later joined by the institutional market, which accelerates the descent from September 2008 to March 2009.
Figure 3
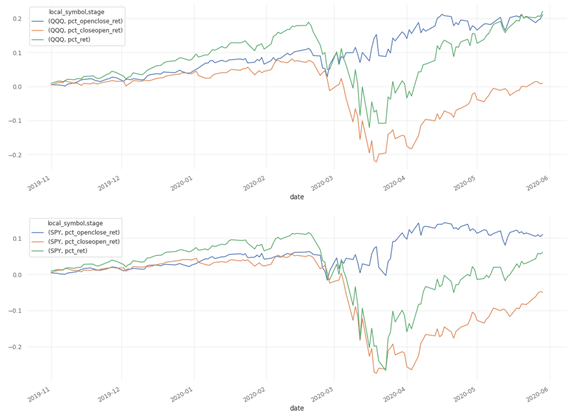
This same pattern appears in late 2019 leading into 2020 in Fig 3. From November 2019 to late February 2020, both groups are tracking each other. In late February and early March 2020, the institutional group sells off while day traders maintain exposure. Perhaps this is due to the growth of no-fee trading on platforms such as Robinhood combined with people stuck at home. Whatever the case, we again see the pattern of overnight-to-intraday divergence and eventual market sell-off.
Figure 4
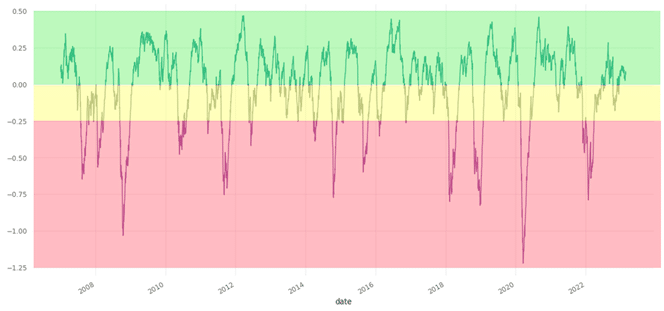
To reduce the overnight-to-intraday divergence into a signal, we can take the absolute value of the difference in daily percent return during the night from the percent return during the day. We then normalize and smooth the result and get the chart in Figure 5. The x-axis can be viewed as how far today’s divergence is relative to recent history. The area above zero indicates convergence, while the area below indicates divergence.
Figure 5
To demonstrate the effectiveness of this signal, we created a historical scenario where we are fully long when the signal is in the green area and reduce the position to 20% QQQ and 80% cash when the signal is in the red area. The yellow area can be considered as holding the current position. A backtest of this trading QQQ results in Figure 5. The blue line is the indicator and is either 100% allocation or 20% to QQQ. The orange line is the resulting cumulative non-compounding profit and loss.
Figure 5: QQQ traded using the divergence signal from 2007 to 2023
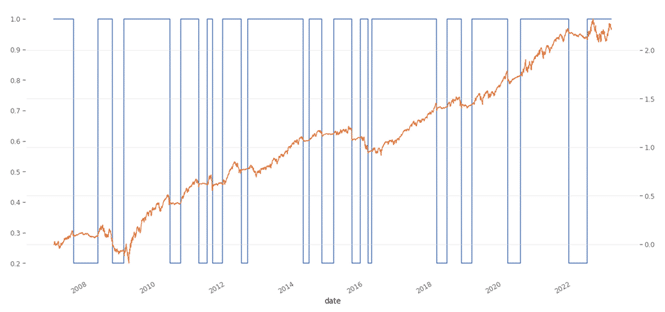
This strategy increases the Sharpe of QQQ from 0.67 to 0.86 over this period. A major part of this improvement is from the drop in annualized risk from 23% to 16%. The takeaway from this chart is reducing exposure in drawdowns provides a better risk/return ratio.
Reference:
Disclaimer
This is for informational purposes only and is not trading advice. The information contained in this article is subject to our full disclaimer on our website.
[1] The Gamma Band model in our SPX Market Report adjusts position size DAILY based upon the daily closing levels of SPX value and calculated Gamma Neutral. The Weekly Gamma Band model is shown for illustrative purposes only.
Authors
Erik Lytikainen, the founder of Viking Analytics, has over twenty-five years of experience as a financial analyst, entrepreneur, business developer and commodity trader. Erik holds an MBA from the University of Maryland and a BS in Mechanical Engineering from Virginia Tech.
Rob McBride has 15+ years of experience in the systematic investment space and is a former Managing Director at a multi-billion dollar hedge fund. Rob has deep experience with market data, software and model building in financial markets. Rob has a M.S. in Computer Science from the South Dakota School of Mines and Technology.

Erik Lytikainen, the founder of Viking Analytics, has over twenty five years of experience as a financial analyst, entrepreneur business developer and commodity trader. Erik holds an MBA from the University of Maryland and a BS in Mechanical Engineering from Virginia Tech. You can learn more about his work on his website: www.viking-analytics.com.