


Does Seasonality Point to a Bottom in March?
After a tough week in stocks, investors are wondering whether the worst is over or whether they should prepare for additional downside. Does seasonality provide any clues? Will March create a bottom under which the market can continue this year’s rally?
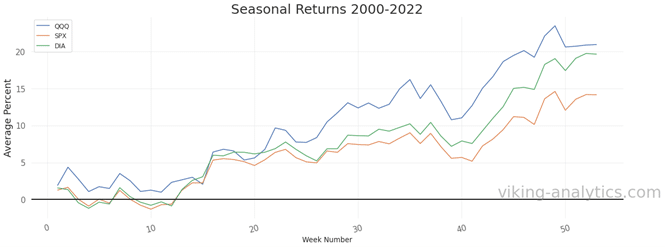
Looking at average annual weekly returns in the S&P 500 (SPX), QQQ and DIA, we see that stock indices often have a nearby bottom in March. This was true during the 2020 pandemic sell-off, as well as the capitulation bottom in March 2009 in the aftermath of the financial market crisis. The chart below shows that weeks 10 through 12 tend to record the low in stocks for a given year. And while March can experience a mid-month swoon, on average it tends to finish the month higher than it started.
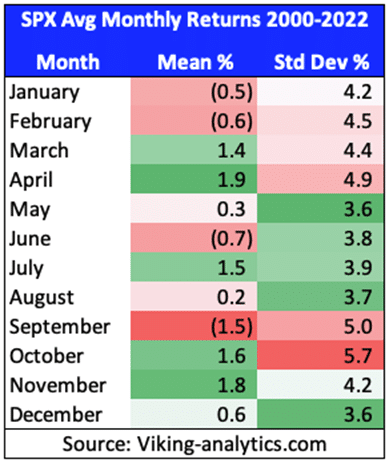
When we look at total monthly returns from 2000 through 2022, March has an average return of 1.4% for SPX with a standard deviation of over 4.4%. September is on average the worst month for stocks, with an average return of under -1.5%. October has the highest standard deviation of over 5.7%. One important takeaway from the table below is the standard deviation of returns is greater than the average returns, so caution should be taken when using seasonality for firm directional bias.
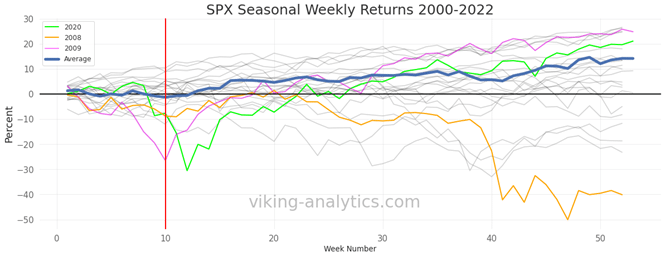
The chart below shows each year’s weekly returns from 2000 through 2022, with three key years highlighted. We can see that March had key reversal bottoms in March in both 2009 and in 2020. The weekly closing bottom in 2009 was in week 10 (where we are now), and the annual bottom in 2020 occurred in week 12. The year 2008 had a short-term bottom in March, which was followed by a sell-off which accelerated later in the year.
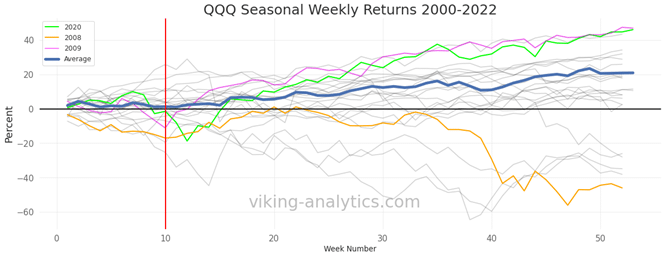
Tech stocks also had March weekly closing bottoms in 2009 and 2020. Tech stocks had a weekly closing low in April 2002 which represented a more than 40% drawdown for the year.
Seasonality Adjustments in Practice
Quantitative funds will pay attention to these seasonal patterns for stocks, but not as a primary investment strategy. The best use of seasonality is to help make minor adjustments to your current position. This is due to the large amount of variation around the average return each month. So, if your investment thesis is telling you to be short, but the season pattern in October and November is positive you might reduce the size of your short, but you would not flip signs. Season patterns in equities are often hit or miss.
Near-Term Outlook
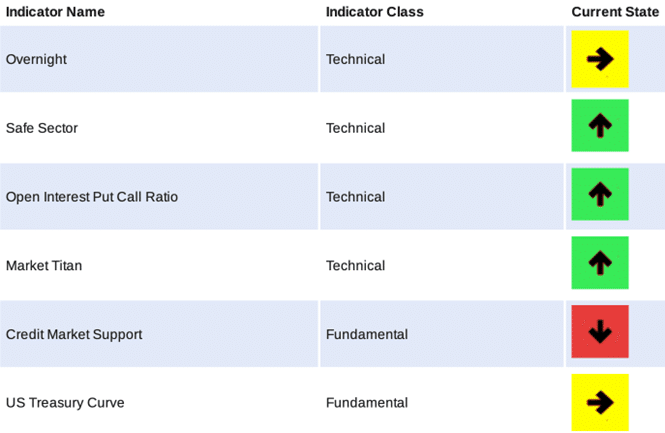
Our near-term outlook for stocks is summarized in our Market Navigator Report. We see the fundamental picture as bearish due to the inverted yield curve and increasing credit market stress. The current troubles in the banking sector exacerbate these concerns. Investors should remain fundamentally cautious. On the other hand, various technical signals continue to point to a resumption in the 2023 stock market rally.
Quad Witching Risk
Next Friday March 17th is quad witching day, which can exacerbate volatility particularly if SPX remains meaningfully below 4,000. At the 4,000 option strike, there is a large concentration of call and put open interest which could create a potential pin on Friday if the market recovers from current levels near 3,900. If the market continues to sell off next week, then the institutional put sellers may be forced to sell SPX in order to hedge their exposure. This forced selling scenario has tended to amplify sell-offs in and around quarterly expirations in the recent past (December 2018 and March 2020).
Final Thoughts
Through the first 8 trading days, we are down 2.7% in March. The banking sector risk and other fundamental factors could continue to weigh on the market. Holding current levels will be important as we head later into next week’s quad witching day. We would view a close above 3,900 next week as positive for stocks. A recovery over 4,000 will be even better, particularly if the narrative surrounding banking risk begins to subside.
Authors
Erik Lytikainen, the founder of Viking Analytics, has over twenty-five years of experience as a financial analyst, entrepreneur, business developer and commodity trader. Erik holds an MBA from the University of Maryland and a BS in Mechanical Engineering from Virginia Tech.
Rob McBride has 15+ years of experience in the systematic investment space and is a former Managing Director at a multi-billion dollar hedge fund. Rob has deep experience with market data, software and model building in financial markets. Rob has a M.S. in Computer Science from the South Dakota School of Mines and Technology.

Erik Lytikainen, the founder of Viking Analytics, has over twenty five years of experience as a financial analyst, entrepreneur business developer and commodity trader. Erik holds an MBA from the University of Maryland and a BS in Mechanical Engineering from Virginia Tech. You can learn more about his work on his website: www.viking-analytics.com.